Business Decision Making Report: Restaurant Location Analysis
VerifiedAdded on 2019/12/03
|19
|4196
|153
Report
AI Summary
This report provides a comprehensive analysis of business decision-making processes, specifically focusing on the feasibility of opening a new restaurant location. It begins with an introduction outlining the importance of decision-making in business and then proceeds to detail the sources used for data collection, including primary and secondary data. The report describes the methodology for conducting a questionnaire survey, including the sampling frame and the questionnaire itself. The analysis section covers various data analysis techniques, such as measures of dispersion, quartiles, percentiles, and correlation coefficients, along with the interpretation of results. The report further demonstrates how to produce information in appropriate formats using graphs and trend lines within spreadsheets. The inclusion of a business presentation and a formal business report exemplifies the effective communication of findings. Finally, the report explores the use of software-generated information for making decisions at operational, tactical, and strategic levels, incorporating financial tools like payback period, internal rate of return, and net present value to assess investment projects. The conclusion summarizes key findings and recommendations, while the references and illustrations support the analysis.
BUSINESS DECISION MAKING
1
1
Paraphrase This Document
Need a fresh take? Get an instant paraphrase of this document with our AI Paraphraser
TABLE OF CONTENTS
INTRODUCTION................................................................................................................................5
TASK 1 SOURCES FOR THE COLLECTION OF DATA.................................................................5
1.1 Collection of primary and secondary data............................................................................5
1.2 Survey methodology and sampling frame............................................................................5
1.3 Questionnaire for a survey....................................................................................................6
TASK 2 RANGE OF TECHNIQUES TO ANALYSE DATA .............................................................7
2.1 Information for decision making...........................................................................................7
2.2 Analyse the results to draw valid conclusions.......................................................................8
2.3 Analyse data using measures of dispersion...........................................................................9
2.4 Analysis of quartiles, percentiles and the correlation coefficient.........................................9
TASK 3 PRODUCE INFORMATION IN APPROPRIATE FORMATS...........................................10
3.1 Graphs using spreadsheets and draw valid conclusions......................................................10
3.2 Trend lines in spreadsheet graphs to assist in forecasting sales revenue............................11
3.3 Business presentation..........................................................................................................12
3.4 Formal business report........................................................................................................12
TASK 4 SOFTWARE GENERATED INFORMATION TO MAKE DECISIONS...........................13
4.1 Information processing tools for operational, tactical and strategic level decisions...........13
4.2 Plan for the activity.............................................................................................................14
4.3 Financial tools for decision making....................................................................................16
CONCLUSION..................................................................................................................................17
REFERENCES...................................................................................................................................19
2
ILLUSTRATION INDEX
Illustration 1: Histogram for revenue and profit.................................................................................10
Illustration 2: Line chart for revenue and profit.................................................................................11
Illustration 3: Trend line.....................................................................................................................12
Illustration 4: Gantt Chart...................................................................................................................15
Illustration 5: Network Diagram........................................................................................................15
Illustration 6: Gantt Chart...................................................................................................................16
3
⊘ This is a preview!⊘
Do you want full access?
Subscribe today to unlock all pages.
Trusted by 1+ million students worldwide
INDEX OF TABLES
Table 1: 10 Year financial data.............................................................................................................7
Table 2: Revenue Statistics...................................................................................................................7
Table 3: Profit Statistics........................................................................................................................8
Table 4: Quartile...................................................................................................................................9
Table 5: Percentile................................................................................................................................9
Table 6: Correlation Coefficient.........................................................................................................10
Table 7: Plan for the activity...............................................................................................................14
Table 8: Financial Information...........................................................................................................16
Table 9: Pay Back Period....................................................................................................................16
Table 10: Internal rate of return..........................................................................................................17
Table 11: Net Present Value................................................................................................................17
4
Paraphrase This Document
Need a fresh take? Get an instant paraphrase of this document with our AI Paraphraser
INTRODUCTION
Decision making plays a crucial role in every business as it assist in prudent judgement with
the support of feasibility and profitability. It thus requires a through research in the internal and
external environment of the business environment so that each area is examined properly. In respect
with this, the following report is prepared on decision making for a new restaurant location. The
report covers market and financial feasibility analysis to design strategies to achieve the targets.
Previous financial performance of the existing chain is also examined to forecast the future
performance. Along with this, different investment projects are also analysed in terms of feasibility
to carry out the activities.
TASK 1 SOURCES FOR THE COLLECTION OF DATA
1.1 Collection of primary and secondary data
The purpose of market research is to collect and analyse consumer perception for the
existing restaurant. It thus helps in determining the strengths and weaknesses to take necessary
actions. Different sources are identified for collection of information to examine the internal and
external environment of the business (Bai, Nunez and Kalagnanam, 2012). Primacy - A structured questionnaire survey is used to collect first hand information from
the customers who regularly visit restaurants for dining out. This helps in analysing the
preferences and choice of customer in terms of food variety, quality, prices, decor, and many
more (Desai, 2008). Although questionnaire consumed time and cost, but provide valuable
information from the customer's side.
Secondary - Information already collected by another person for some other purpose comes
under secondary data. For the present market research, data from online websites, books,
journals and case studies are obtained to analyse various other variables such as trends in the
industry, upcoming events, presence of competitors and market share (Hoaglin, 2003).
Both these sources contributes effectively to get insight into the current and future trends of
the restaurant industry.
1.2 Survey methodology and sampling frame
Survey methodology assist in developing a systematic plan to carry out collection of data
through questionnaire survey. To investigate into the consumer behaviour for the existing branch of
restaurant, questions related with menu choices, quality and price are taken into consideration. The
questionnaire survey is completed in a day's activity (Morato, 2013). Specific locations that attracts
huge number of crowd are selected, so that valid opinions are collected. The sample population for
5
the questionnaire survey is limited to 15 respondents. Although more than 40 questionnaire were
distributed, but only 20 received back. Among the total received, there were only 15 which were
fully completed. According to the plan, incomplete questionnaires were not taken into consideration
for the analysis.
1.3 Questionnaire for a survey
Demographic profile
1. Age
20-30
30-40
40-50
Above 50
2. Gender
Male
Female
LGBT
3. Occupation:
4. Monthly household Income:
5. Size of the household:
6. Marital status:
7. Presence of children:
8. How frequently do you visit restaurant on monthly basis?
Less than one
Weekly
Bi weekly
Bi monthly
9. what time do you prefer for dining out?
Breakfast
Lunch
Afternoon
Dinner
10. How do you like menu choices at Moonlight
6
⊘ This is a preview!⊘
Do you want full access?
Subscribe today to unlock all pages.
Trusted by 1+ million students worldwide
Ok
Good
Very Good
Excellent
11. How do you find prices of food at Moonlight?
Ok
Good
Very Good
Excellent
12. How do you find food quality at Moonlight?
Ok
Good
Very Good
Excellent
TASK 2 RANGE OF TECHNIQUES TO ANALYSE DATA
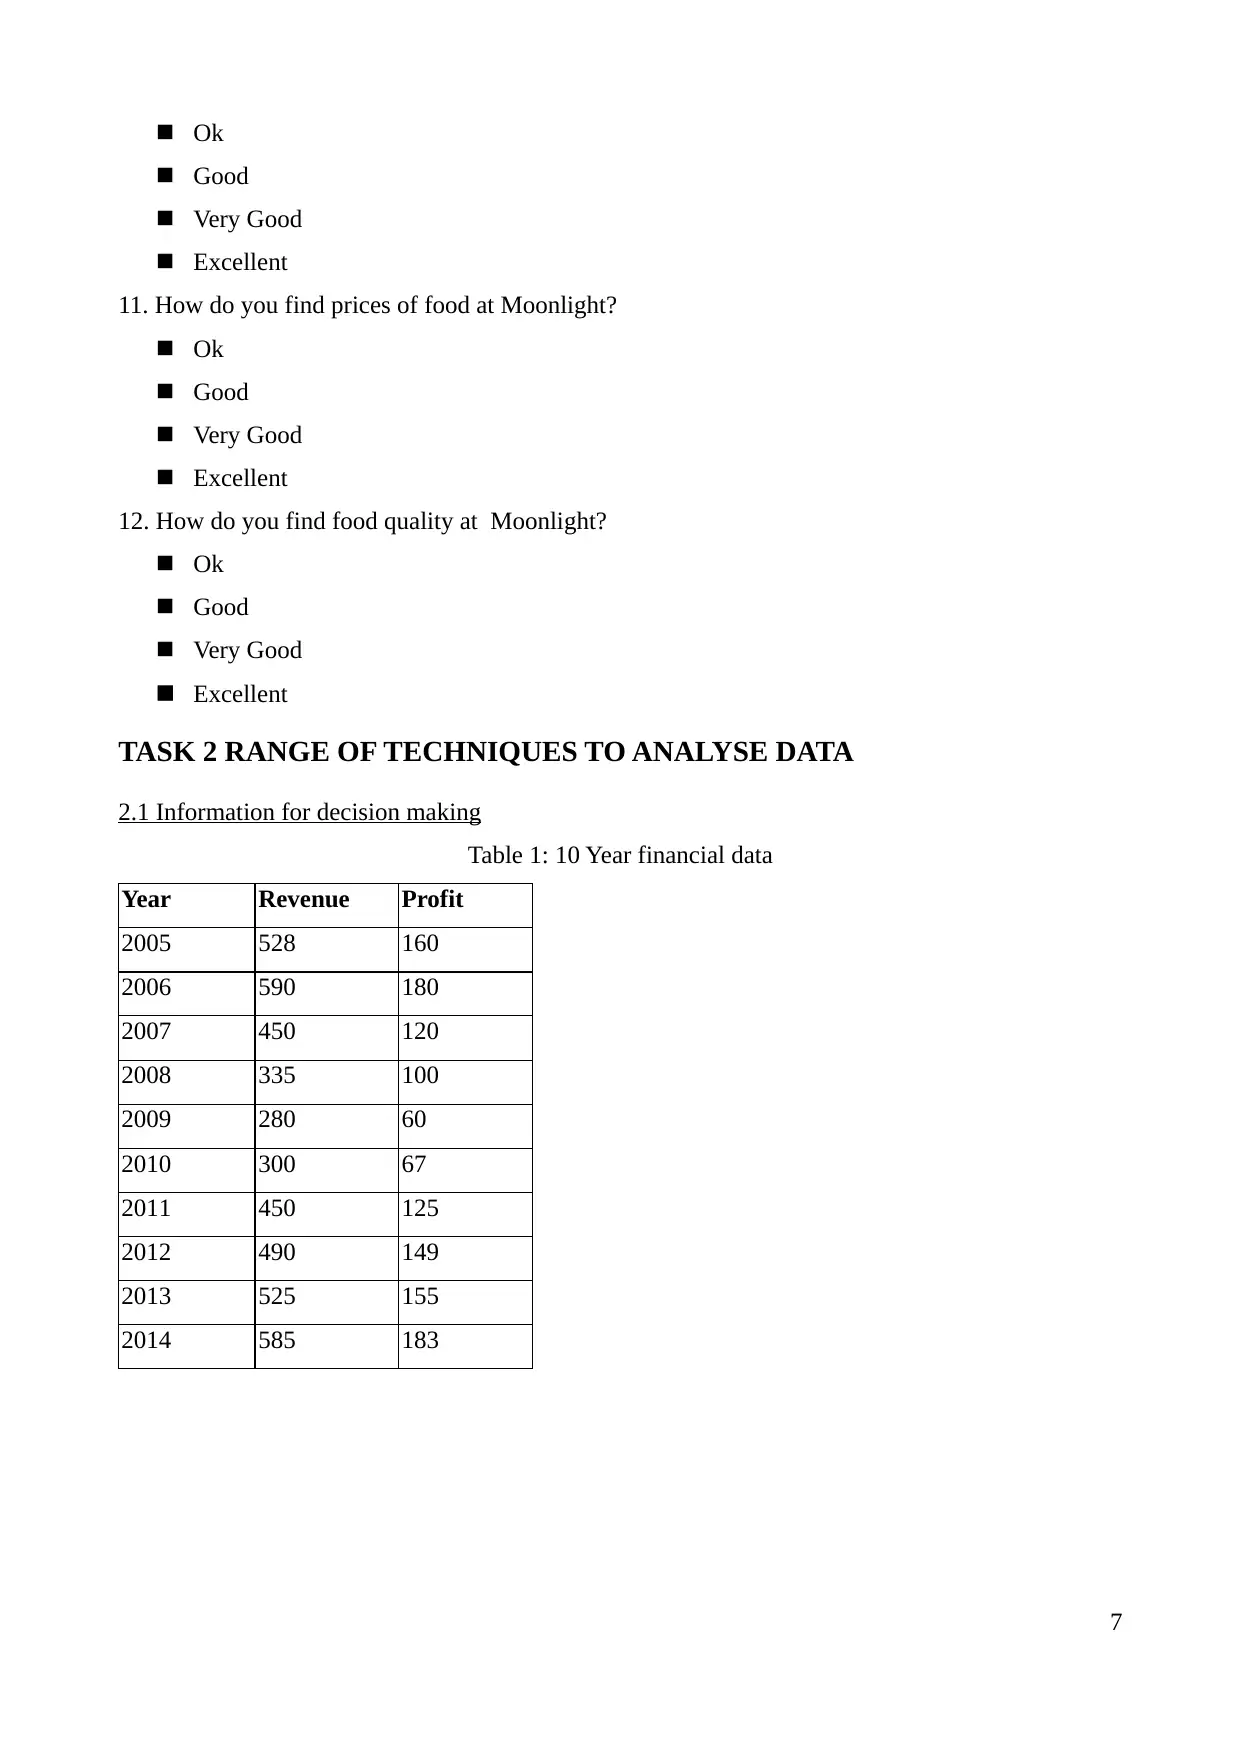
2.1 Information for decision making
Table 1: 10 Year financial data
Year Revenue Profit
2005 528 160
2006 590 180
2007 450 120
2008 335 100
2009 280 60
2010 300 67
2011 450 125
2012 490 149
2013 525 155
2014 585 183
7
Good
Very Good
Excellent
11. How do you find prices of food at Moonlight?
Ok
Good
Very Good
Excellent
12. How do you find food quality at Moonlight?
Ok
Good
Very Good
Excellent
TASK 2 RANGE OF TECHNIQUES TO ANALYSE DATA
2.1 Information for decision making
Table 1: 10 Year financial data
Year Revenue Profit
2005 528 160
2006 590 180
2007 450 120
2008 335 100
2009 280 60
2010 300 67
2011 450 125
2012 490 149
2013 525 155
2014 585 183
7
Paraphrase This Document
Need a fresh take? Get an instant paraphrase of this document with our AI Paraphraser

Table 2: Revenue Statistics
Revenue
Mean 453.3
Standard Error 35.8469121559
Median 470
Mode 450
Standard Deviation 113.3578894965
Sample Variance
12850.011111111
1
Kurtosis -1.2205102304
Skewness -0.4566573894
Range 310
Minimum 280
Maximum 590
Sum 4533
Count 10
Table 3: Profit Statistics
Profit
Mean 129.9
Standard Error 13.7795742556
Median 137
Mode #N/A
Standard Deviation 43.5748398352
Sample Variance 1898.7666666667
Kurtosis -0.9530479149
Skewness -0.4913144776
Range 123
Minimum 60
Maximum 183
Sum 1299
Count 10
8
2.2 Analyse the results to draw valid conclusions Primary Data Analysis - It has been analyse through the questionnaire survey that majority
of customers who regularly visit belong to age group of 25 to 45 years. All genders are
equally interest in dining out on regular basis. Income of respondents who visit restaurants
are between £5000 to £20000. This means that there are customers available for every kind
of food varieties ranging from low to high price (Ofir, Simonson and Yoon, 2009). Majority
of customer visit on weekly basis at the dinner time. this indicates that customer enjoy their
weekend at some restaurants and have quality of time with friends and family. The food
quality and prices are rates excellent in favour of Moonlight. The only thing customer do not
like is variety of food choices.
Secondary Data - Previous 10 years financial data is taken into consideration to analyse the
performance of the existing location. The average sales and profit earned by the restaurant
are £453 and £129. this reflects consistency of the brand to achieve income and manage its
expenses.
The median revenue for the restaurant is £470 and profit is £137. Both the values are higher
than the mean which indicates overall increasing profits for the business (Tracy, 2009). The mode
value for revenue is £450 which means there is repetition the figure more than once in ten years.
There is no mode value for the profit.
The Skewness value for both revenue and profit is negative which indicates data is skewed
to the left. Similarly Kurtosis value for both the variables are also negative which shows data is less
clustered around the mean.
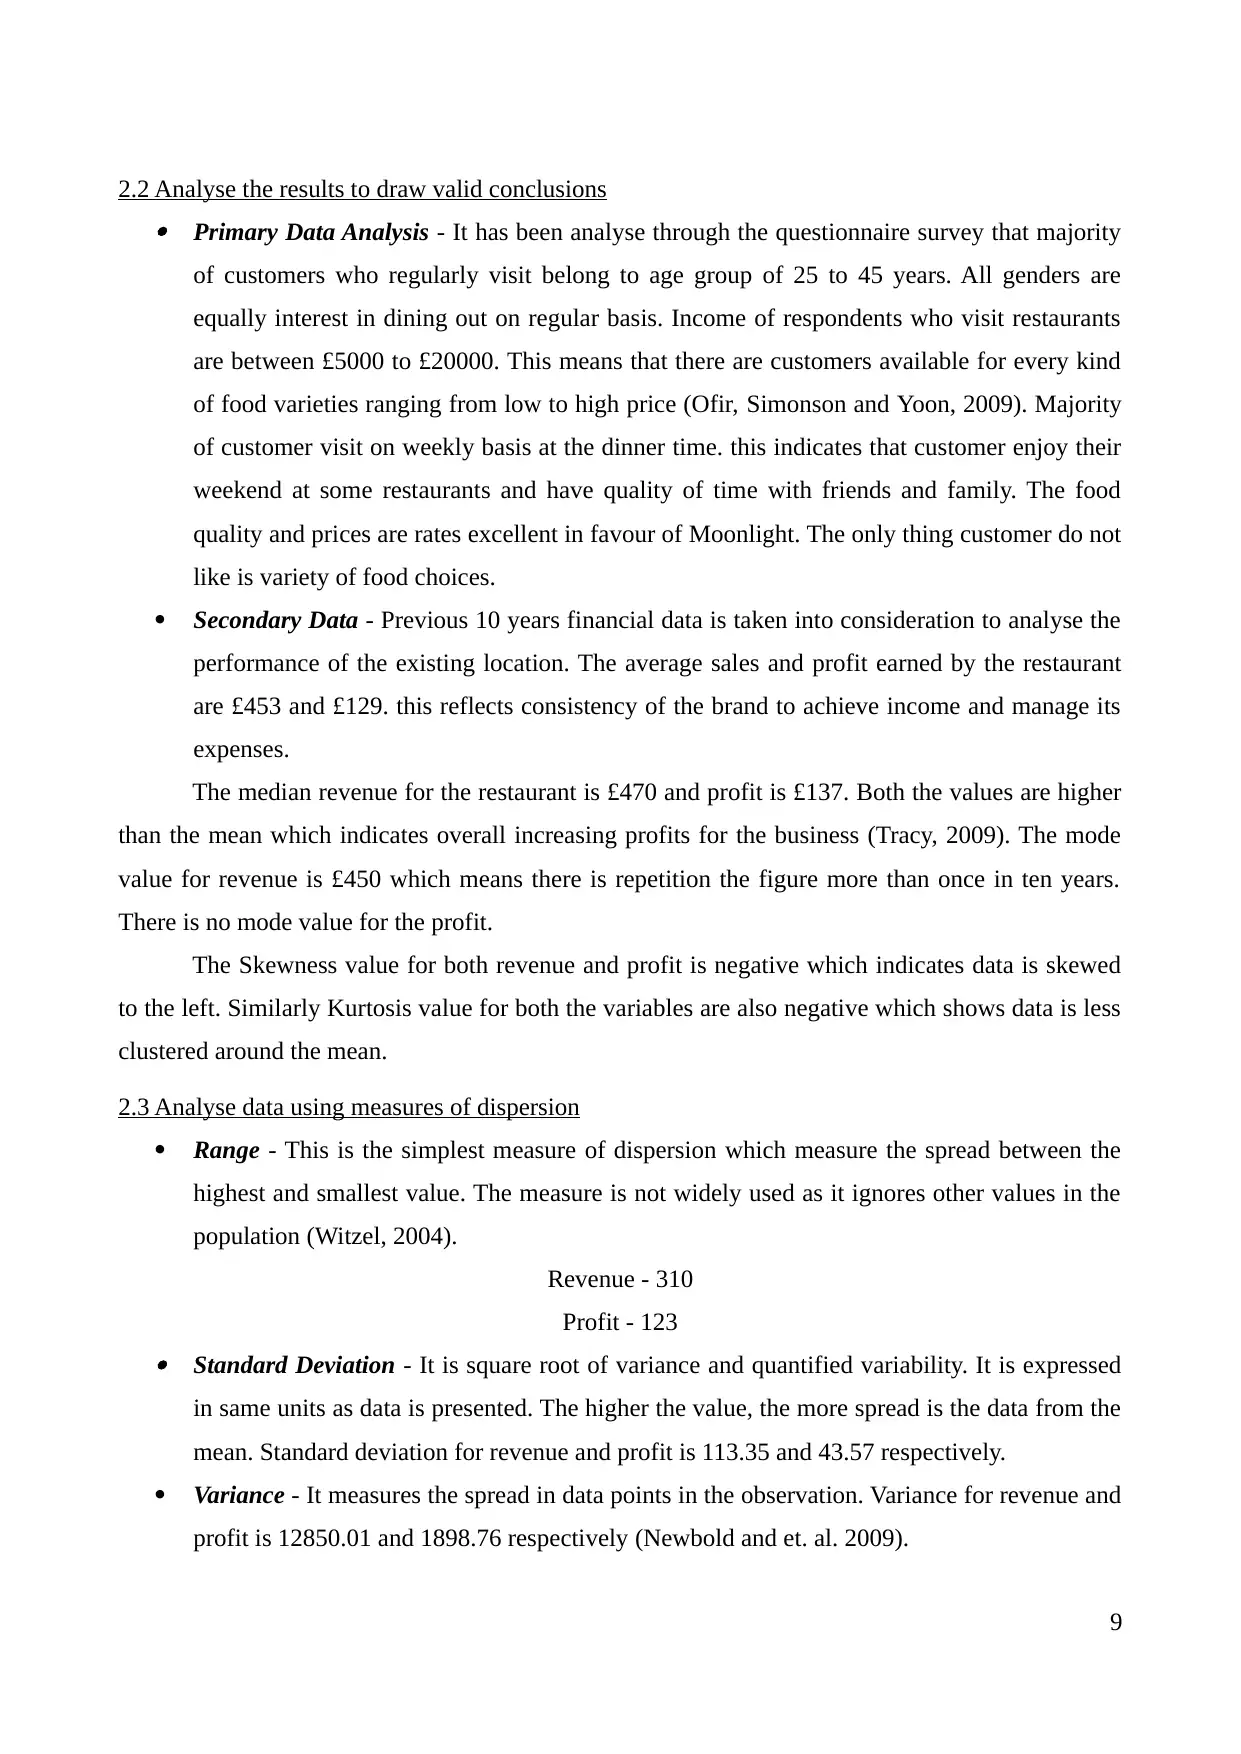
2.3 Analyse data using measures of dispersion
Range - This is the simplest measure of dispersion which measure the spread between the
highest and smallest value. The measure is not widely used as it ignores other values in the
population (Witzel, 2004).
Revenue - 310
Profit - 123 Standard Deviation - It is square root of variance and quantified variability. It is expressed
in same units as data is presented. The higher the value, the more spread is the data from the
mean. Standard deviation for revenue and profit is 113.35 and 43.57 respectively.
Variance - It measures the spread in data points in the observation. Variance for revenue and
profit is 12850.01 and 1898.76 respectively (Newbold and et. al. 2009).
9
of customers who regularly visit belong to age group of 25 to 45 years. All genders are
equally interest in dining out on regular basis. Income of respondents who visit restaurants
are between £5000 to £20000. This means that there are customers available for every kind
of food varieties ranging from low to high price (Ofir, Simonson and Yoon, 2009). Majority
of customer visit on weekly basis at the dinner time. this indicates that customer enjoy their
weekend at some restaurants and have quality of time with friends and family. The food
quality and prices are rates excellent in favour of Moonlight. The only thing customer do not
like is variety of food choices.
Secondary Data - Previous 10 years financial data is taken into consideration to analyse the
performance of the existing location. The average sales and profit earned by the restaurant
are £453 and £129. this reflects consistency of the brand to achieve income and manage its
expenses.
The median revenue for the restaurant is £470 and profit is £137. Both the values are higher
than the mean which indicates overall increasing profits for the business (Tracy, 2009). The mode
value for revenue is £450 which means there is repetition the figure more than once in ten years.
There is no mode value for the profit.
The Skewness value for both revenue and profit is negative which indicates data is skewed
to the left. Similarly Kurtosis value for both the variables are also negative which shows data is less
clustered around the mean.
2.3 Analyse data using measures of dispersion
Range - This is the simplest measure of dispersion which measure the spread between the
highest and smallest value. The measure is not widely used as it ignores other values in the
population (Witzel, 2004).
Revenue - 310
Profit - 123 Standard Deviation - It is square root of variance and quantified variability. It is expressed
in same units as data is presented. The higher the value, the more spread is the data from the
mean. Standard deviation for revenue and profit is 113.35 and 43.57 respectively.
Variance - It measures the spread in data points in the observation. Variance for revenue and
profit is 12850.01 and 1898.76 respectively (Newbold and et. al. 2009).
9
⊘ This is a preview!⊘
Do you want full access?
Subscribe today to unlock all pages.
Trusted by 1+ million students worldwide
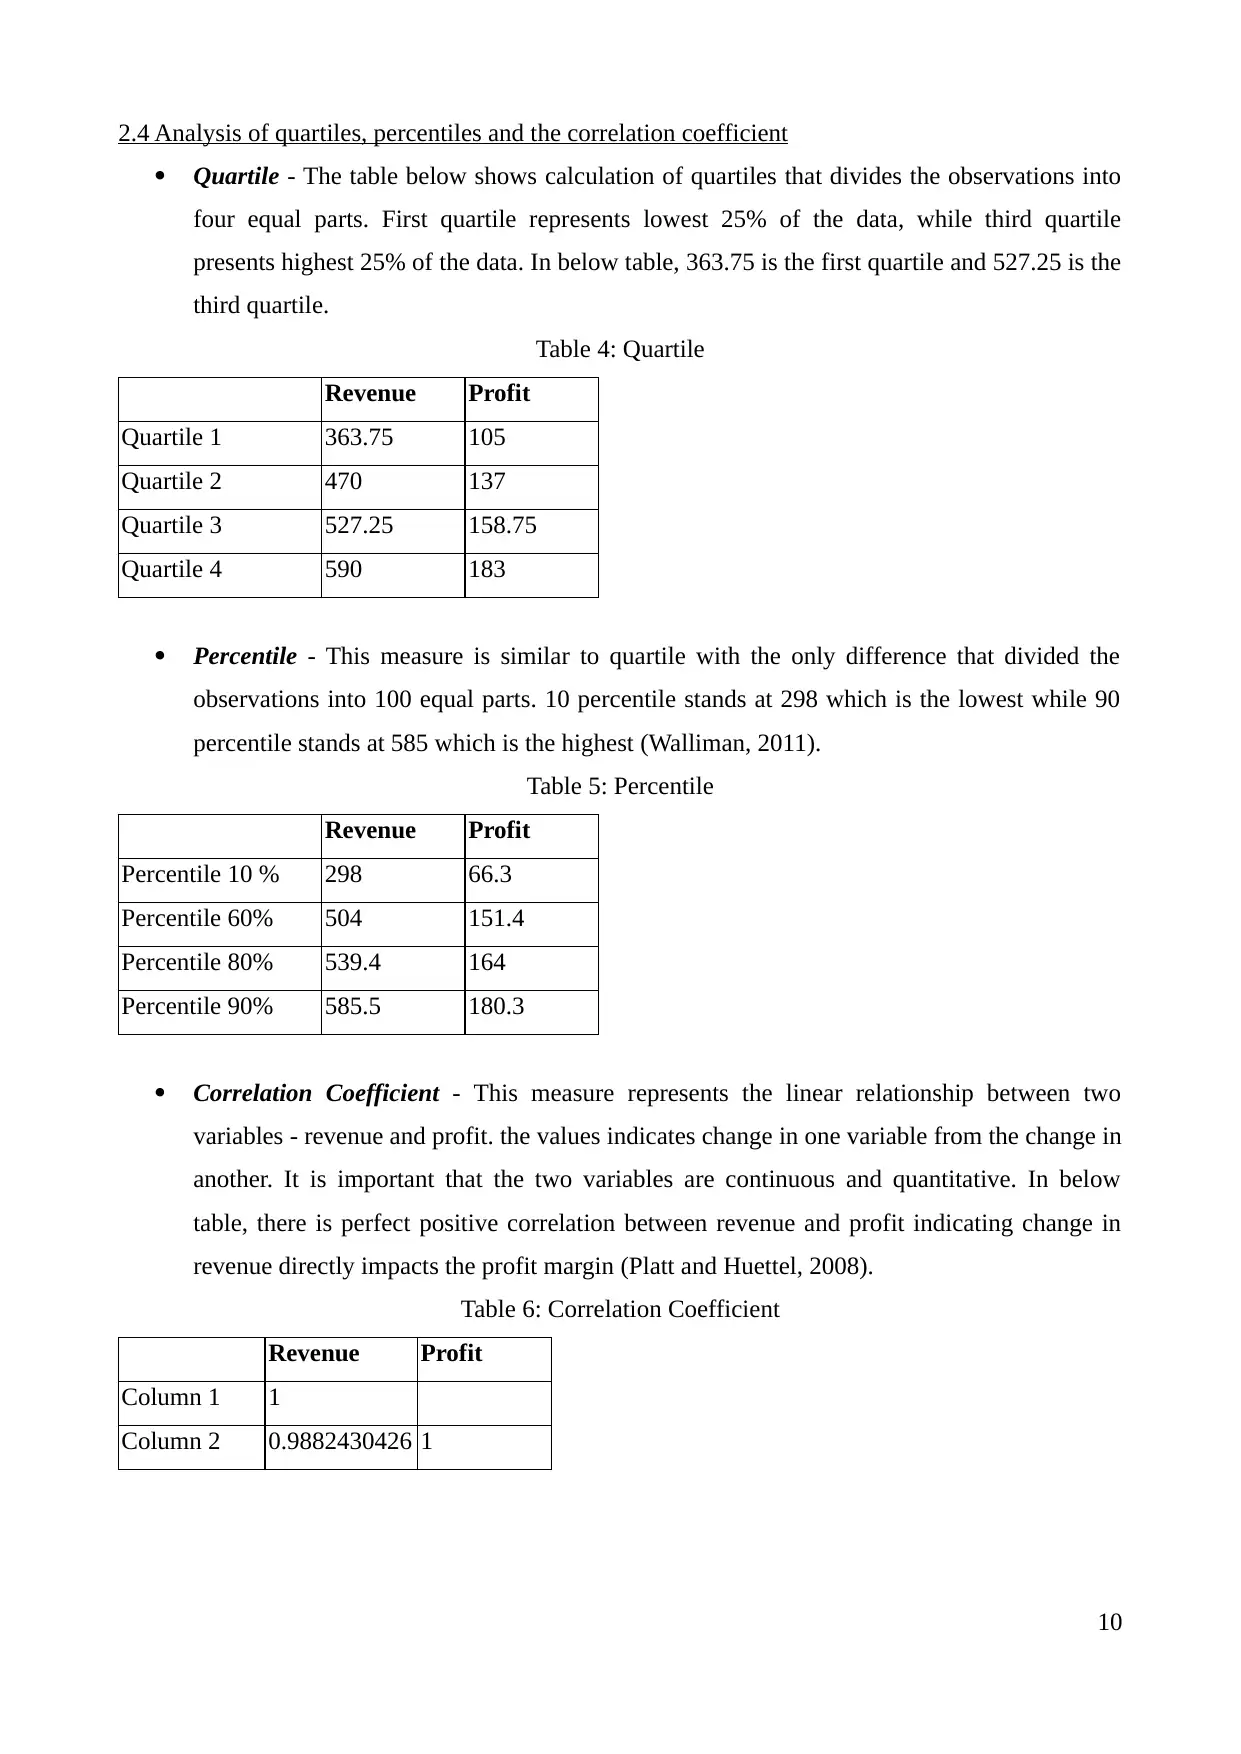
2.4 Analysis of quartiles, percentiles and the correlation coefficient
Quartile - The table below shows calculation of quartiles that divides the observations into
four equal parts. First quartile represents lowest 25% of the data, while third quartile
presents highest 25% of the data. In below table, 363.75 is the first quartile and 527.25 is the
third quartile.
Table 4: Quartile
Revenue Profit
Quartile 1 363.75 105
Quartile 2 470 137
Quartile 3 527.25 158.75
Quartile 4 590 183
Percentile - This measure is similar to quartile with the only difference that divided the
observations into 100 equal parts. 10 percentile stands at 298 which is the lowest while 90
percentile stands at 585 which is the highest (Walliman, 2011).
Table 5: Percentile
Revenue Profit
Percentile 10 % 298 66.3
Percentile 60% 504 151.4
Percentile 80% 539.4 164
Percentile 90% 585.5 180.3
Correlation Coefficient - This measure represents the linear relationship between two
variables - revenue and profit. the values indicates change in one variable from the change in
another. It is important that the two variables are continuous and quantitative. In below
table, there is perfect positive correlation between revenue and profit indicating change in
revenue directly impacts the profit margin (Platt and Huettel, 2008).
Table 6: Correlation Coefficient
Revenue Profit
Column 1 1
Column 2 0.9882430426 1
10
Paraphrase This Document
Need a fresh take? Get an instant paraphrase of this document with our AI Paraphraser
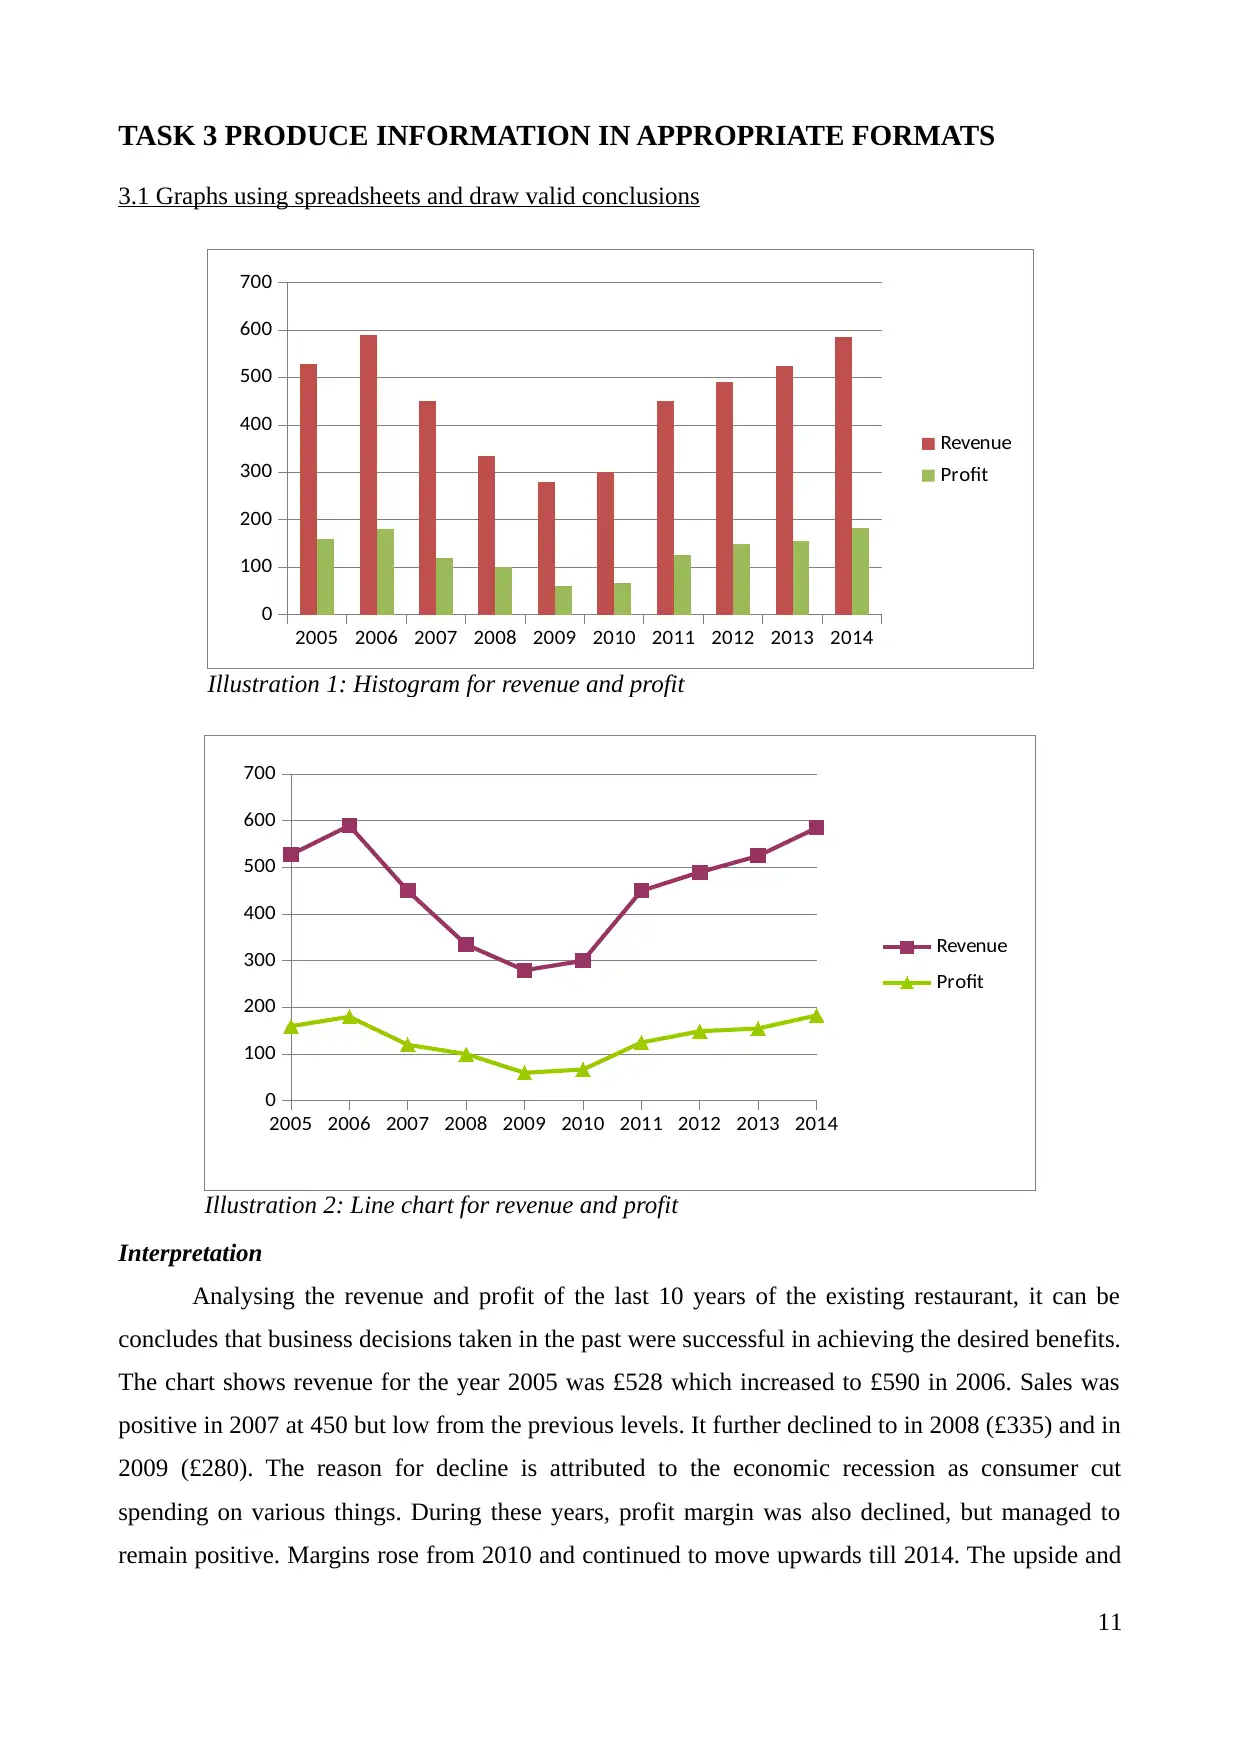
TASK 3 PRODUCE INFORMATION IN APPROPRIATE FORMATS
3.1 Graphs using spreadsheets and draw valid conclusions
2005 2006 2007 2008 2009 2010 2011 2012 2013 2014
0
100
200
300
400
500
600
700
Revenue
Profit
Illustration 1: Histogram for revenue and profit
2005 2006 2007 2008 2009 2010 2011 2012 2013 2014
0
100
200
300
400
500
600
700
Revenue
Profit
Illustration 2: Line chart for revenue and profit
Interpretation
Analysing the revenue and profit of the last 10 years of the existing restaurant, it can be
concludes that business decisions taken in the past were successful in achieving the desired benefits.
The chart shows revenue for the year 2005 was £528 which increased to £590 in 2006. Sales was
positive in 2007 at 450 but low from the previous levels. It further declined to in 2008 (£335) and in
2009 (£280). The reason for decline is attributed to the economic recession as consumer cut
spending on various things. During these years, profit margin was also declined, but managed to
remain positive. Margins rose from 2010 and continued to move upwards till 2014. The upside and
11
decline of revenue and profit margins shows that despite the spending cuts from the consumer side,
the restaurant was able to cover its expenses and earn hefty income for shareholders and employees
(Degu and Yigzaw, 2006). This also indicates decision making by the management and devising
strategies to attract consumers and earn sales. Percentage of profit margin to revenue was 30.30 in
2005 which increase to 31.28 in 2014. This can be interpreted as allocation of financial funds to
areas that generates higher sales. The business is eyeing for higher sales as compared with profit so
as to retain the existing customers.
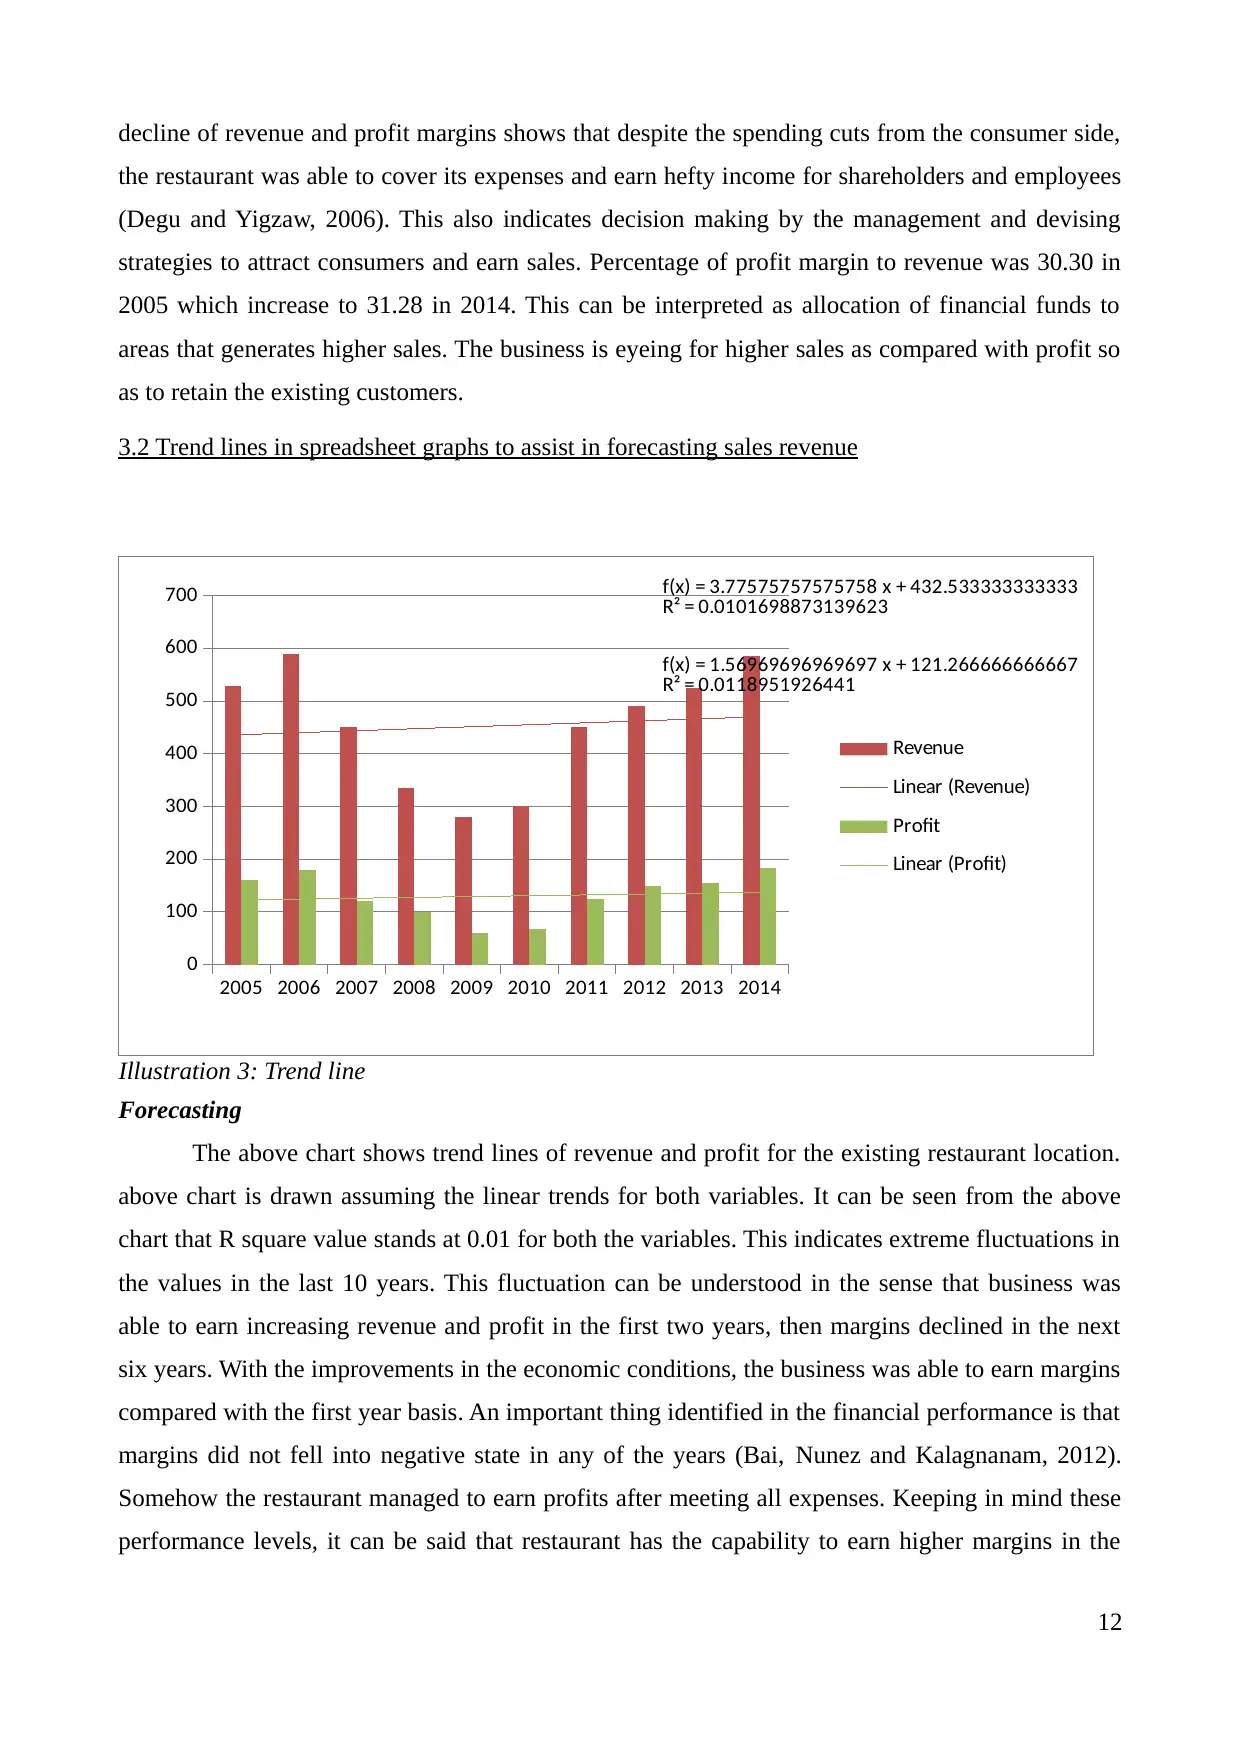
3.2 Trend lines in spreadsheet graphs to assist in forecasting sales revenue
2005 2006 2007 2008 2009 2010 2011 2012 2013 2014
0
100
200
300
400
500
600
700 f(x) = 3.77575757575758 x + 432.533333333333
R² = 0.0101698873139623
f(x) = 1.56969696969697 x + 121.266666666667
R² = 0.0118951926441
Revenue
Linear (Revenue)
Profit
Linear (Profit)
Illustration 3: Trend line
Forecasting
The above chart shows trend lines of revenue and profit for the existing restaurant location.
above chart is drawn assuming the linear trends for both variables. It can be seen from the above
chart that R square value stands at 0.01 for both the variables. This indicates extreme fluctuations in
the values in the last 10 years. This fluctuation can be understood in the sense that business was
able to earn increasing revenue and profit in the first two years, then margins declined in the next
six years. With the improvements in the economic conditions, the business was able to earn margins
compared with the first year basis. An important thing identified in the financial performance is that
margins did not fell into negative state in any of the years (Bai, Nunez and Kalagnanam, 2012).
Somehow the restaurant managed to earn profits after meeting all expenses. Keeping in mind these
performance levels, it can be said that restaurant has the capability to earn higher margins in the
12
the restaurant was able to cover its expenses and earn hefty income for shareholders and employees
(Degu and Yigzaw, 2006). This also indicates decision making by the management and devising
strategies to attract consumers and earn sales. Percentage of profit margin to revenue was 30.30 in
2005 which increase to 31.28 in 2014. This can be interpreted as allocation of financial funds to
areas that generates higher sales. The business is eyeing for higher sales as compared with profit so
as to retain the existing customers.
3.2 Trend lines in spreadsheet graphs to assist in forecasting sales revenue
2005 2006 2007 2008 2009 2010 2011 2012 2013 2014
0
100
200
300
400
500
600
700 f(x) = 3.77575757575758 x + 432.533333333333
R² = 0.0101698873139623
f(x) = 1.56969696969697 x + 121.266666666667
R² = 0.0118951926441
Revenue
Linear (Revenue)
Profit
Linear (Profit)
Illustration 3: Trend line
Forecasting
The above chart shows trend lines of revenue and profit for the existing restaurant location.
above chart is drawn assuming the linear trends for both variables. It can be seen from the above
chart that R square value stands at 0.01 for both the variables. This indicates extreme fluctuations in
the values in the last 10 years. This fluctuation can be understood in the sense that business was
able to earn increasing revenue and profit in the first two years, then margins declined in the next
six years. With the improvements in the economic conditions, the business was able to earn margins
compared with the first year basis. An important thing identified in the financial performance is that
margins did not fell into negative state in any of the years (Bai, Nunez and Kalagnanam, 2012).
Somehow the restaurant managed to earn profits after meeting all expenses. Keeping in mind these
performance levels, it can be said that restaurant has the capability to earn higher margins in the
12
⊘ This is a preview!⊘
Do you want full access?
Subscribe today to unlock all pages.
Trusted by 1+ million students worldwide
1 out of 19
Related Documents


Your All-in-One AI-Powered Toolkit for Academic Success.
+13062052269
info@desklib.com
Available 24*7 on WhatsApp / Email
![[object Object]](/_next/static/media/star-bottom.7253800d.svg)
Unlock your academic potential
Copyright © 2020–2026 A2Z Services. All Rights Reserved. Developed and managed by ZUCOL.