BUSINESS DECISION MAKING INTRODUCTION 1 TASK 1 1 1 1.1 Background 1 1.1 Methodology 2 1.2 Data Analysis Section 2 1.2 Budget 3 1.3 Questionnaire 3 TASK 1 1 2.1 & 5 2.3 Range, Mode and Median 5 2.3 Ave
24 Pages5111 Words264 Views
Added on 2019-12-03
About This Document
BUSINESS DECISION MAKING INTRODUCTION 1 TASK 1 1 1.1 Background 1 1.1 Rationale 1 1.1 Objective of Research 1 1.2 Methodology 2 1.2 Data Analysis section 2 1.2 Time Frame 2 1.2 Budget 3 1.3 Questionnaire 3 TASK 2 5 2.1 & 2.2 Mean, Mode and Median 5 2.3 Range and Standard Deviation 7 2.4 25th Percentile (Audi iii. 25th Percentile (Lower Quartile) and 75th Percentile (Upper Quartile) and use of Percentile 8 2.4 Calculate correlation coefficient
BUSINESS DECISION MAKING INTRODUCTION 1 TASK 1 1 1 1.1 Background 1 1.1 Methodology 2 1.2 Data Analysis Section 2 1.2 Budget 3 1.3 Questionnaire 3 TASK 1 1 2.1 & 5 2.3 Range, Mode and Median 5 2.3 Ave
Added on 2019-12-03
ShareRelated Documents
BUSINESS DECISION MAKING

TABLE OF CONTENTS
INTRODUCTION...........................................................................................................................1
TASK 1............................................................................................................................................1
1.1 Background............................................................................................................................1
1.1 Rationale................................................................................................................................1
1.1 Objective of Research............................................................................................................1
1.2 Methodology..........................................................................................................................2
1.2 Data Analysis section............................................................................................................2
1.2 Time Frame............................................................................................................................2
1.2 Budget....................................................................................................................................3
1.3 Questionnaire.........................................................................................................................3
TASK 2............................................................................................................................................5
2.1 & 2.2 Mean, Mode and Median.............................................................................................5
2.3 Range and Standard Deviation..............................................................................................7
2.4 25th Percentile (Lower iii........25th Percentile (Lower Quartile) and 75th Percentile (Upper
Quartile) and use of Percentile....................................................................................................8
2.4 Calculate correlation coefficient using the additional information provided and discuss it
advantages to a business..............................................................................................................9
TASK 3..........................................................................................................................................10
3.1 & 4.1 Produce line graph.....................................................................................................10
Pie chart.....................................................................................................................................11
Bar charts...................................................................................................................................11
Scatter Plot on Advertising and Sales Costs..............................................................................12
3.2 & 4.1 Trend lines.................................................................................................................12
3.3 Covered in power point presentation...................................................................................14
3.4 Formal Business Report.......................................................................................................14
TASK 4..........................................................................................................................................16
4.2 Prepare a network diagram for activities using Microsoft Project......................................16
ii) Calculate Project Duration....................................................................................................16
iii) Clearly mark the Critical Path..............................................................................................16
iv) Prepare a Gantt chart and state the benefits of using it as a Project Management Tool......17
TASK 4 B......................................................................................................................................17
4.3 Calculation of Net present value and Internal rate of return...............................................17
Recommendation.......................................................................................................................20
CONCLUSION..............................................................................................................................20
REFERENCES..............................................................................................................................22
INTRODUCTION
Looking at the present condition of corporate world, decision making is one of the major
aspects that managerial level people has to carry out in effective and suitable manner. Increasing
level of competition has force the managers to ensure that they make decision considering all the
facts and findings (Brennan and Perkins, 2012). Present research project focuses on evaluating
importance of different financial tools that are essential for understanding the trends and
environment and helping the course for the managers in making suitable and reliable decisions.
Further, different scenarios have been considered in order to enhance the knowledge of the
learners regarding making effective decisions in different situations.
TASK 1
1.1 Background
Decision making is crucial aspect for every business and it is the duty of senior managers
to make sure that they undertake suitable and smart decisions so that desired results and
outcomes can be generated. In the present study, Crossrail one of the Europe’s largest
construction project for improving the journey times across London. The main purpose of this
project is to improve the way people travel around the capital of UK. In this regard, investigator
focuses on indulging different means of collecting data so that adequate amount of information
can be collected and Government of UK can understand the significance of Crossrail project for
the local community.
1.1 Rationale
Rationale behind conducting this study is to evaluate and analyze the benefits of Crossrail
Project for the local people of London. However, in regard to government, it is planning to
enhance the traveling experience and making safer for the people to travel from one local place
to another. Thus, through the means of this study researcher will evaluate the significance of
cited project for both government of UK and local people of London.
1.1 Objective of Research
The main objective of research is to evaluate the significance and benefits of Crossrail
project for the local community of London. Following are the three main objective of the current
study that researcher focuses on achieving:
To examine the advantages of Crossrail project for the general public.
To evaluate the financial benefits of the project for the economy of London.
1

To analyze whether Crossrail project assist in maintaining overcrowding at railway
station.
1.2 Methodology
Considering the nature of present study, researcher has focused on gathering data through
the help of both qualitative and quantitative techniques. In order to collect primary data, survey
methodology has been selected in which sample size has been selected with help of purposive
sampling technique and on the basis of which 30 front line managers of the Crossrail project will
be given the questionnaire and open and close ended questions will be asked to them about the
Crossrail project. The main purpose of collecting primary data is that it will helps in gathering
the information regarding aim and objectives of the Crossrail project for the government,
Construction Company and local people of London. Furthermore, data collected by the means of
survey methodology will be used for quantitative analysis so that actual findings in terms of
numbers can be generated and suitable interpretation can be made (Cooper and Schindler, 2003).
On the other hand, secondary data helps in gathering wide range of information regarding the
selected project so that appropriate theoretical base can be made which helps in making suitable
and reliable decisions regarding the project. By the means of secondary data, researcher can
evaluate different aspects of the project such as general information about the project which is
crucial in terms of understanding the significance of Crossrail project for the local people.
1.2 Data Analysis section
According to present given scenario, researcher will use qualitative analysis method for
analyzing the collected data. However, in this investigator will use graphical presentation to
present the data in effective manner as well as suitable for the learners or readers to understand
the findings (Audi, 2012). The main purpose behind using qualitative method of analyzing the
data is that it will assist researcher in understanding each and every aspect about the Crossrail
project. Furthermore, through data analysis section researcher will able to evaluate whether
Crossrail project is beneficial for the local community of London or not.
1.2 Time Frame
Looking at the nature of present study, it is important for the investigator to make in-
depth analysis. However, for making accurate and correct research, time factor is one of the most
significant factor considered (Fassin, Rossem, and Buelens, 2011). Hence, to maintain the
validity and reliability of the project, researcher should take adequate amount of time for
2
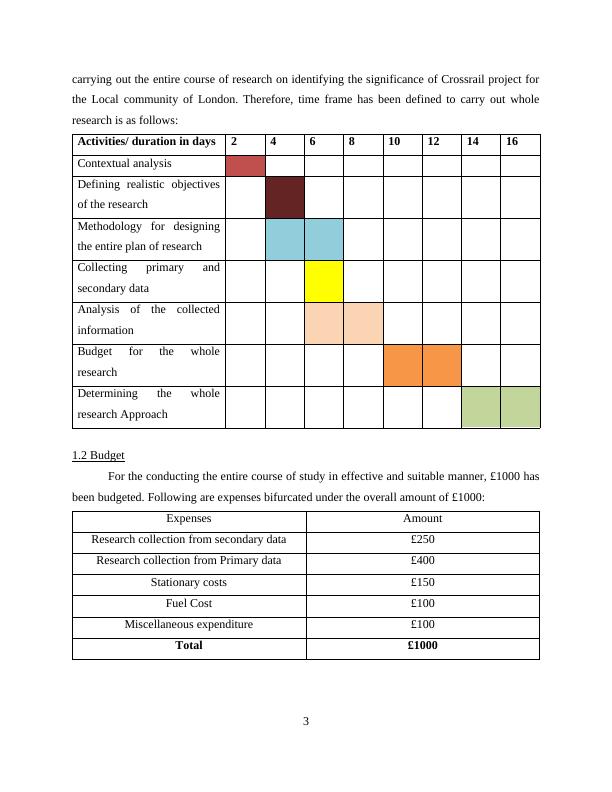
carrying out the entire course of research on identifying the significance of Crossrail project for
the Local community of London. Therefore, time frame has been defined to carry out whole
research is as follows:
Activities/ duration in days 2 4 6 8 10 12 14 16
Contextual analysis
Defining realistic objectives
of the research
Methodology for designing
the entire plan of research
Collecting primary and
secondary data
Analysis of the collected
information
Budget for the whole
research
Determining the whole
research Approach
1.2 Budget
For the conducting the entire course of study in effective and suitable manner, £1000 has
been budgeted. Following are expenses bifurcated under the overall amount of £1000:
Expenses Amount
Research collection from secondary data £250
Research collection from Primary data £400
Stationary costs £150
Fuel Cost £100
Miscellaneous expenditure £100
Total £1000
3
End of preview
Want to access all the pages? Upload your documents or become a member.
Related Documents
BUSINESS DECISION MAKING TABLE OF CONTENTSlg...
|22
|4109
|164
Role of Business Decision Making Assignmentlg...
|23
|4732
|156
Business Decision Making Tools Assignmentlg...
|19
|4426
|155
Business Decision Making Techniques Assignmentlg...
|24
|5242
|25
Benefits of Project Management Tools : Reportlg...
|27
|5487
|163
Business decision making table of contents introduction 4 TASK 14lg...
|19
|3736
|361