Benefits of Project Management Tools : Report
Added on 2020-01-15
27 Pages5487 Words163 Views
BUSINESS DECISIONMAKING

TABLE OF CONTENTSINTRODUCTION...........................................................................................................................1TASK 1............................................................................................................................................11.1 Background............................................................................................................................11.1 Rationale................................................................................................................................21.1 Objectives of the research......................................................................................................21.2 Methodology..........................................................................................................................21.2 Data Analysis.........................................................................................................................31.2 Time Frame............................................................................................................................31.2 Budget section.......................................................................................................................41.3 Questionnaire.........................................................................................................................4TASK 2............................................................................................................................................62.1 & 2.2 Mean, Mode and Median.............................................................................................62.3 Range and Standard Deviation..............................................................................................82.4 25th Percentile (Lower 25th Percentile (Lower Quartile) and 75th Percentile (UpperQuartile) and use of Percentile....................................................................................................9TASK 3..........................................................................................................................................113.1 & 4.1 Produce line graph.....................................................................................................11Scatter Plot on Advertising costs and sales...............................................................................153.2 & 4.1 Trend Lines................................................................................................................163.3 Business presentation...........................................................................................................183.4 Formal Business Report.......................................................................................................18TASK 4..........................................................................................................................................194.2 Prepare a network diagram for activities using Microsoft Project......................................19Calculate Project Duration.........................................................................................................20Clearly mark the Critical Path...................................................................................................20Prepare a Gantt chart and state the benefits of using it as a Project Management Tool............21TASK 4 B......................................................................................................................................214.3 Calculation of Net present value and internal rate of return................................................21Recommendations......................................................................................................................25CONCLUSION..............................................................................................................................25REFERENCE................................................................................................................................26
INDEX OF TABLESTable 1: Descriptive Analysis..........................................................................................................6Table 2: Measure of Dispersion.......................................................................................................8Table 3: Correlation and Coefficient.............................................................................................11Table 4: Project A @ 10%.............................................................................................................22Table 5: Project A @ 20%.............................................................................................................22Table 6: Project B @ 10%.............................................................................................................23Table 7: Project B @ 20%.............................................................................................................24ILLUSTRATION INDEXIllustration 1: Line graph...............................................................................................................14Illustration 2: Net Income Generated by 5 Branches of the company in 2015..............................15Illustration 3: Bar Graph of Net Income Generated by 5 Branches of the company in 2015........15Illustration 4: Advertising and Sales data 2000-2013....................................................................16Illustration 5: Scatter Plot on Advertising costs and sales.............................................................16Illustration 6: Advertising costs ....................................................................................................17Illustration 7: Sales........................................................................................................................18Illustration 8: Network Diagram....................................................................................................20Illustration 9: Gantt chart...............................................................................................................21
INTRODUCTIONIn the present business environment, every business entity determines various strategiesin order to take different management decisions with an appropriate manner. The is because anefficient decision-making process ensures the success of organization. By taking differentstrategic decisions with an appropriate manner, management can improve operationalcapabilities and efficiency of business entity with reference to short and long term business goals(Hofmann, 2007). In this process, management examines several factors that are having directimpact on outcomes of business decisions. It also supports management for selection of bestalternative from various options as per the distinct business requirement. The present report iscarried out detail evaluation of different case studies and business scenarios and developsappropriate strategies to generate appropriate outcomes. In this process, wide range of statisticaltools and techniques are applied for evaluation of distinct kind of data in order to takeappropriate decisions. In the context present study, this report also uses different investmentappraisal tactics through which an organization is able to select best investment alternative forbusiness expansion that would increase profitability of company and reduces risk related toinvestment. TASK 11.1 BackgroundAs per the given, it is found that Government of UK is planning to initiate a CrossrailProject through which the public authority of UK will be able to enhance the local transportconnectivity within London. This project will increase transportation facilities so as citizenwould get quick and high speed mode of transportation. The primary objective of this project isto offer city transport facilities to more than 1.5 million. Furthermore, this project providessignificant support to public authorities in the form of employment, leisure and other businessoperation. As per the case study, it is addressed that the first cross-rail will be started fromcentral London in late 2018 and will carry more 200 million passenger annually. Furthermore, itwill reduce the journey time across London with the help of a high speed and affordable mode oftransportation. The project cross-rail will be beneficial of public authorities and local citizenbecause it will transform the rail transportation and increase the capacity of public transport by10%. Therefore, it can be stated that success of the project is greatly depending on its timely1
completion so as government authorities have to develop various strategies and need to takeappropriate management decision in order to keep the project on the right track. 1.1 RationaleThe primary objective this project is to enhance transportation services to local citizenalong with external so as people would get comfortable and quick transportation facilities. Inaddition to that this project will be found very effective in minimizing the road traffic throughpollution level can be controlled. It ensures safety of environment by lowering pollution level(Lucey, 2005). Furthermore, the investigator is focusing on assessment of the benefits ofCrossrail project for the local community along with external visitor. Therefore, the presentinvestigation is carried out to evaluate several factors of cross-rail project that assists researcherin facilitation of appropriate and detail information about the benefits of the project ofgovernment officials and managers of public authorities. 1.1 Objectives of the researchThe primary objective of the present research is examining positive aspect of the CrossRail project for the local community of London. In addition to that the present research isscheduled to evaluate the budget and time frame associated with cross-rail project. The threemain objective of the present investigation are mentioned below: To assess the positive outcomes of the project that would be assessed by general public.To identify whether this project will provide significant benefits to economy of London.To evaluate the role of cross-rail project in completion of future transportationrequirement. 1.2 MethodologyWith reference to present given scenario, investigator requires to assess wide range ofinformation to generate appropriate and accurate outcomes therefore researcher is applying bothprimary and secondary information associated with the Crossrail project that would assist publicauthority in order to take appropriate business decisions for attainment project goals. In thiscontext, researcher has selected the random sampling approach for selection of best samplethrough investigator would assess appropriate information for public authorities (Hacklin andWallnöfer, 2012). For collection of first hand information, a sample of 50 local citizens will betaken by researcher who will be affected from cross-rail project. Firstly, qualitative techniquesresearcher will be found very effective to enhance the understanding about the perception of2
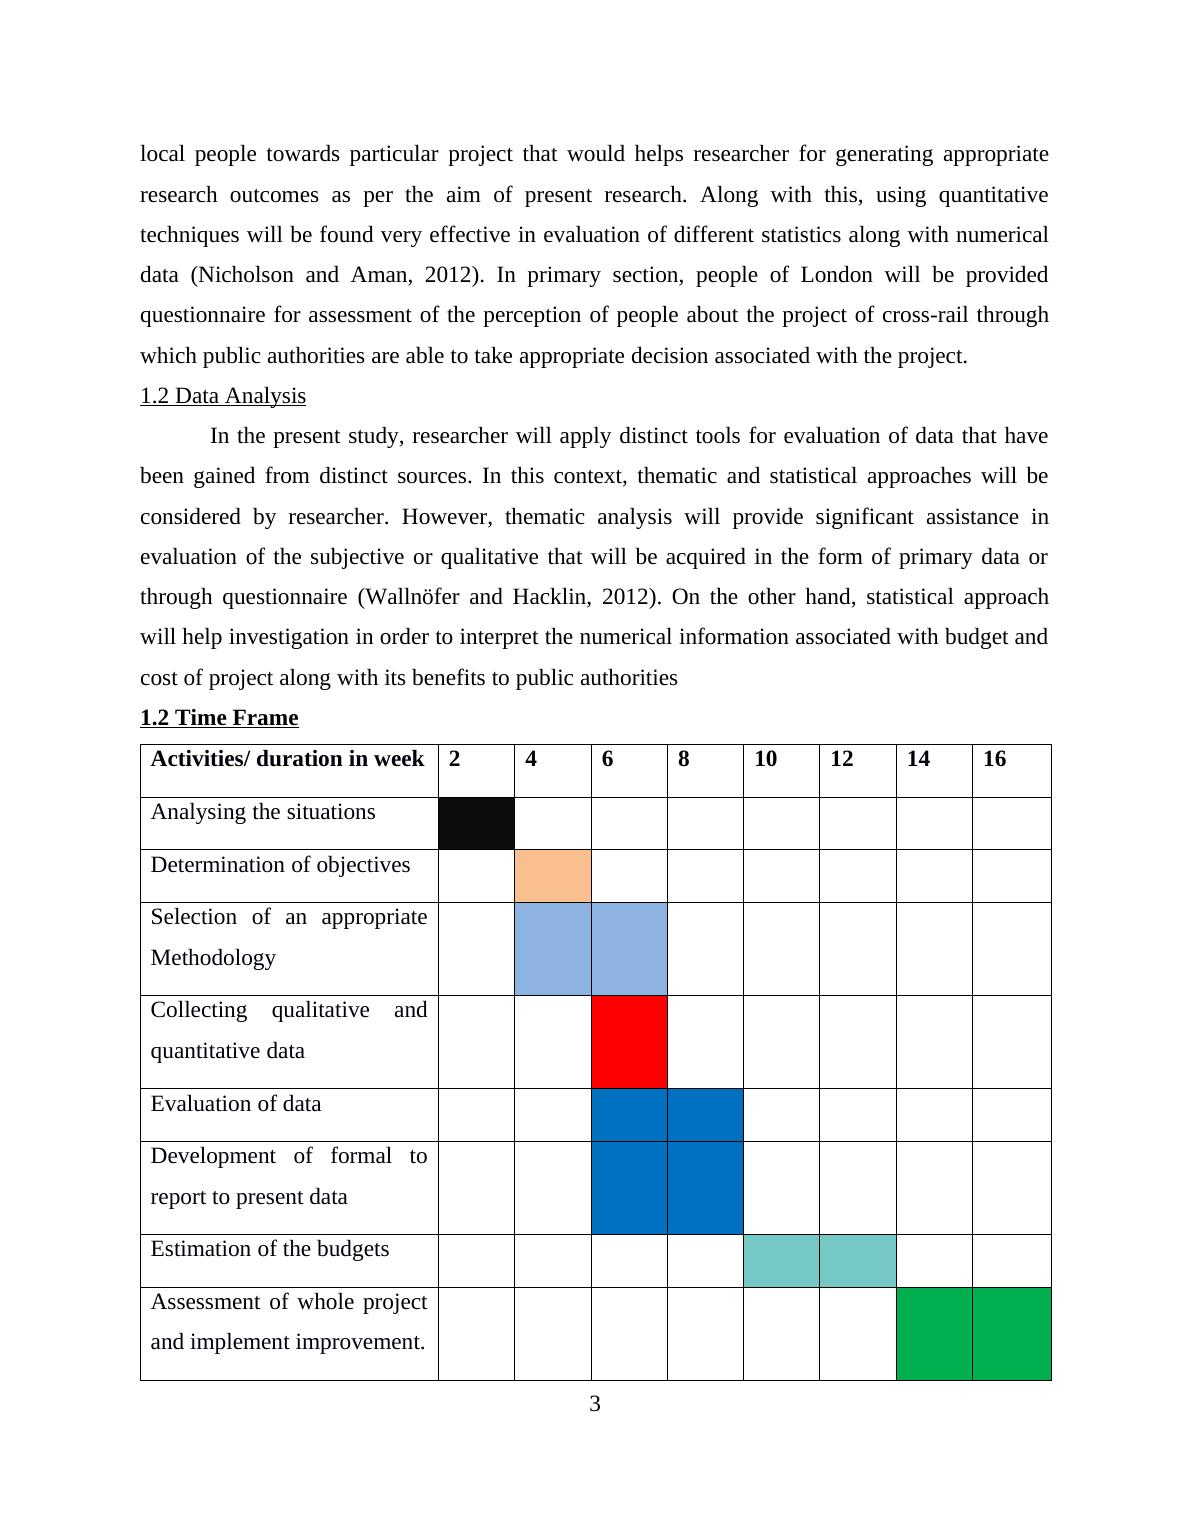
local people towards particular project that would helps researcher for generating appropriateresearch outcomes as per the aim of present research. Along with this, using quantitativetechniques will be found very effective in evaluation of different statistics along with numericaldata (Nicholson and Aman, 2012). In primary section, people of London will be providedquestionnaire for assessment of the perception of people about the project of cross-rail throughwhich public authorities are able to take appropriate decision associated with the project. 1.2 Data AnalysisIn the present study, researcher will apply distinct tools for evaluation of data that havebeen gained from distinct sources. In this context, thematic and statistical approaches will beconsidered by researcher. However, thematic analysis will provide significant assistance inevaluation of the subjective or qualitative that will be acquired in the form of primary data orthrough questionnaire (Wallnöfer and Hacklin, 2012). On the other hand, statistical approachwill help investigation in order to interpret the numerical information associated with budget andcost of project along with its benefits to public authorities1.2 Time FrameActivities/ duration in week246810121416Analysing the situationsDetermination of objectivesSelection of an appropriateMethodology Collecting qualitative andquantitative dataEvaluation of data Development of formal toreport to present dataEstimation of the budgetsAssessment of whole projectand implement improvement.3
End of preview
Want to access all the pages? Upload your documents or become a member.
Related Documents
Business Decision Making Techniques Assignmentlg...
|24
|5242
|25
BUSINESS DECISION MAKING INTRODUCTION 1 TASK 1 1 1 1.1 Background 1 1.1 Methodology 2 1.2 Data Analysis Section 2 1.2 Budget 3 1.3 Questionnaire 3 TASK 1 1 2.1 & 5 2.3 Range, Mode and Median 5 2.3 Avelg...
|24
|5111
|264
Business Decision Making Assignment - Restaurant Chainlg...
|23
|4751
|147
BUSINESS DECISION MAKING TABLE OF CONTENTSlg...
|22
|4109
|164
Report on Business Decision Making- Syngentalg...
|23
|4708
|76
Marketing Research Report for World Wide Tobacco (WWT)lg...
|21
|4451
|481