Business Decision Making Report: London Crossrail Project Analysis
VerifiedAdded on 2019/12/03
|24
|5242
|25
Report
AI Summary
This comprehensive report delves into the realm of business decision-making, exploring various techniques and their applications within organizations. It begins with an introduction to the core concepts, followed by a detailed analysis of a Crossrail project scenario, including background information, rationales, objectives, and methodologies. The report encompasses a wide range of analytical tools, such as mean, median, mode, range, standard deviation, percentiles, and correlation coefficients, applied to sales data. It further incorporates graphical representations like line, pie, bar, and scatter charts, along with trend lines to forecast sales figures. The report also addresses project management aspects through network diagrams, critical path analysis, Gantt charts, and financial evaluations using NPV and IRR. Finally, the report culminates in recommendations for project selection, supported by thorough justifications, and a conclusive summary of the findings.

Business Decision Making
Paraphrase This Document
Need a fresh take? Get an instant paraphrase of this document with our AI Paraphraser
TABLE OF CONTENTS
introduction......................................................................................................................................1
task 1................................................................................................................................................1
Background..................................................................................................................................1
Rational........................................................................................................................................1
Objective of the research.............................................................................................................1
Methodology................................................................................................................................2
Data analysis................................................................................................................................3
Timeframe....................................................................................................................................3
Budget section.............................................................................................................................4
Designing of a sample questionnaire...........................................................................................4
Task 2...............................................................................................................................................6
1. Mean, Median and Mode.........................................................................................................6
2. Range and Standard deviation.................................................................................................7
3. 25th Percentile (Lower iii...........25th Percentile (Lower Quartile) and 75th Percentile (Upper
Quartile) and use of Percentile....................................................................................................8
4. Inter-quartile range..................................................................................................................8
5. Calculation of correlation coefficient......................................................................................9
Task 3...............................................................................................................................................9
Line graph for advertising and sales figure.................................................................................9
Pie and bar chart for net income generated by five branches and scatter graph for sales.........10
Scatter plot for sales and advertisement cost of the organization..............................................11
Trend line for forecasting sales figure for years 2015 – 2017...................................................11
Business presentation.................................................................................................................12
Business Report.........................................................................................................................12
Task 4.............................................................................................................................................13
4.1 Network diagram.................................................................................................................13
4.2 Calculation of the project duration......................................................................................13
4.3 Critical path.........................................................................................................................14
4.4 Gantt chart and its benefits for project management...........................................................15
task 4B...........................................................................................................................................16
1. Calculation of NPV and IRR of project A and B..................................................................16
2. Recommendations for project selection with justification....................................................18
conclusion......................................................................................................................................19
references.......................................................................................................................................20
TABLE OF FIGURES
Figure 1: Line Graph for advertising and sales figures...................................................................9
Figure 2: Pie chart for net income generated by five branches.....................................................10
Figure 3: Bar chart for net income generated by five branches.....................................................10
Figure 4: Scatter plot for sales and advertising cost......................................................................11
Figure 5: Trend Line for sales and advertising cost......................................................................11
Figure 6: Network diagram............................................................................................................13
Figure 7: Project summery for duration of the project..................................................................14
Figure 8: Gantt chart......................................................................................................................15
LIST OF TABLES
Table 1: Gantt chart for timeframe of the research plan..................................................................3
Table 2: Calculation of mean mode and median.............................................................................6
Table 3: Calculation of the range and Standard deviation...............................................................7
Table 4: Calculation of the percentile and interquartile range........................................................8
Table 5: Calculation of correlation coefficient................................................................................9
⊘ This is a preview!⊘
Do you want full access?
Subscribe today to unlock all pages.
Trusted by 1+ million students worldwide
INTRODUCTION
Decision making is one of the important function of every business organization.
Business decision making can be defined as a process of selecting best among different
alternatives. It is beneficial for evaluating managerial performance, expansion of business and
developing different policies and processes (Lind, Marchal and Wathen, 2005). The current
research report is based on business decision making and regarding this whole investigation will
focus on different business scenarios. Current report includes range of techniques which can be
used by different organizations for making various business decisions. Further, it also comprises
the importance of different information for different personnel or decision makers of the
company. Along with this, application and importance of various operation and financial
techniques are also included in the upcoming section of the current report.
TASK 1
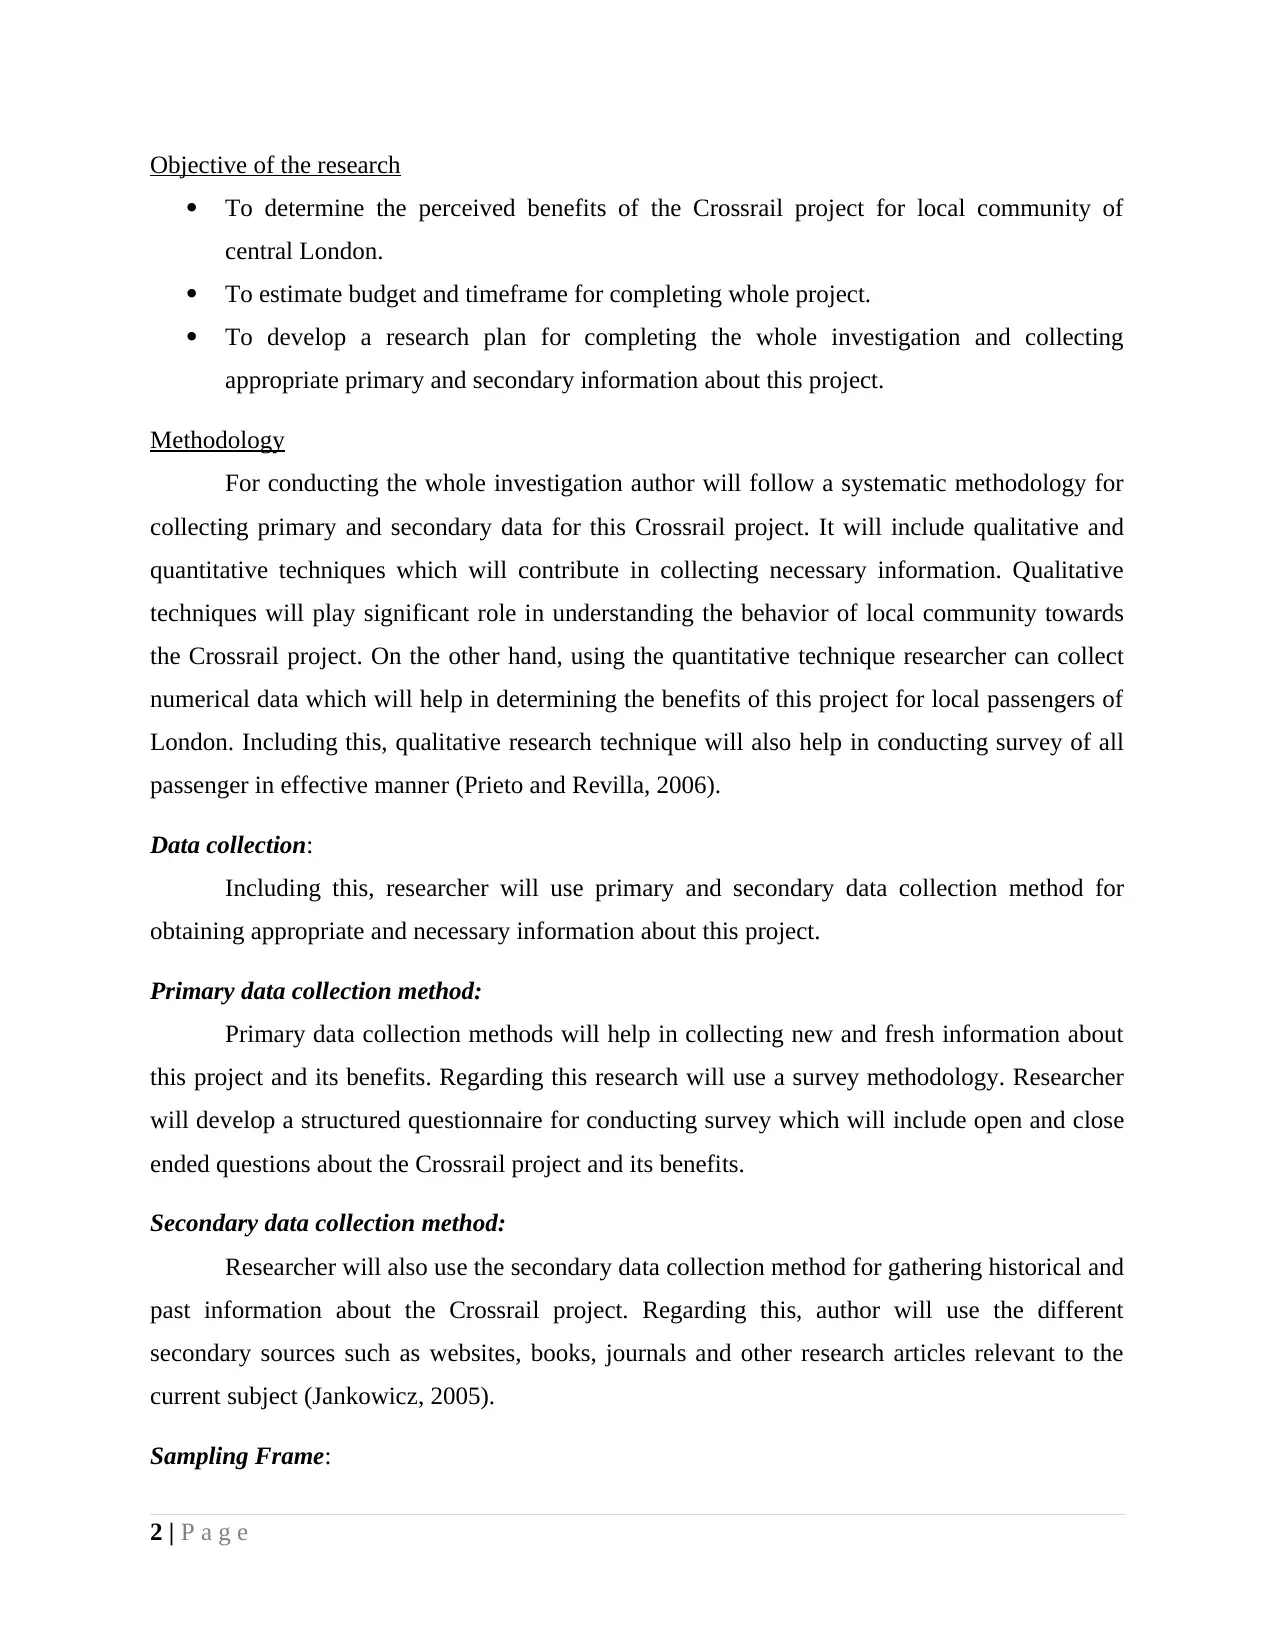
Background
As per the given business scenario, government of London wants to start a Crossrail
project in London for economic development of UK. It will provide appropriate travelling
facilities to 1.5 million people to connect with their key employment, leisure and other business
activities of different places, such as Heathrow, West and the City, etc. this project will start in
late 2018 and estimated annual passengers will be 200 million. Available fund for deliver
Crossrail is £14.8bn.
Rational
Project rational helps in determining the major reasons behind the completion of whole
investigation. The current research is conducted by the government of UK for determining the
perceived benefits of the Crossrail project for local community. Government has invested the
huge amount of money for starting this project but still they are not sure about that weather it
will be beneficial for local community or not. So, author needs to complete whole investigation
because it will help in identifying the major benefits of Crossrail project for individual of the
local societies of London and its major city areas. Therefore, determination of the major benefits
of this project is the major reason behind this project (Morato, 2013).
1 | P a g e
Decision making is one of the important function of every business organization.
Business decision making can be defined as a process of selecting best among different
alternatives. It is beneficial for evaluating managerial performance, expansion of business and
developing different policies and processes (Lind, Marchal and Wathen, 2005). The current
research report is based on business decision making and regarding this whole investigation will
focus on different business scenarios. Current report includes range of techniques which can be
used by different organizations for making various business decisions. Further, it also comprises
the importance of different information for different personnel or decision makers of the
company. Along with this, application and importance of various operation and financial
techniques are also included in the upcoming section of the current report.
TASK 1
Background
As per the given business scenario, government of London wants to start a Crossrail
project in London for economic development of UK. It will provide appropriate travelling
facilities to 1.5 million people to connect with their key employment, leisure and other business
activities of different places, such as Heathrow, West and the City, etc. this project will start in
late 2018 and estimated annual passengers will be 200 million. Available fund for deliver
Crossrail is £14.8bn.
Rational
Project rational helps in determining the major reasons behind the completion of whole
investigation. The current research is conducted by the government of UK for determining the
perceived benefits of the Crossrail project for local community. Government has invested the
huge amount of money for starting this project but still they are not sure about that weather it
will be beneficial for local community or not. So, author needs to complete whole investigation
because it will help in identifying the major benefits of Crossrail project for individual of the
local societies of London and its major city areas. Therefore, determination of the major benefits
of this project is the major reason behind this project (Morato, 2013).
1 | P a g e
Paraphrase This Document
Need a fresh take? Get an instant paraphrase of this document with our AI Paraphraser
Objective of the research
To determine the perceived benefits of the Crossrail project for local community of
central London.
To estimate budget and timeframe for completing whole project.
To develop a research plan for completing the whole investigation and collecting
appropriate primary and secondary information about this project.
Methodology
For conducting the whole investigation author will follow a systematic methodology for
collecting primary and secondary data for this Crossrail project. It will include qualitative and
quantitative techniques which will contribute in collecting necessary information. Qualitative
techniques will play significant role in understanding the behavior of local community towards
the Crossrail project. On the other hand, using the quantitative technique researcher can collect
numerical data which will help in determining the benefits of this project for local passengers of
London. Including this, qualitative research technique will also help in conducting survey of all
passenger in effective manner (Prieto and Revilla, 2006).
Data collection:
Including this, researcher will use primary and secondary data collection method for
obtaining appropriate and necessary information about this project.
Primary data collection method:
Primary data collection methods will help in collecting new and fresh information about
this project and its benefits. Regarding this research will use a survey methodology. Researcher
will develop a structured questionnaire for conducting survey which will include open and close
ended questions about the Crossrail project and its benefits.
Secondary data collection method:
Researcher will also use the secondary data collection method for gathering historical and
past information about the Crossrail project. Regarding this, author will use the different
secondary sources such as websites, books, journals and other research articles relevant to the
current subject (Jankowicz, 2005).
Sampling Frame:
2 | P a g e
As per the above discussion researcher will collect primary data from local community of
London so, author needs to select sample from entire population using appropriate method of
sampling. So, for the current investigation researcher will use random number sampling which is
an important tool of probability sampling method. It will help in selecting sample using random
number table as well as provide equal chance to every member of local community of London to
select in the sample of research (Newbold and et.al, 2009). It will also reduce the sampling error
in entire investigation. Using this method author will select 20 individuals from local
community. It will represent the sample size for entire investigation.
Data analysis
As per the above discussion author will apply the qualitative and quantitative techniques
for conducting investigation and collecting data. So, all collected data will be analyzed by
t5hematci and statistical analysis. Thematic analysis will play important role in examining
qualitative or subjective information. On the other hand statistical analysis will play significant
role in interpreting numerical information about the benefits of the Crossrail project for local
community of London (Little, 2011).
Timeframe
Researcher needs to estimate an appropriate time for completing whole investigation in
effective manner (Helfert, 2004). Timeframe for the whole investigation will be represented by
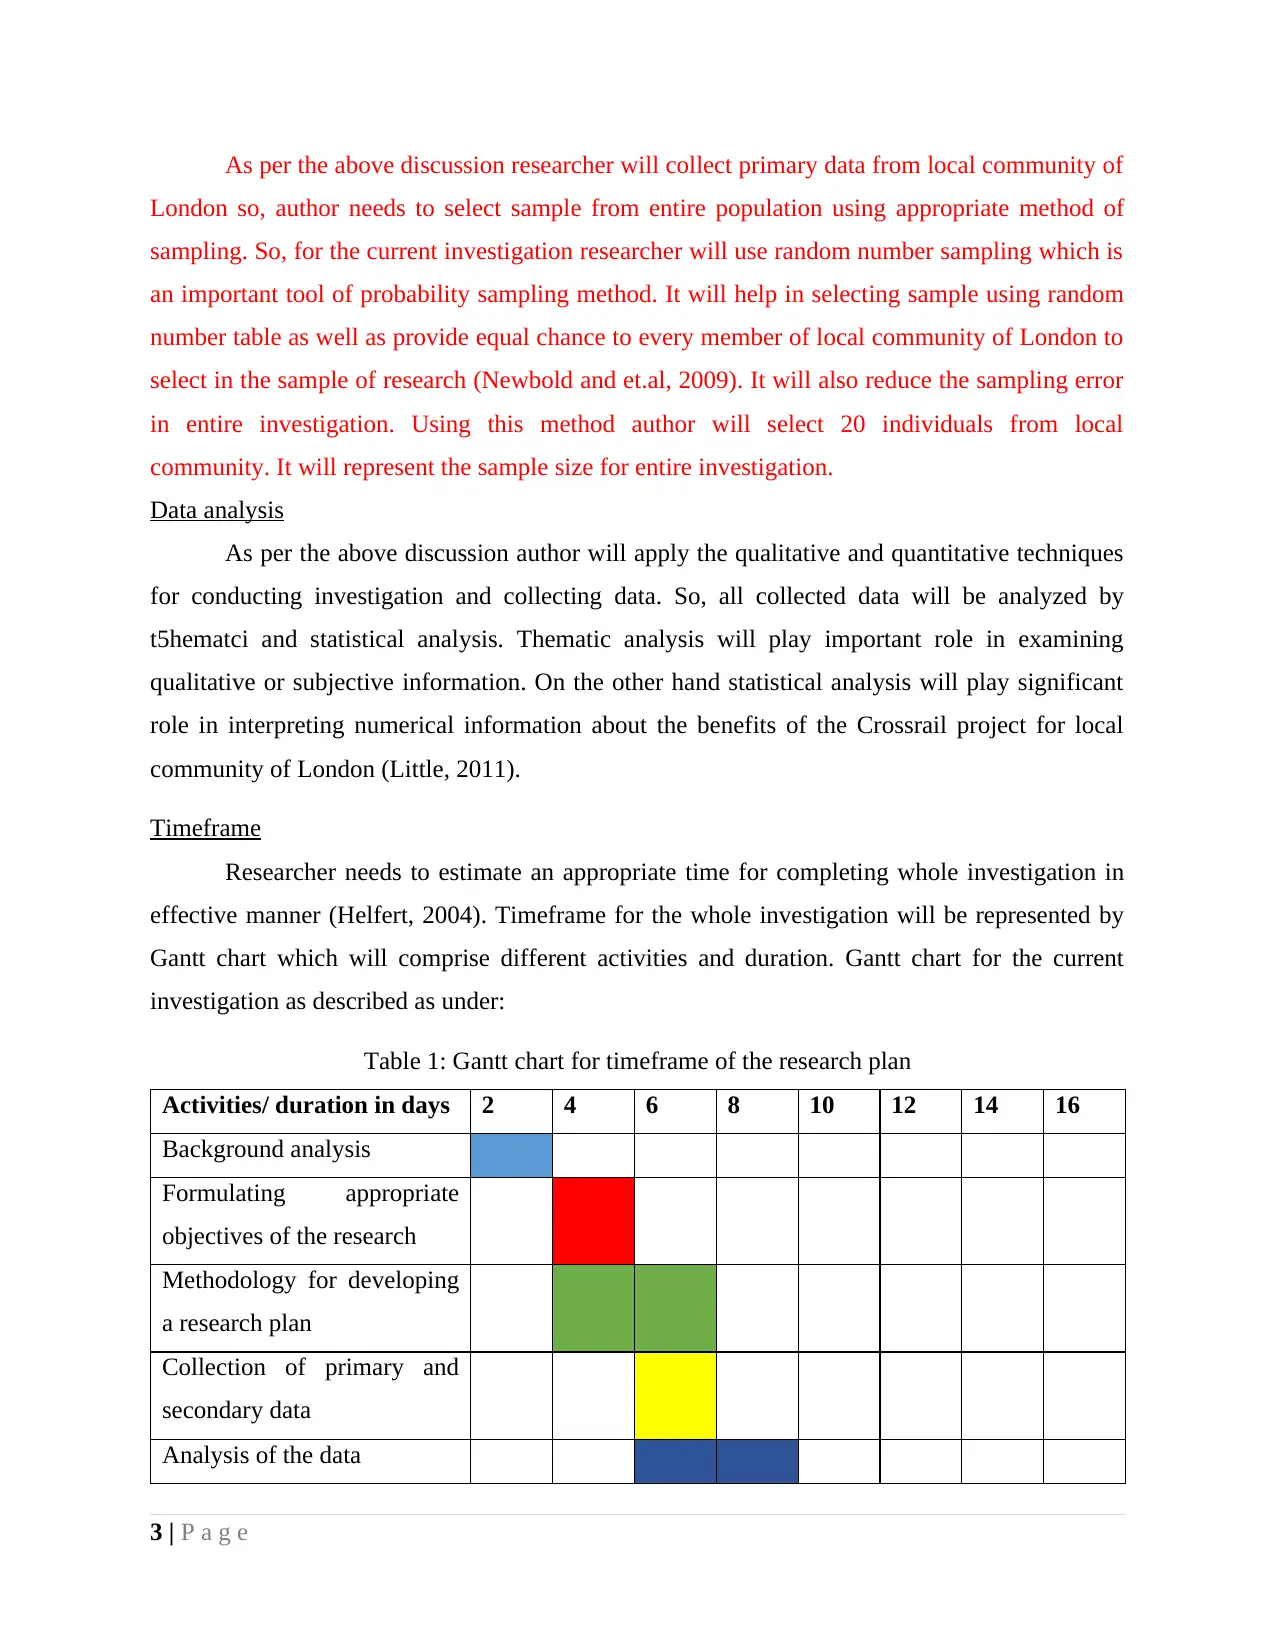
Gantt chart which will comprise different activities and duration. Gantt chart for the current
investigation as described as under:
Table 1: Gantt chart for timeframe of the research plan
Activities/ duration in days 2 4 6 8 10 12 14 16
Background analysis
Formulating appropriate
objectives of the research
Methodology for developing
a research plan
Collection of primary and
secondary data
Analysis of the data
3 | P a g e
London so, author needs to select sample from entire population using appropriate method of
sampling. So, for the current investigation researcher will use random number sampling which is
an important tool of probability sampling method. It will help in selecting sample using random
number table as well as provide equal chance to every member of local community of London to
select in the sample of research (Newbold and et.al, 2009). It will also reduce the sampling error
in entire investigation. Using this method author will select 20 individuals from local
community. It will represent the sample size for entire investigation.
Data analysis
As per the above discussion author will apply the qualitative and quantitative techniques
for conducting investigation and collecting data. So, all collected data will be analyzed by
t5hematci and statistical analysis. Thematic analysis will play important role in examining
qualitative or subjective information. On the other hand statistical analysis will play significant
role in interpreting numerical information about the benefits of the Crossrail project for local
community of London (Little, 2011).
Timeframe
Researcher needs to estimate an appropriate time for completing whole investigation in
effective manner (Helfert, 2004). Timeframe for the whole investigation will be represented by
Gantt chart which will comprise different activities and duration. Gantt chart for the current
investigation as described as under:
Table 1: Gantt chart for timeframe of the research plan
Activities/ duration in days 2 4 6 8 10 12 14 16
Background analysis
Formulating appropriate
objectives of the research
Methodology for developing
a research plan
Collection of primary and
secondary data
Analysis of the data
3 | P a g e
⊘ This is a preview!⊘
Do you want full access?
Subscribe today to unlock all pages.
Trusted by 1+ million students worldwide
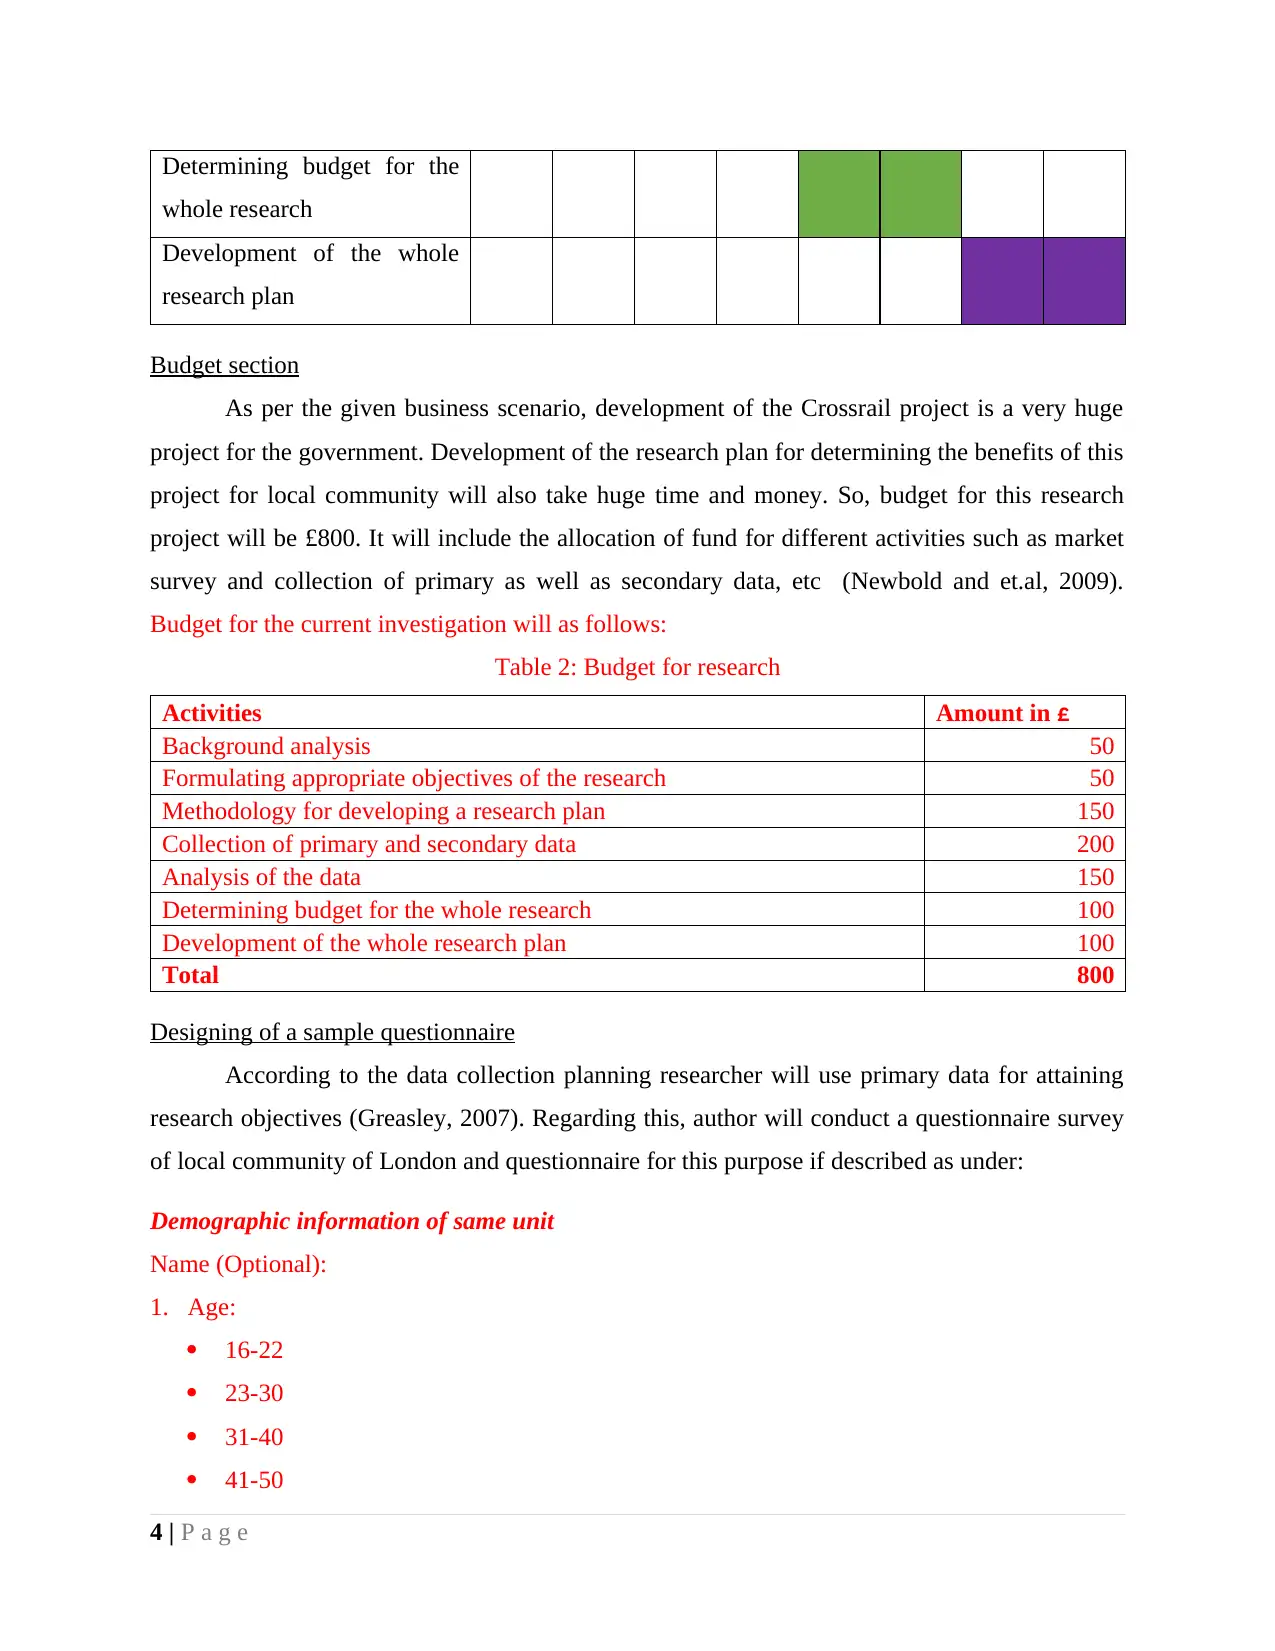
Determining budget for the
whole research
Development of the whole
research plan
Budget section
As per the given business scenario, development of the Crossrail project is a very huge
project for the government. Development of the research plan for determining the benefits of this
project for local community will also take huge time and money. So, budget for this research
project will be £800. It will include the allocation of fund for different activities such as market
survey and collection of primary as well as secondary data, etc (Newbold and et.al, 2009).
Budget for the current investigation will as follows:
Table 2: Budget for research
Activities Amount in £
Background analysis 50
Formulating appropriate objectives of the research 50
Methodology for developing a research plan 150
Collection of primary and secondary data 200
Analysis of the data 150
Determining budget for the whole research 100
Development of the whole research plan 100
Total 800
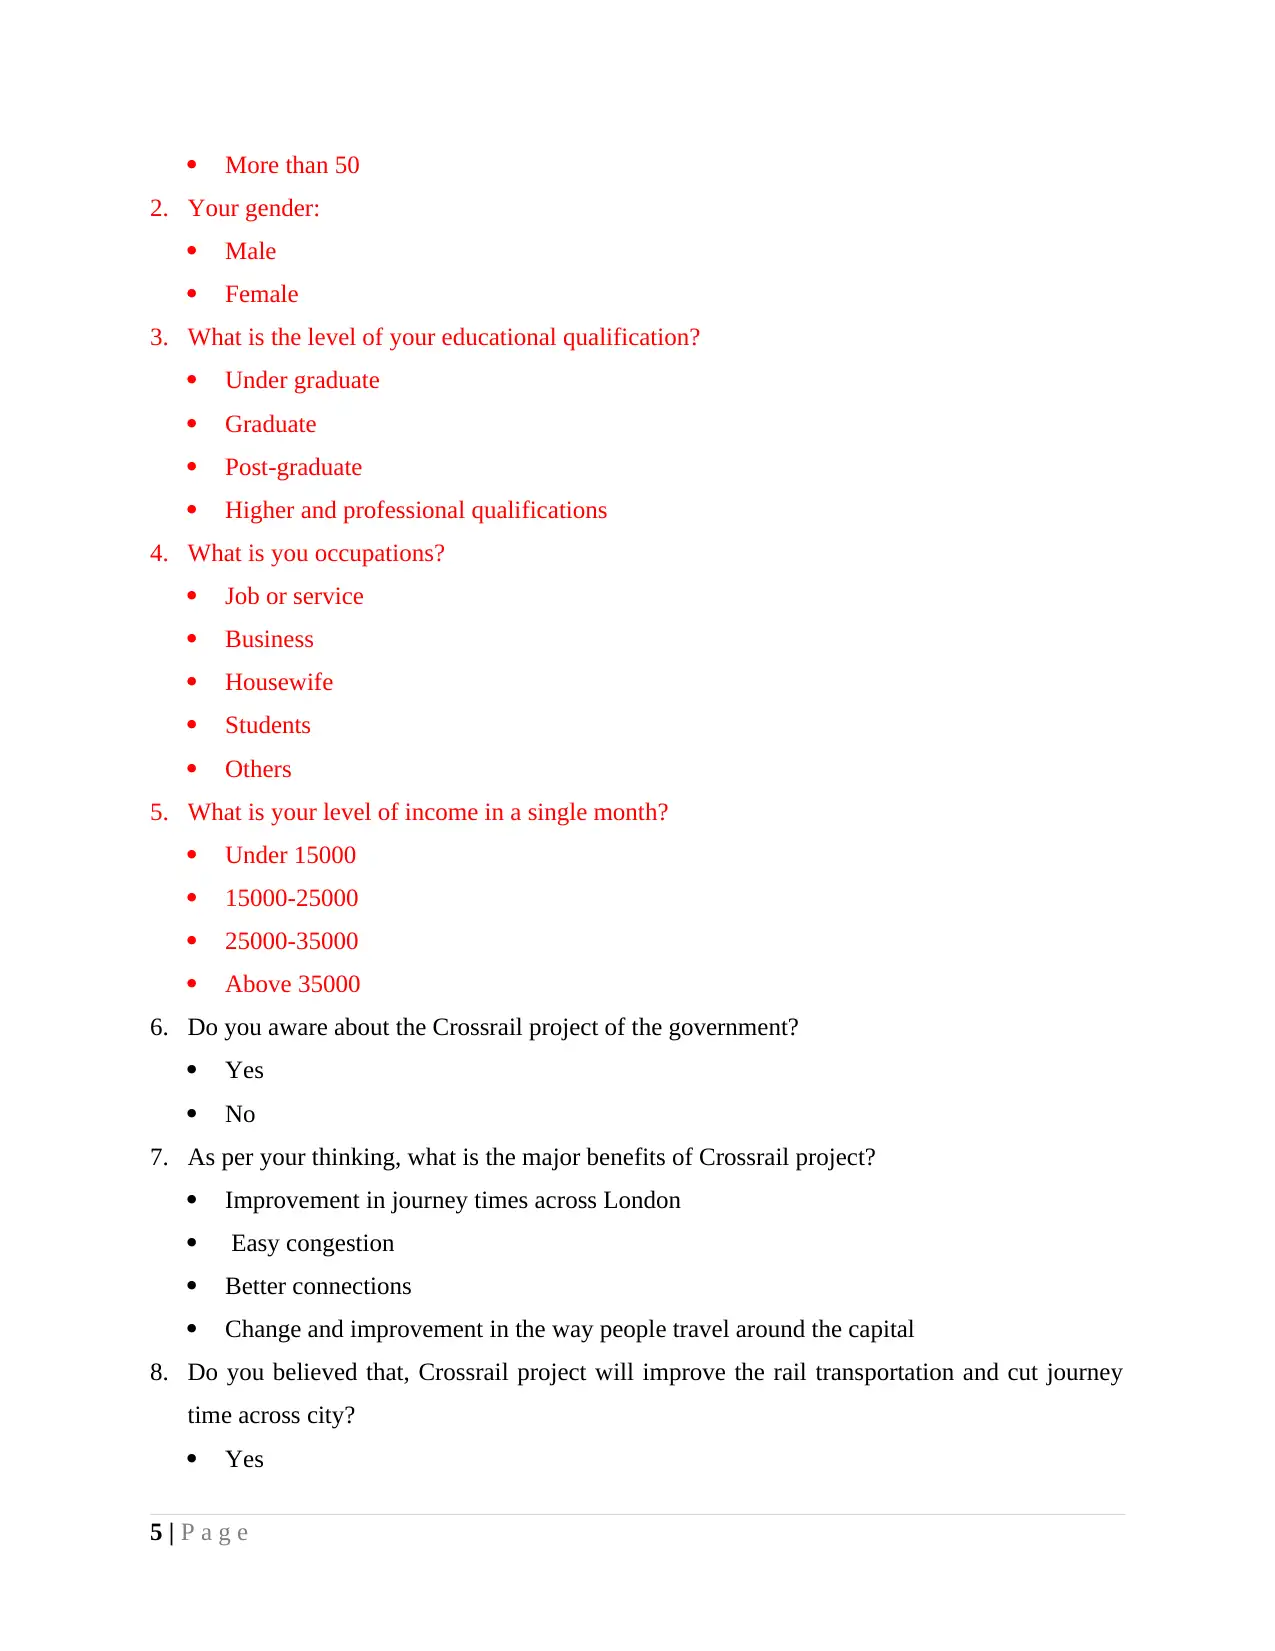
Designing of a sample questionnaire
According to the data collection planning researcher will use primary data for attaining
research objectives (Greasley, 2007). Regarding this, author will conduct a questionnaire survey
of local community of London and questionnaire for this purpose if described as under:
Demographic information of same unit
Name (Optional):
1. Age:
16-22
23-30
31-40
41-50
4 | P a g e
whole research
Development of the whole
research plan
Budget section
As per the given business scenario, development of the Crossrail project is a very huge
project for the government. Development of the research plan for determining the benefits of this
project for local community will also take huge time and money. So, budget for this research
project will be £800. It will include the allocation of fund for different activities such as market
survey and collection of primary as well as secondary data, etc (Newbold and et.al, 2009).
Budget for the current investigation will as follows:
Table 2: Budget for research
Activities Amount in £
Background analysis 50
Formulating appropriate objectives of the research 50
Methodology for developing a research plan 150
Collection of primary and secondary data 200
Analysis of the data 150
Determining budget for the whole research 100
Development of the whole research plan 100
Total 800
Designing of a sample questionnaire
According to the data collection planning researcher will use primary data for attaining
research objectives (Greasley, 2007). Regarding this, author will conduct a questionnaire survey
of local community of London and questionnaire for this purpose if described as under:
Demographic information of same unit
Name (Optional):
1. Age:
16-22
23-30
31-40
41-50
4 | P a g e
Paraphrase This Document
Need a fresh take? Get an instant paraphrase of this document with our AI Paraphraser
More than 50
2. Your gender:
Male
Female
3. What is the level of your educational qualification?
Under graduate
Graduate
Post-graduate
Higher and professional qualifications
4. What is you occupations?
Job or service
Business
Housewife
Students
Others
5. What is your level of income in a single month?
Under 15000
15000-25000
25000-35000
Above 35000
6. Do you aware about the Crossrail project of the government?
Yes
No
7. As per your thinking, what is the major benefits of Crossrail project?
Improvement in journey times across London
Easy congestion
Better connections
Change and improvement in the way people travel around the capital
8. Do you believed that, Crossrail project will improve the rail transportation and cut journey
time across city?
Yes
5 | P a g e
No
9. To which extent you believe that, Crossrail project will enable further economic development
in the London?
Agreed
Neutral
Disagreed
10. Would you like to use Crossrails for your employment, leisure and business activities?
Yes
No
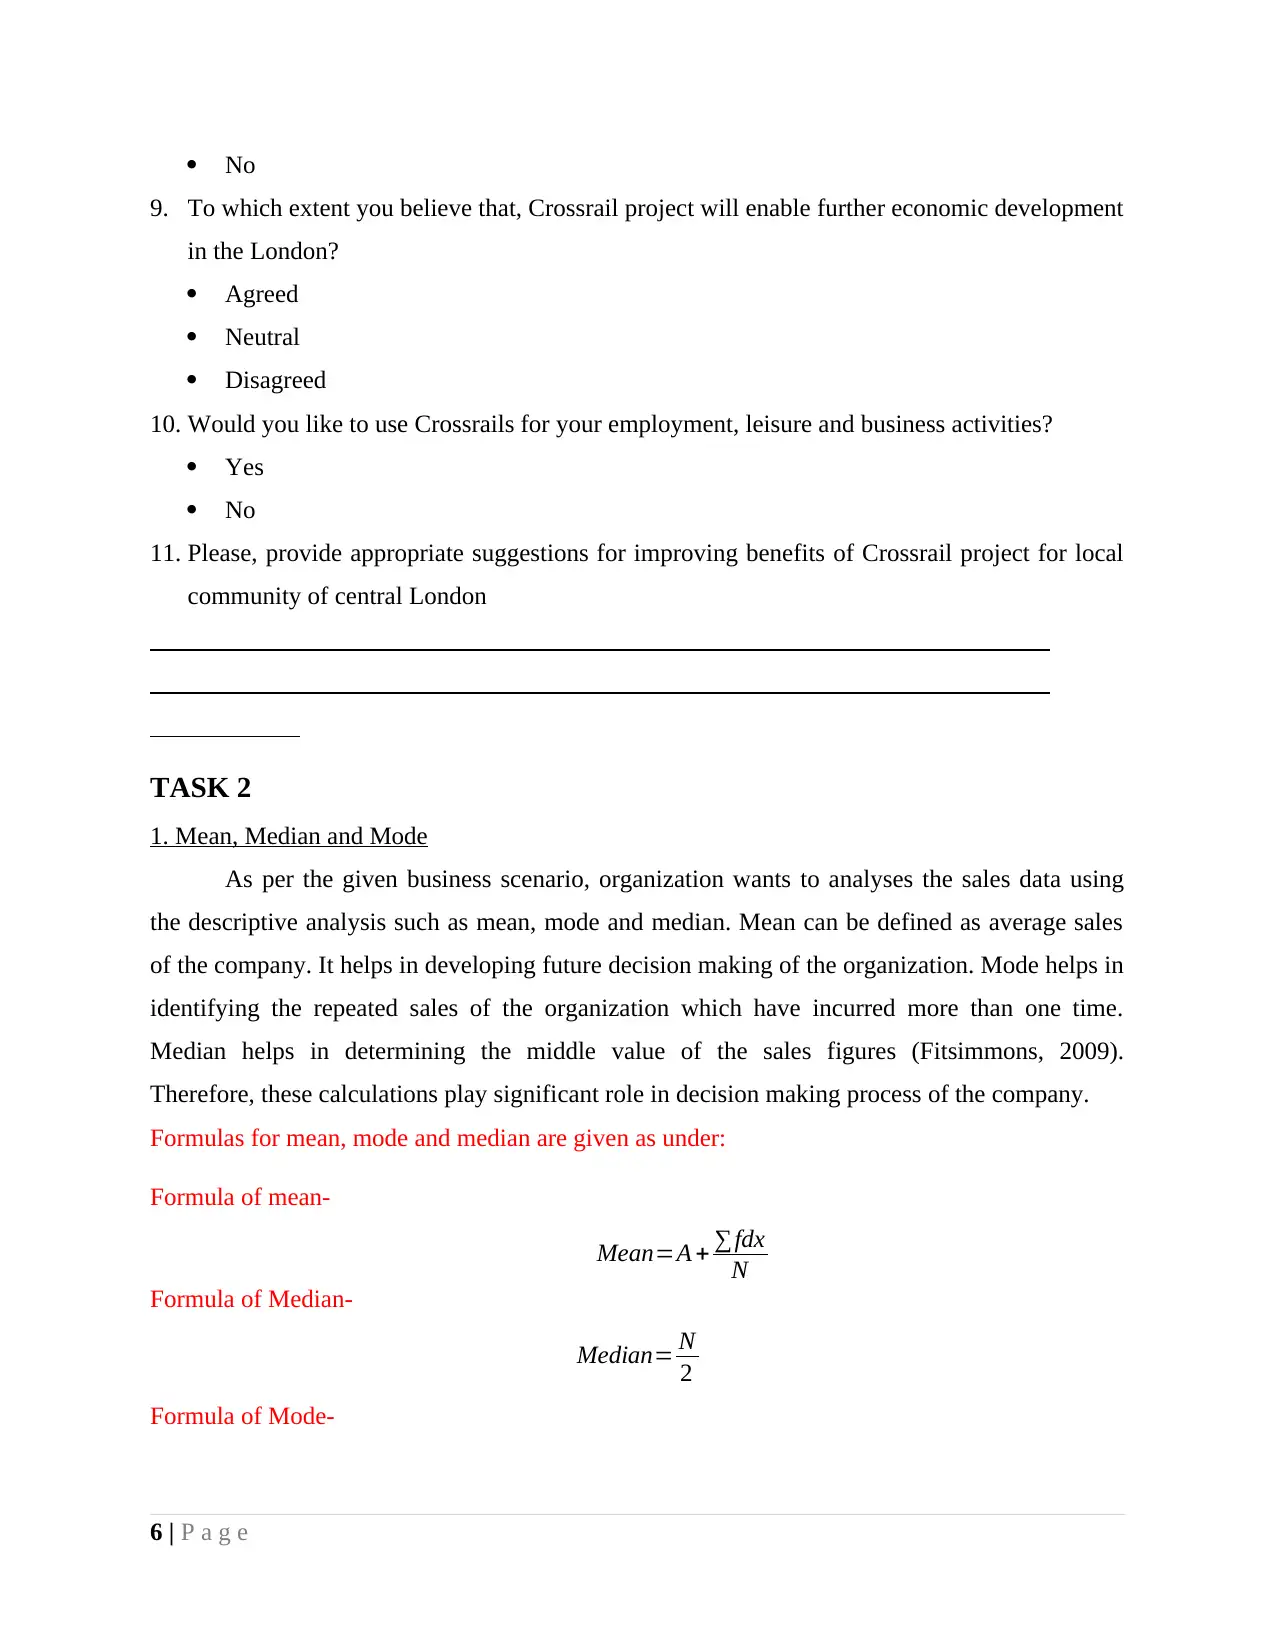
11. Please, provide appropriate suggestions for improving benefits of Crossrail project for local
community of central London
TASK 2
1. Mean, Median and Mode
As per the given business scenario, organization wants to analyses the sales data using
the descriptive analysis such as mean, mode and median. Mean can be defined as average sales
of the company. It helps in developing future decision making of the organization. Mode helps in
identifying the repeated sales of the organization which have incurred more than one time.
Median helps in determining the middle value of the sales figures (Fitsimmons, 2009).
Therefore, these calculations play significant role in decision making process of the company.
Formulas for mean, mode and median are given as under:
Formula of mean-
Mean=A + ∑fdx
N
Formula of Median-
Median= N
2
Formula of Mode-
6 | P a g e
9. To which extent you believe that, Crossrail project will enable further economic development
in the London?
Agreed
Neutral
Disagreed
10. Would you like to use Crossrails for your employment, leisure and business activities?
Yes
No
11. Please, provide appropriate suggestions for improving benefits of Crossrail project for local
community of central London
TASK 2
1. Mean, Median and Mode
As per the given business scenario, organization wants to analyses the sales data using
the descriptive analysis such as mean, mode and median. Mean can be defined as average sales
of the company. It helps in developing future decision making of the organization. Mode helps in
identifying the repeated sales of the organization which have incurred more than one time.
Median helps in determining the middle value of the sales figures (Fitsimmons, 2009).
Therefore, these calculations play significant role in decision making process of the company.
Formulas for mean, mode and median are given as under:
Formula of mean-
Mean=A + ∑fdx
N
Formula of Median-
Median= N
2
Formula of Mode-
6 | P a g e
⊘ This is a preview!⊘
Do you want full access?
Subscribe today to unlock all pages.
Trusted by 1+ million students worldwide
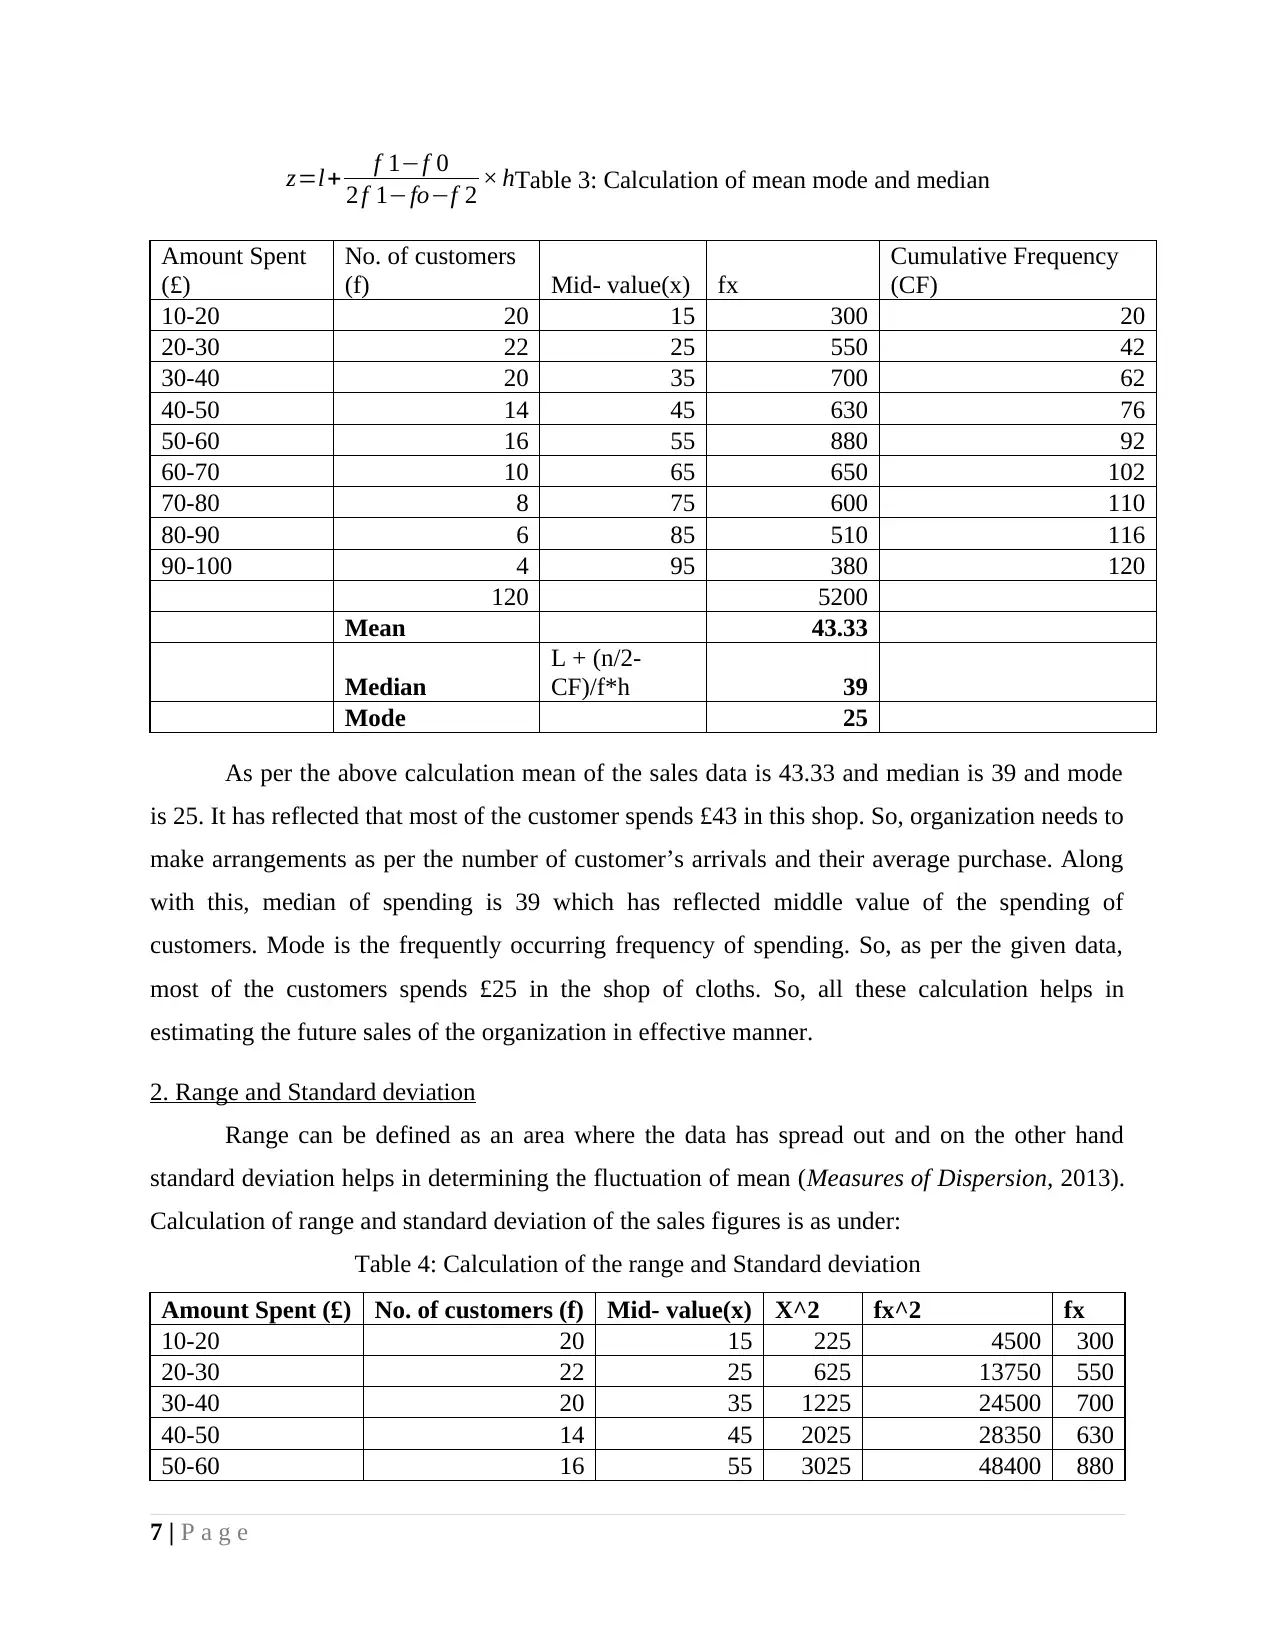
z=l+ f 1−f 0
2 f 1−fo−f 2 × hTable 3: Calculation of mean mode and median
Amount Spent
(£)
No. of customers
(f) Mid- value(x) fx
Cumulative Frequency
(CF)
10-20 20 15 300 20
20-30 22 25 550 42
30-40 20 35 700 62
40-50 14 45 630 76
50-60 16 55 880 92
60-70 10 65 650 102
70-80 8 75 600 110
80-90 6 85 510 116
90-100 4 95 380 120
120 5200
Mean 43.33
Median
L + (n/2-
CF)/f*h 39
Mode 25
As per the above calculation mean of the sales data is 43.33 and median is 39 and mode
is 25. It has reflected that most of the customer spends £43 in this shop. So, organization needs to
make arrangements as per the number of customer’s arrivals and their average purchase. Along
with this, median of spending is 39 which has reflected middle value of the spending of
customers. Mode is the frequently occurring frequency of spending. So, as per the given data,
most of the customers spends £25 in the shop of cloths. So, all these calculation helps in
estimating the future sales of the organization in effective manner.
2. Range and Standard deviation
Range can be defined as an area where the data has spread out and on the other hand
standard deviation helps in determining the fluctuation of mean (Measures of Dispersion, 2013).
Calculation of range and standard deviation of the sales figures is as under:
Table 4: Calculation of the range and Standard deviation
Amount Spent (£) No. of customers (f) Mid- value(x) X^2 fx^2 fx
10-20 20 15 225 4500 300
20-30 22 25 625 13750 550
30-40 20 35 1225 24500 700
40-50 14 45 2025 28350 630
50-60 16 55 3025 48400 880
7 | P a g e
Paraphrase This Document
Need a fresh take? Get an instant paraphrase of this document with our AI Paraphraser
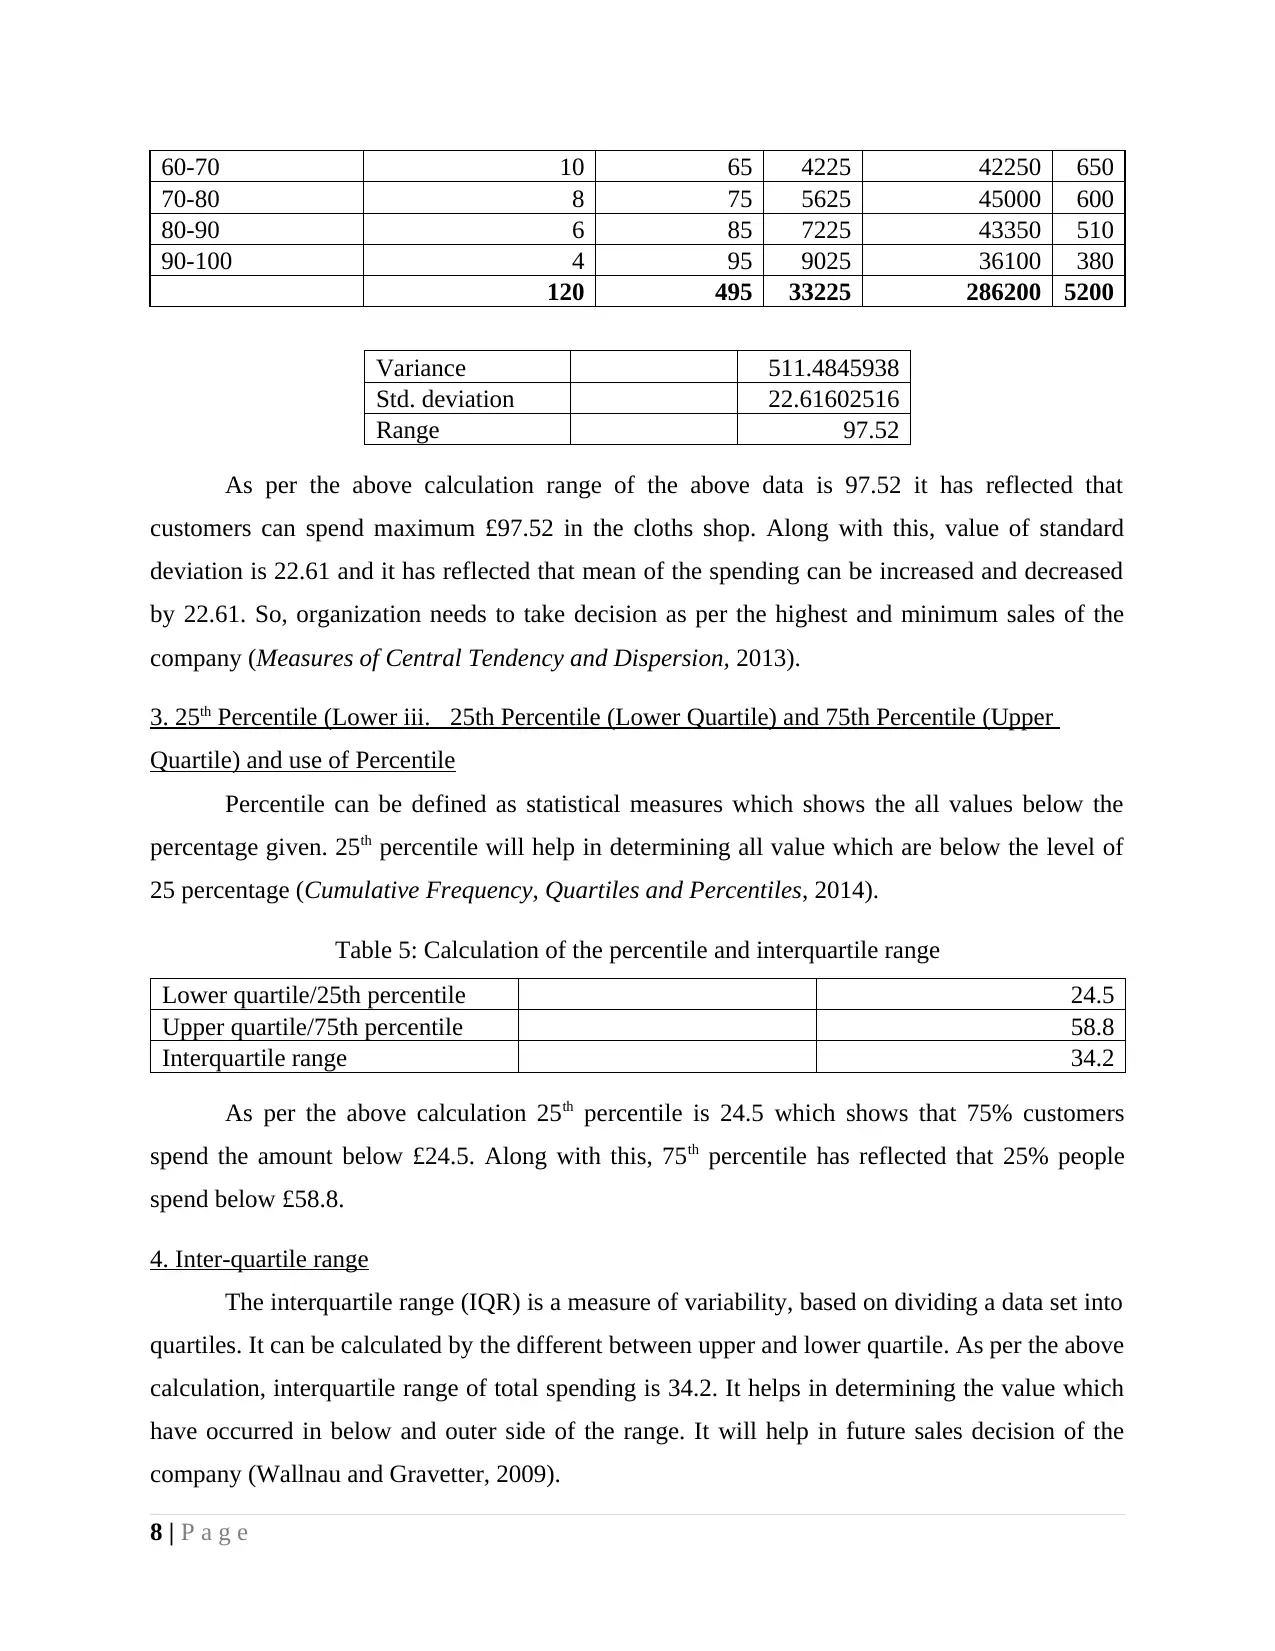
60-70 10 65 4225 42250 650
70-80 8 75 5625 45000 600
80-90 6 85 7225 43350 510
90-100 4 95 9025 36100 380
120 495 33225 286200 5200
Variance 511.4845938
Std. deviation 22.61602516
Range 97.52
As per the above calculation range of the above data is 97.52 it has reflected that
customers can spend maximum £97.52 in the cloths shop. Along with this, value of standard
deviation is 22.61 and it has reflected that mean of the spending can be increased and decreased
by 22.61. So, organization needs to take decision as per the highest and minimum sales of the
company (Measures of Central Tendency and Dispersion, 2013).
3. 25th Percentile (Lower iii. 25th Percentile (Lower Quartile) and 75th Percentile (Upper
Quartile) and use of Percentile
Percentile can be defined as statistical measures which shows the all values below the
percentage given. 25th percentile will help in determining all value which are below the level of
25 percentage (Cumulative Frequency, Quartiles and Percentiles, 2014).
Table 5: Calculation of the percentile and interquartile range
Lower quartile/25th percentile 24.5
Upper quartile/75th percentile 58.8
Interquartile range 34.2
As per the above calculation 25th percentile is 24.5 which shows that 75% customers
spend the amount below £24.5. Along with this, 75th percentile has reflected that 25% people
spend below £58.8.
4. Inter-quartile range
The interquartile range (IQR) is a measure of variability, based on dividing a data set into
quartiles. It can be calculated by the different between upper and lower quartile. As per the above
calculation, interquartile range of total spending is 34.2. It helps in determining the value which
have occurred in below and outer side of the range. It will help in future sales decision of the
company (Wallnau and Gravetter, 2009).
8 | P a g e
5. Calculation of correlation coefficient
Correlation coefficient helps in determining relationship between two different variables.
Company wants to determine the relationship between sales and discount figure of organization.
Calculation of correlation coefficient is described as under:
Table 6: Calculation of correlation coefficient
Correlation Coefficient
Sales (Units ) Discount (%)
Sales (Units ) 1 0.97441
Discount (%) 0.9744106 1
Coefficient of correlation is 0.97 which has reflected that sales and discount is highly
correlated with each other. If company increases the discount then, it will help in augmenting the
total sales of the organization as well (Sheu, 2005).
TASK 3
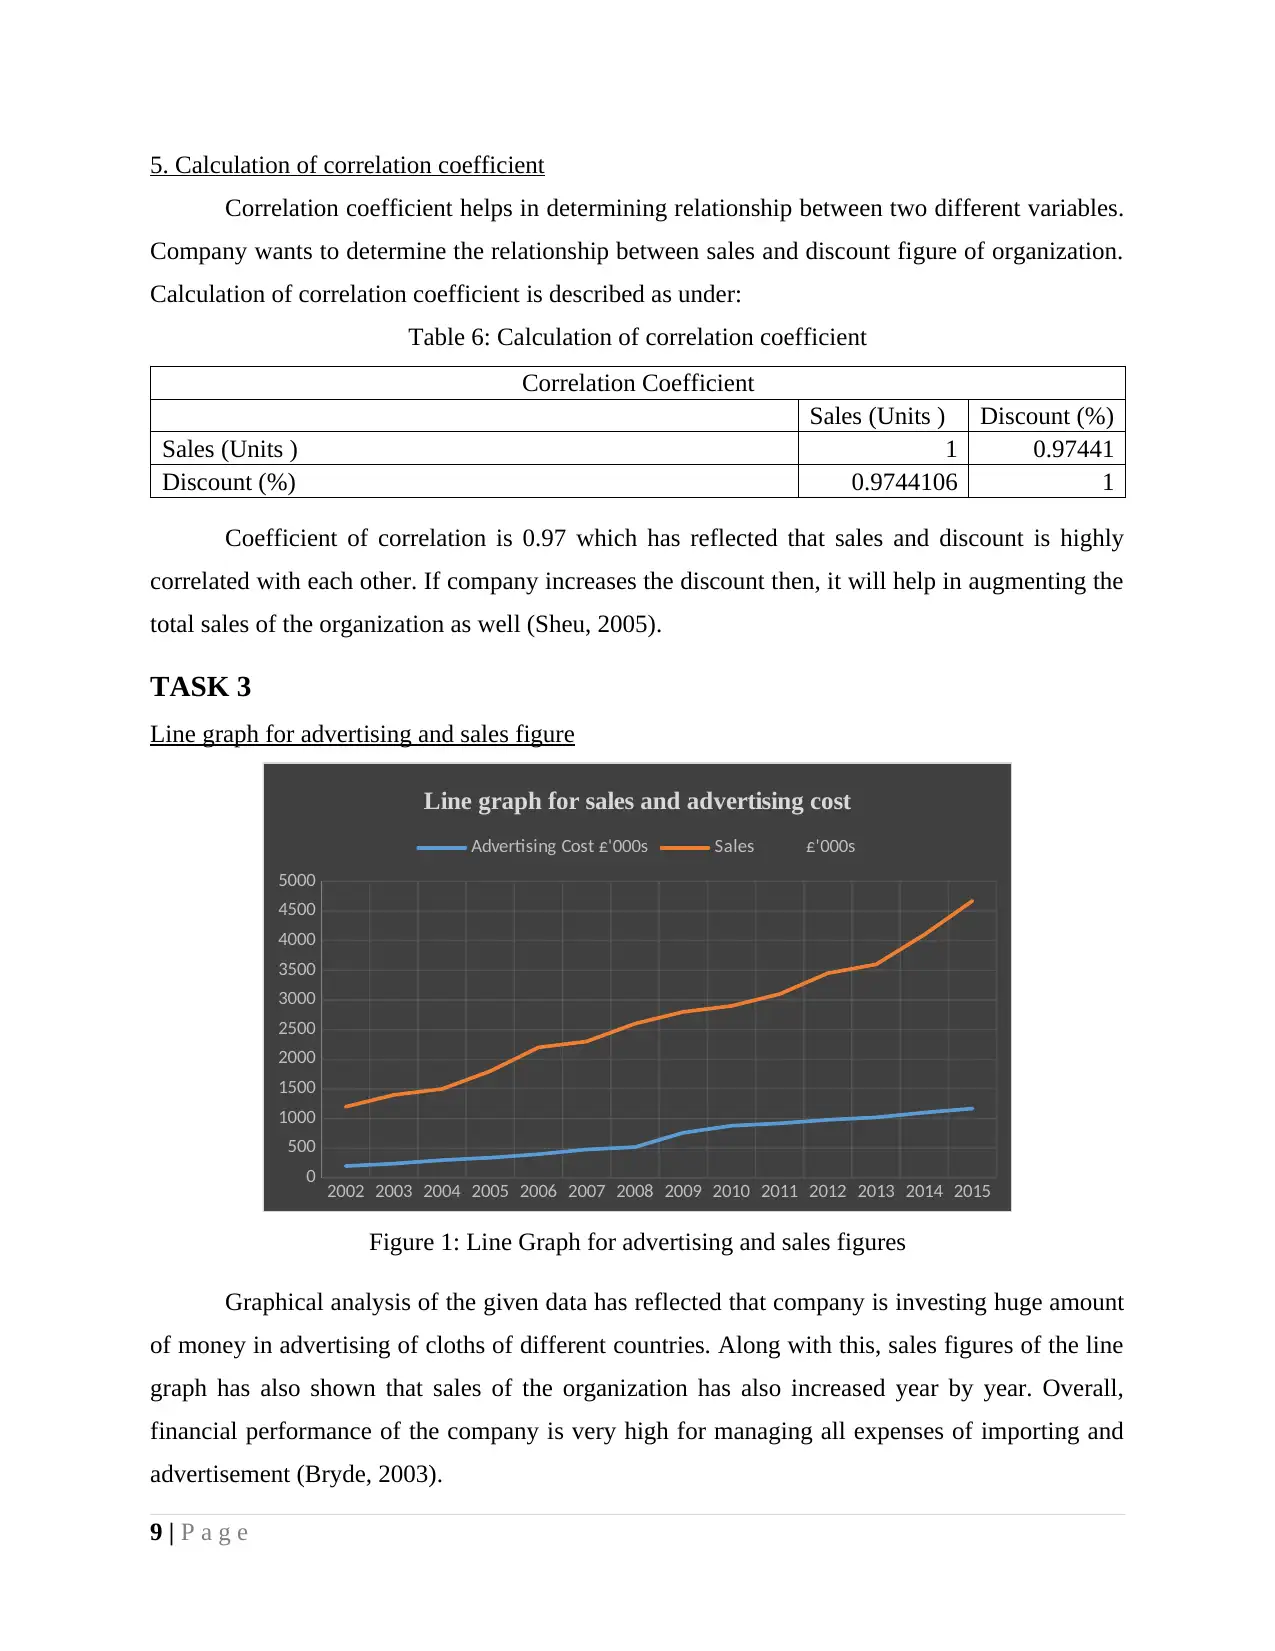
Line graph for advertising and sales figure
2002 2003 2004 2005 2006 2007 2008 2009 2010 2011 2012 2013 2014 2015
0
500
1000
1500
2000
2500
3000
3500
4000
4500
5000
Line graph for sales and advertising cost
Advertising Cost £'000s Sales £'000s
Figure 1: Line Graph for advertising and sales figures
Graphical analysis of the given data has reflected that company is investing huge amount
of money in advertising of cloths of different countries. Along with this, sales figures of the line
graph has also shown that sales of the organization has also increased year by year. Overall,
financial performance of the company is very high for managing all expenses of importing and
advertisement (Bryde, 2003).
9 | P a g e
Correlation coefficient helps in determining relationship between two different variables.
Company wants to determine the relationship between sales and discount figure of organization.
Calculation of correlation coefficient is described as under:
Table 6: Calculation of correlation coefficient
Correlation Coefficient
Sales (Units ) Discount (%)
Sales (Units ) 1 0.97441
Discount (%) 0.9744106 1
Coefficient of correlation is 0.97 which has reflected that sales and discount is highly
correlated with each other. If company increases the discount then, it will help in augmenting the
total sales of the organization as well (Sheu, 2005).
TASK 3
Line graph for advertising and sales figure
2002 2003 2004 2005 2006 2007 2008 2009 2010 2011 2012 2013 2014 2015
0
500
1000
1500
2000
2500
3000
3500
4000
4500
5000
Line graph for sales and advertising cost
Advertising Cost £'000s Sales £'000s
Figure 1: Line Graph for advertising and sales figures
Graphical analysis of the given data has reflected that company is investing huge amount
of money in advertising of cloths of different countries. Along with this, sales figures of the line
graph has also shown that sales of the organization has also increased year by year. Overall,
financial performance of the company is very high for managing all expenses of importing and
advertisement (Bryde, 2003).
9 | P a g e
⊘ This is a preview!⊘
Do you want full access?
Subscribe today to unlock all pages.
Trusted by 1+ million students worldwide
1 out of 24
Related Documents


Your All-in-One AI-Powered Toolkit for Academic Success.
+13062052269
info@desklib.com
Available 24*7 on WhatsApp / Email
![[object Object]](/_next/static/media/star-bottom.7253800d.svg)
Unlock your academic potential
Copyright © 2020–2025 A2Z Services. All Rights Reserved. Developed and managed by ZUCOL.