Business Decision Making: Project on Data Analysis and Report (UKCBC)

Verified

Added on  2023/03/29

|13
|362
|471
Project
AI Summary
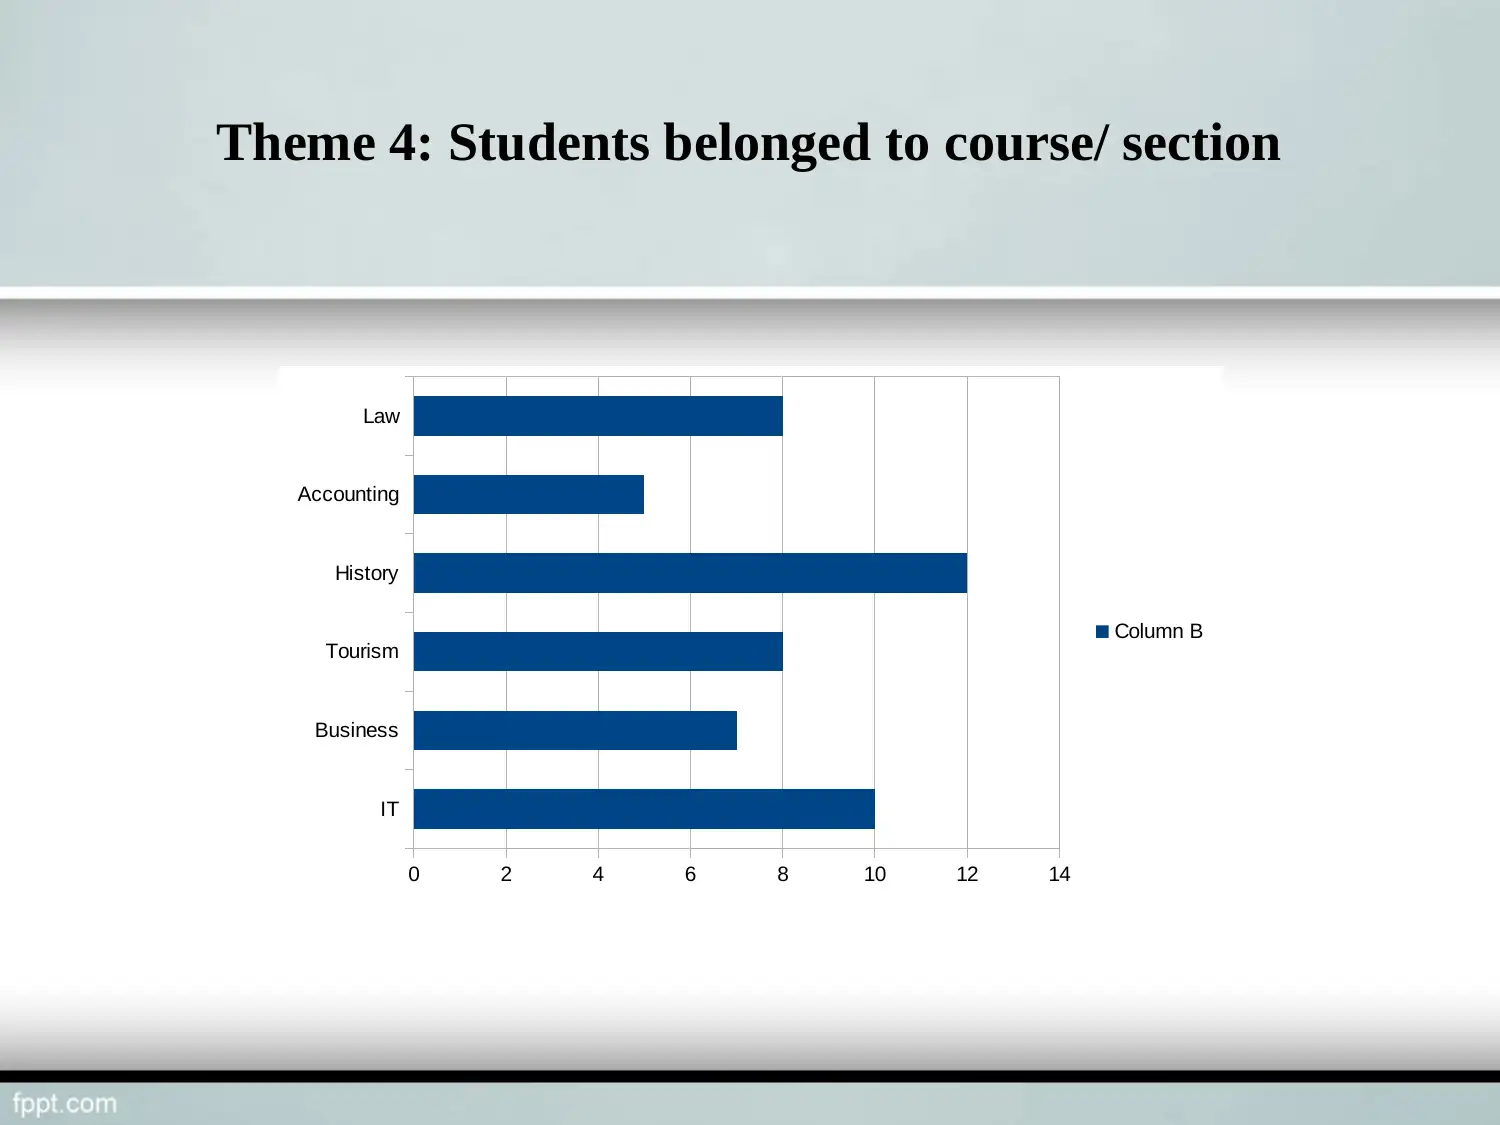
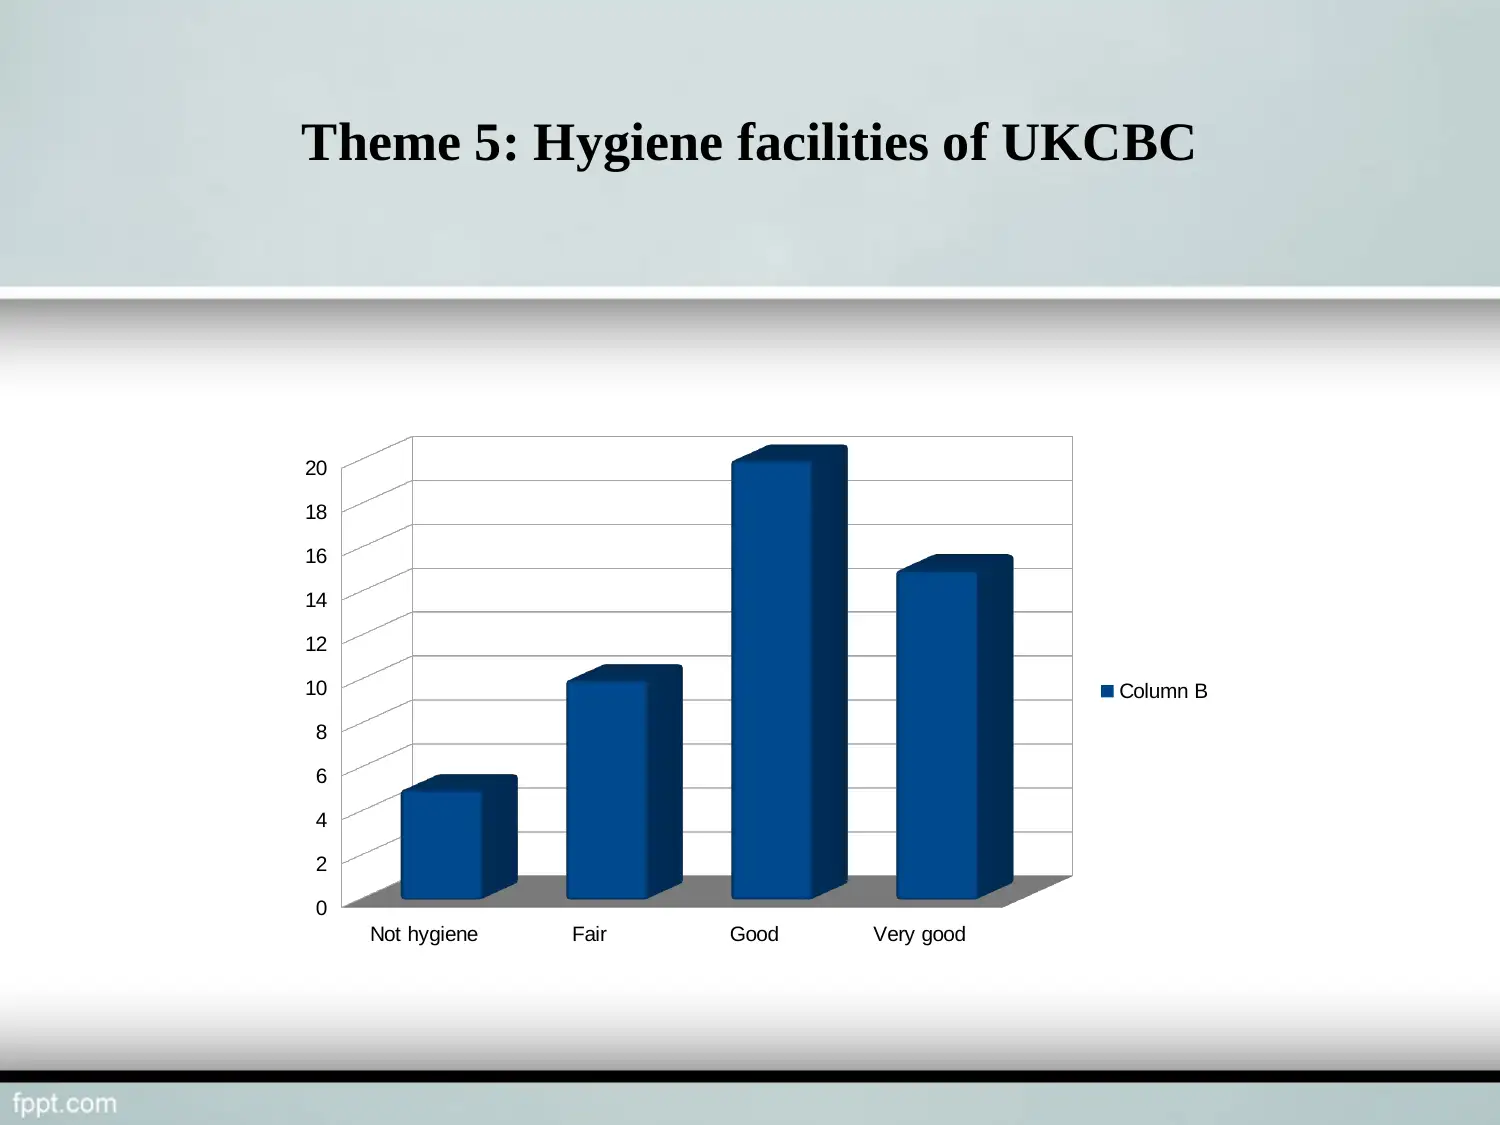
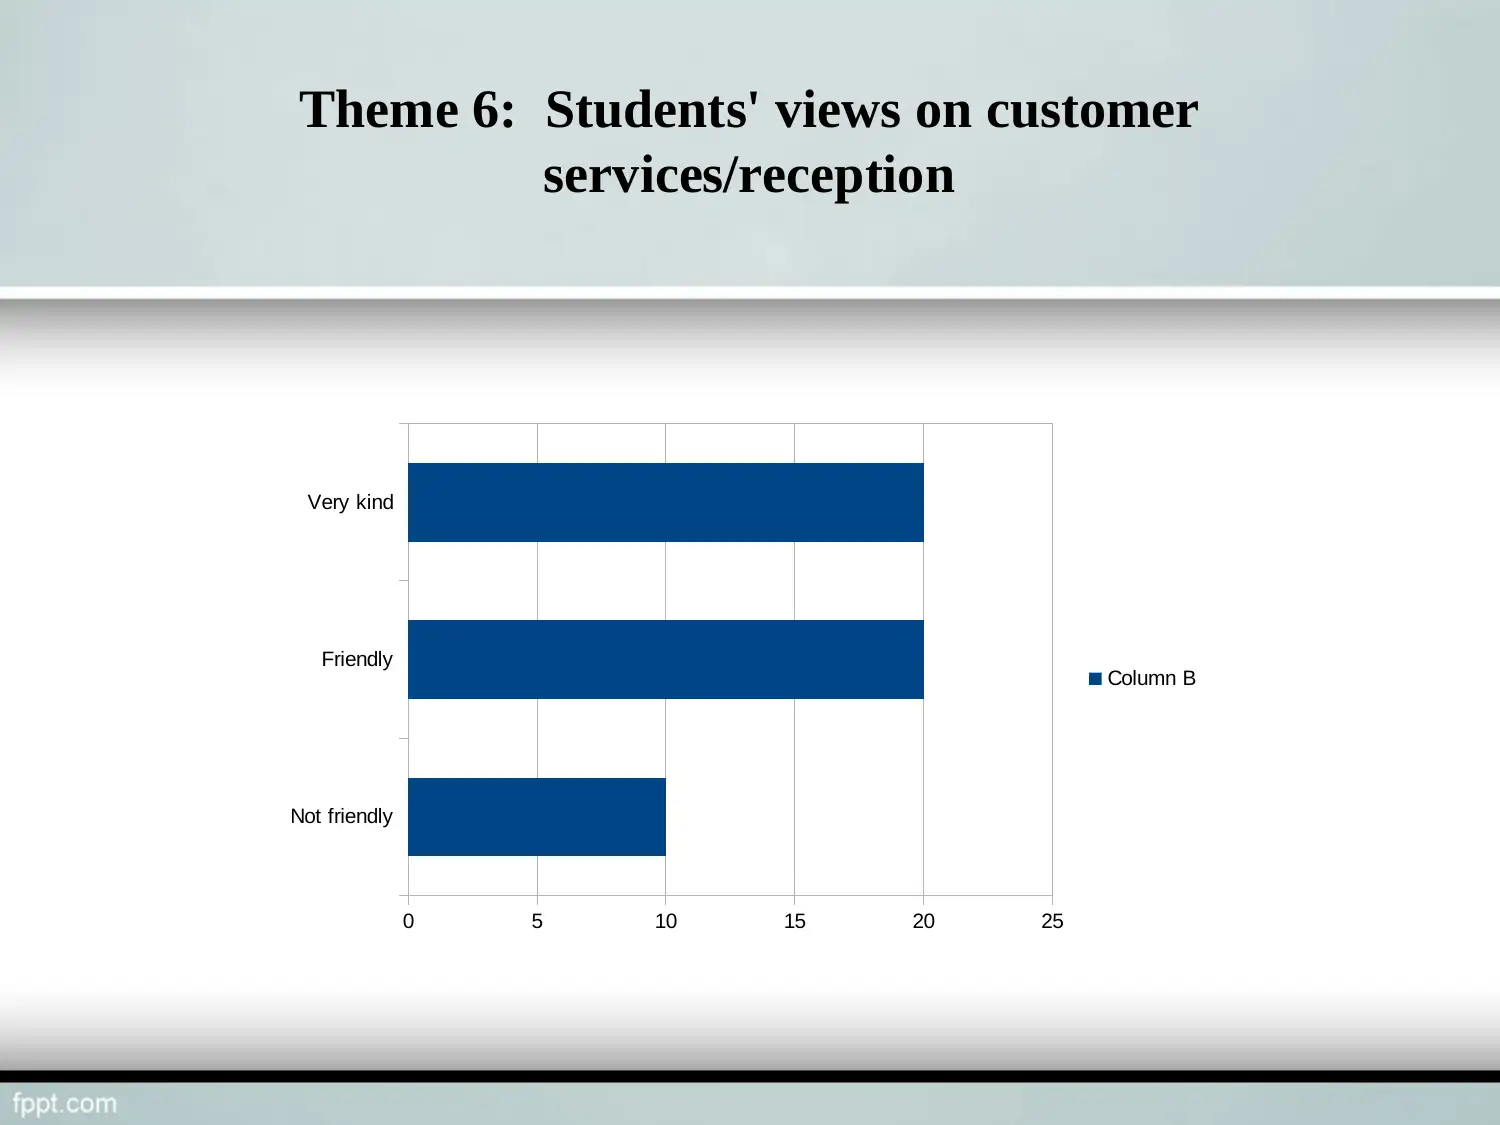
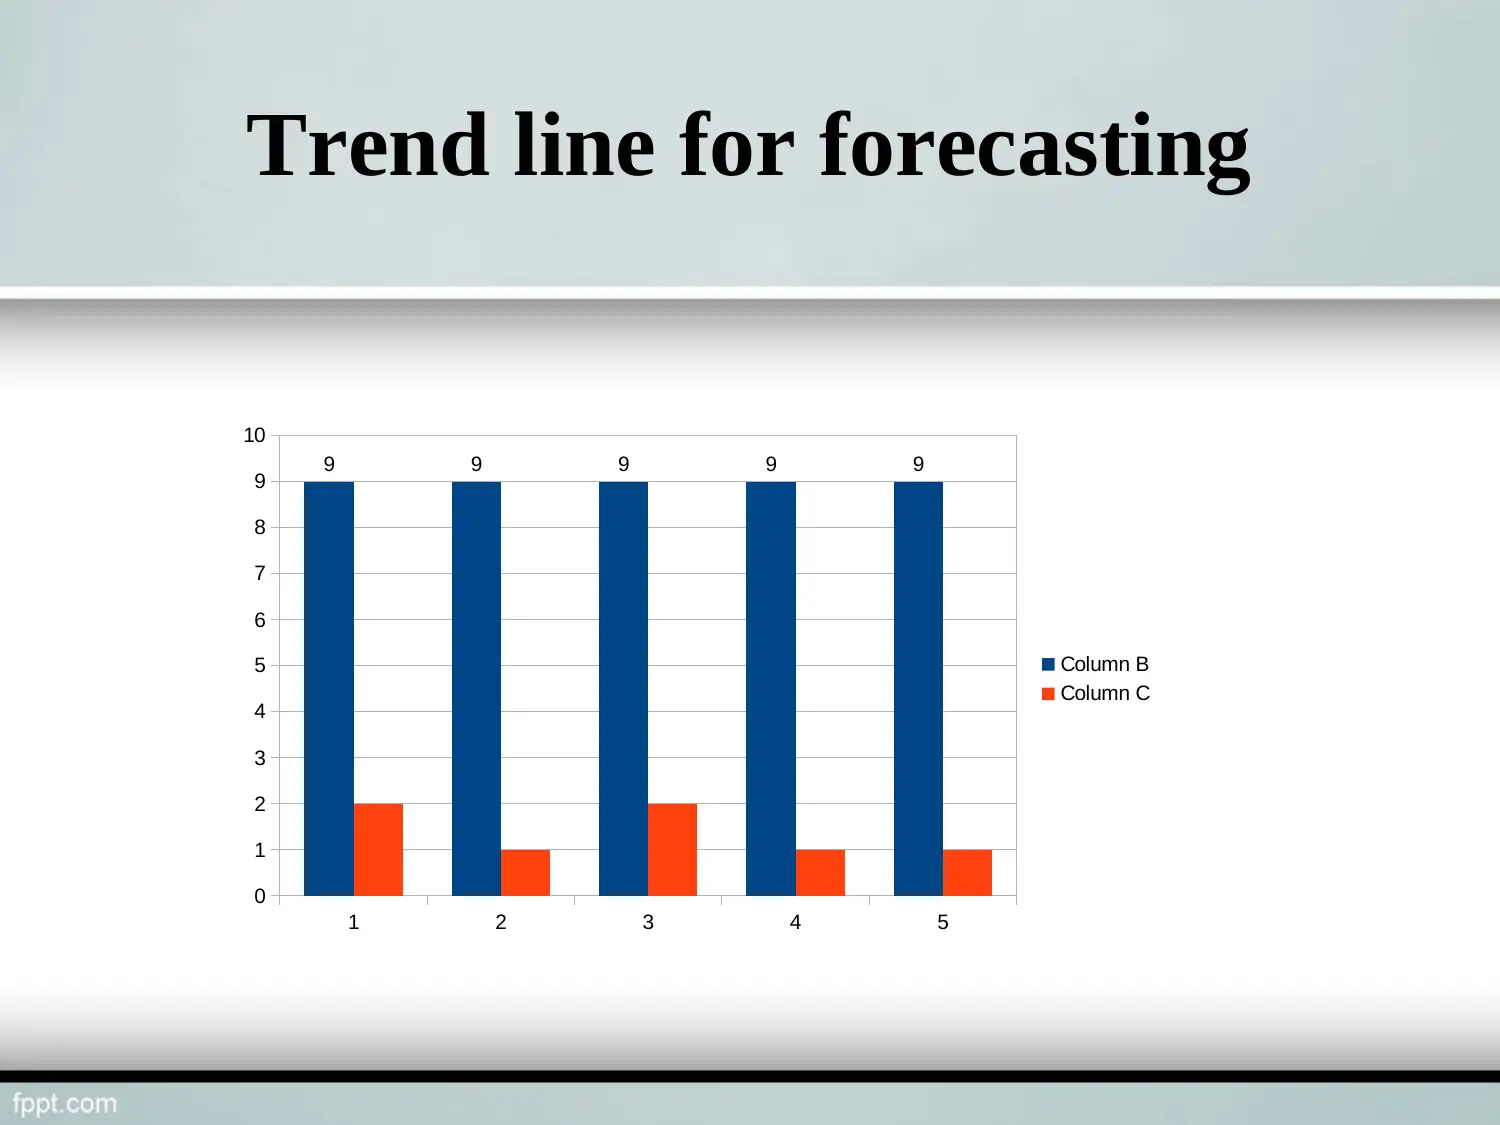
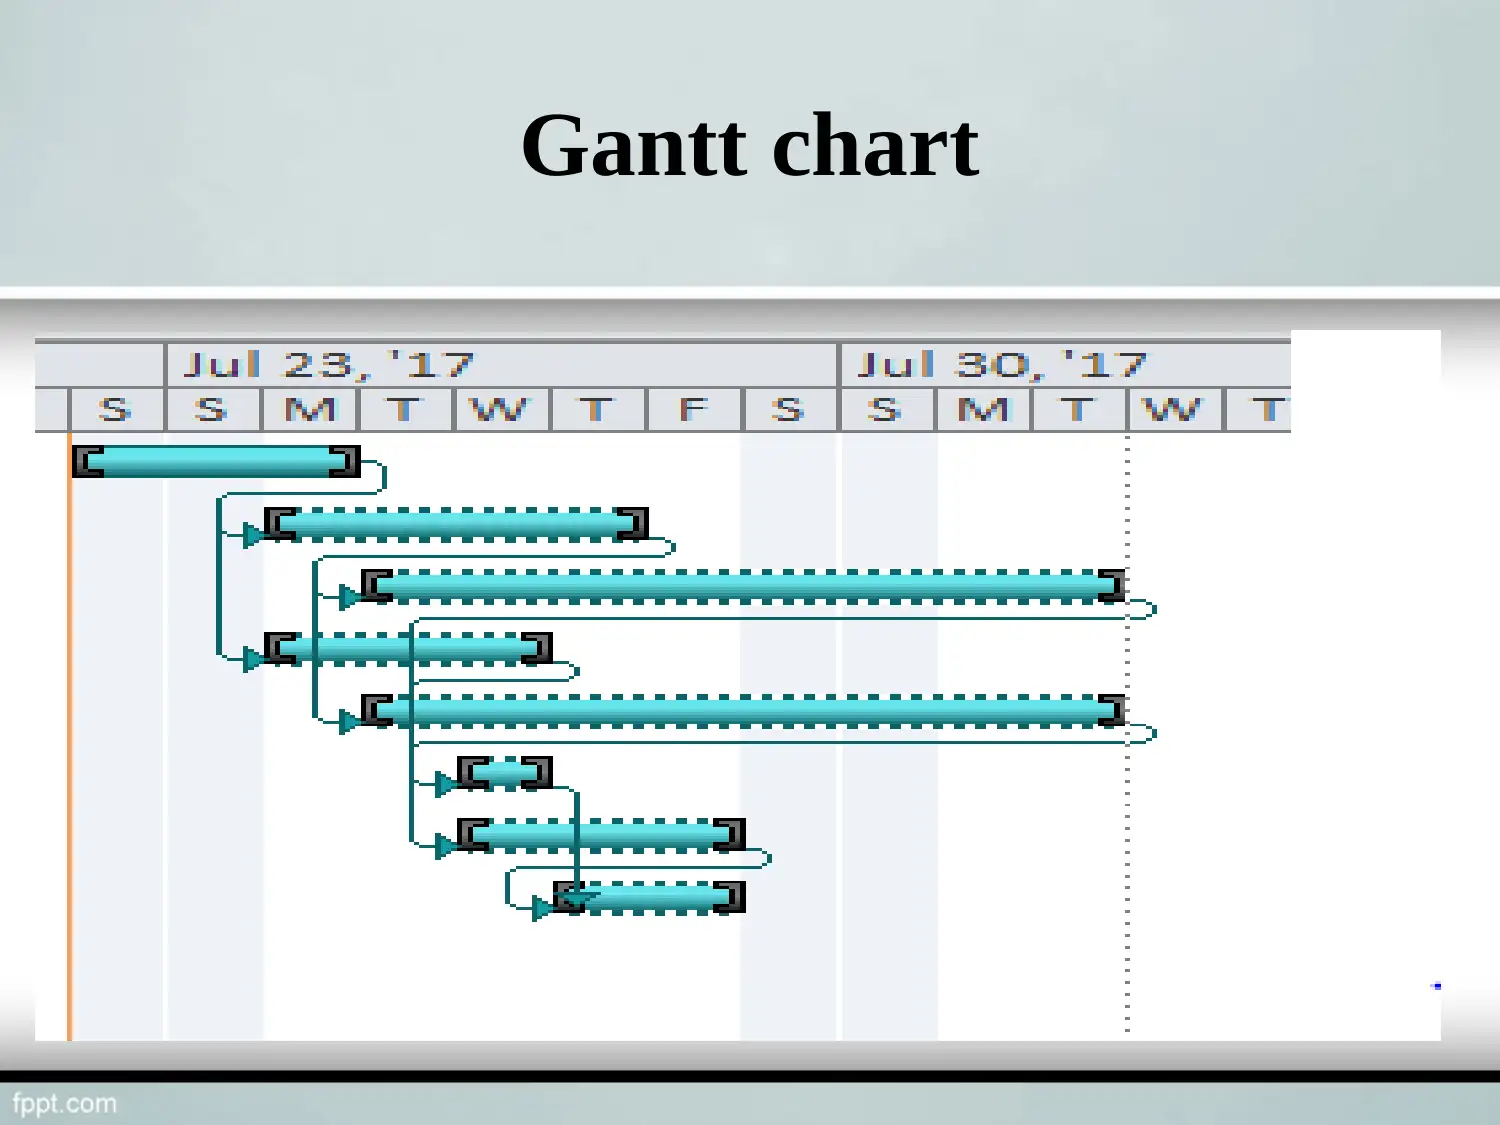
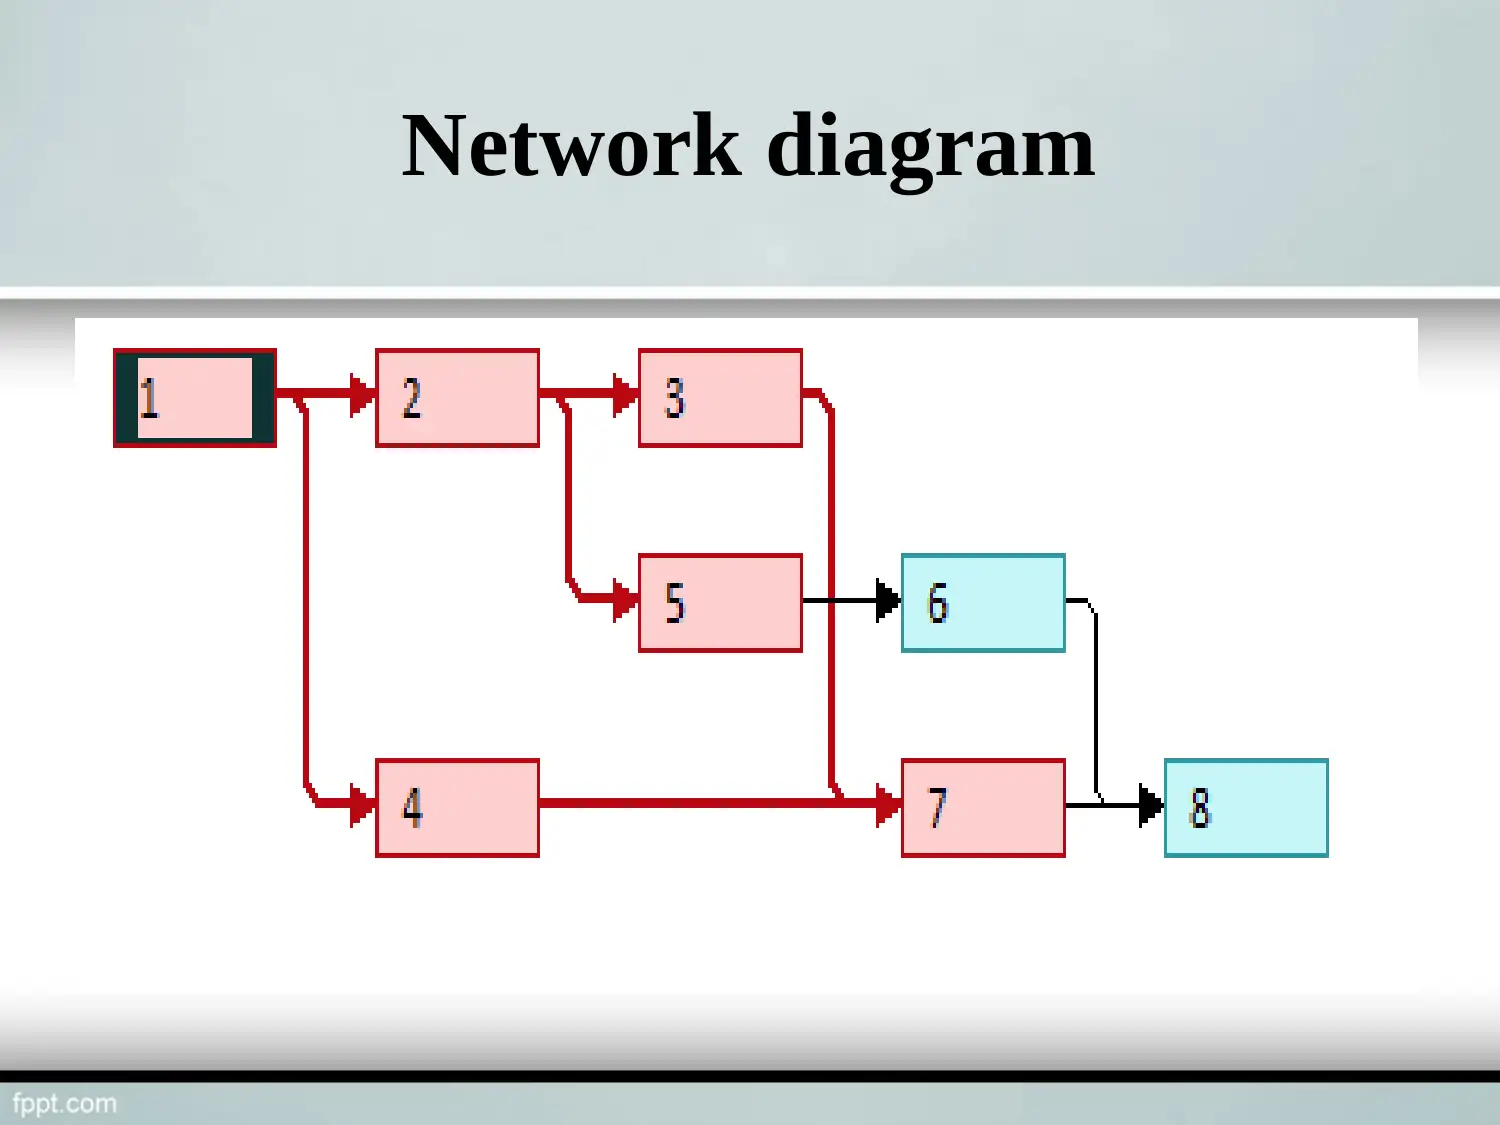
This project is a comprehensive analysis of business decision-making, presented through a PowerPoint presentation. The project includes thematic presentations on various aspects, such as ethnic groups, student satisfaction levels, year groups, course sections, hygiene facilities, and customer service experiences. It uses charts and graphs to visualize data, and includes trend lines for forecasting. The project incorporates project planning tools like Gantt charts and network diagrams, and provides a list of references. This assignment is designed to help students understand data analysis and decision-making processes in a business context. The project is available on Desklib, a platform for students to access past papers and solved assignments.
Document Page
Business Decision
Making
tabler-icon-diamond-filled.svg

Paraphrase This Document

Need a fresh take? Get an instant paraphrase of this document with our AI Paraphraser
Document Page
Included contents in the ppt.
Graphical presentation (Thematic):
Theme 1: Students belonged to ethnic group
Theme 2: Satisfaction level of students
Theme 3: Year group of respondents in which they are studying
Theme 4: Students belonged to course/ section
Theme 5: Hygiene facilities of UKCBC
Theme 6: Students' views on customer services/reception
Trend line for forecasting
Project plan
Document Page
Theme 1: Students belonged to ethnic group
White African black Chinese Asian Other
0
2
4
6
8
10
12
14
16
18
20
Column B
Document Page
Theme 2: Satisfaction level of students
Not satisfied Satisfied Very satisfied
0
5
10
15
20
25
30
Column B
tabler-icon-diamond-filled.svg

Paraphrase This Document

Need a fresh take? Get an instant paraphrase of this document with our AI Paraphraser
Document Page
Theme 3: Year group of respondents who participated in
survey
20
30
1st Year
2nd Year
Document Page
Theme 4: Students belonged to course/ section
IT
Business
Tourism
History
Accounting
Law
0 2 4 6 8 10 12 14
Column B
Document Page
Theme 5: Hygiene facilities of UKCBC
Not hygiene Fair Good Very good
0
2
4
6
8
10
12
14
16
18
20
Column B
tabler-icon-diamond-filled.svg

Paraphrase This Document

Need a fresh take? Get an instant paraphrase of this document with our AI Paraphraser
Document Page
Theme 6: Students' views on customer
services/reception
Not friendly
Friendly
Very kind
0 5 10 15 20 25
Column B
Document Page
Trend line for forecasting
1 2 3 4 5
0
1
2
3
4
5
6
7
8
9
10
9 9 9 9 9
Column B
Column C
Document Page
Project plan
For project planning and decision making
following tools are used:
Gantt chart
Network diagram
tabler-icon-diamond-filled.svg

Paraphrase This Document

Need a fresh take? Get an instant paraphrase of this document with our AI Paraphraser
Document Page
Gantt chart
Document Page
Network diagram
chevron_up_icon
1 out of 13
circle_padding
hide_on_mobile
zoom_out_icon
[object Object]