Decision Making and Financial Analysis
VerifiedAdded on 2020/02/05
|19
|4361
|43
Report
AI Summary
This assignment examines the role of decision-making processes in business, particularly focusing on financial analysis techniques. It utilizes real-world examples and calculations to illustrate concepts such as Net Present Value (NPV), Internal Rate of Return (IRR), and critical path analysis. The analysis aims to demonstrate how these tools can help businesses make informed decisions about investment projects.
Contribute Materials
Your contribution can guide someone’s learning journey. Share your
documents today.
Business Decision Making
Secure Best Marks with AI Grader
Need help grading? Try our AI Grader for instant feedback on your assignments.
TABLE OF CONTENTS
INTRODUCTION...........................................................................................................................1
TASK 1............................................................................................................................................1
1.1 ..........................................................................................................................................1
1.2...........................................................................................................................................2
1.3: .........................................................................................................................................3
TASK 2............................................................................................................................................5
2.1: .........................................................................................................................................5
2.2: .........................................................................................................................................6
2.3 ..........................................................................................................................................7
2.4 ..........................................................................................................................................8
TASK 3............................................................................................................................................8
3.1 ..........................................................................................................................................8
3.2 ........................................................................................................................................10
3.3 : Covered in PPT............................................................................................................11
3.4.........................................................................................................................................11
TASK 4..........................................................................................................................................12
4.1.........................................................................................................................................12
4.2 ........................................................................................................................................14
CONCLUSION..............................................................................................................................16
REFERENCES..............................................................................................................................17
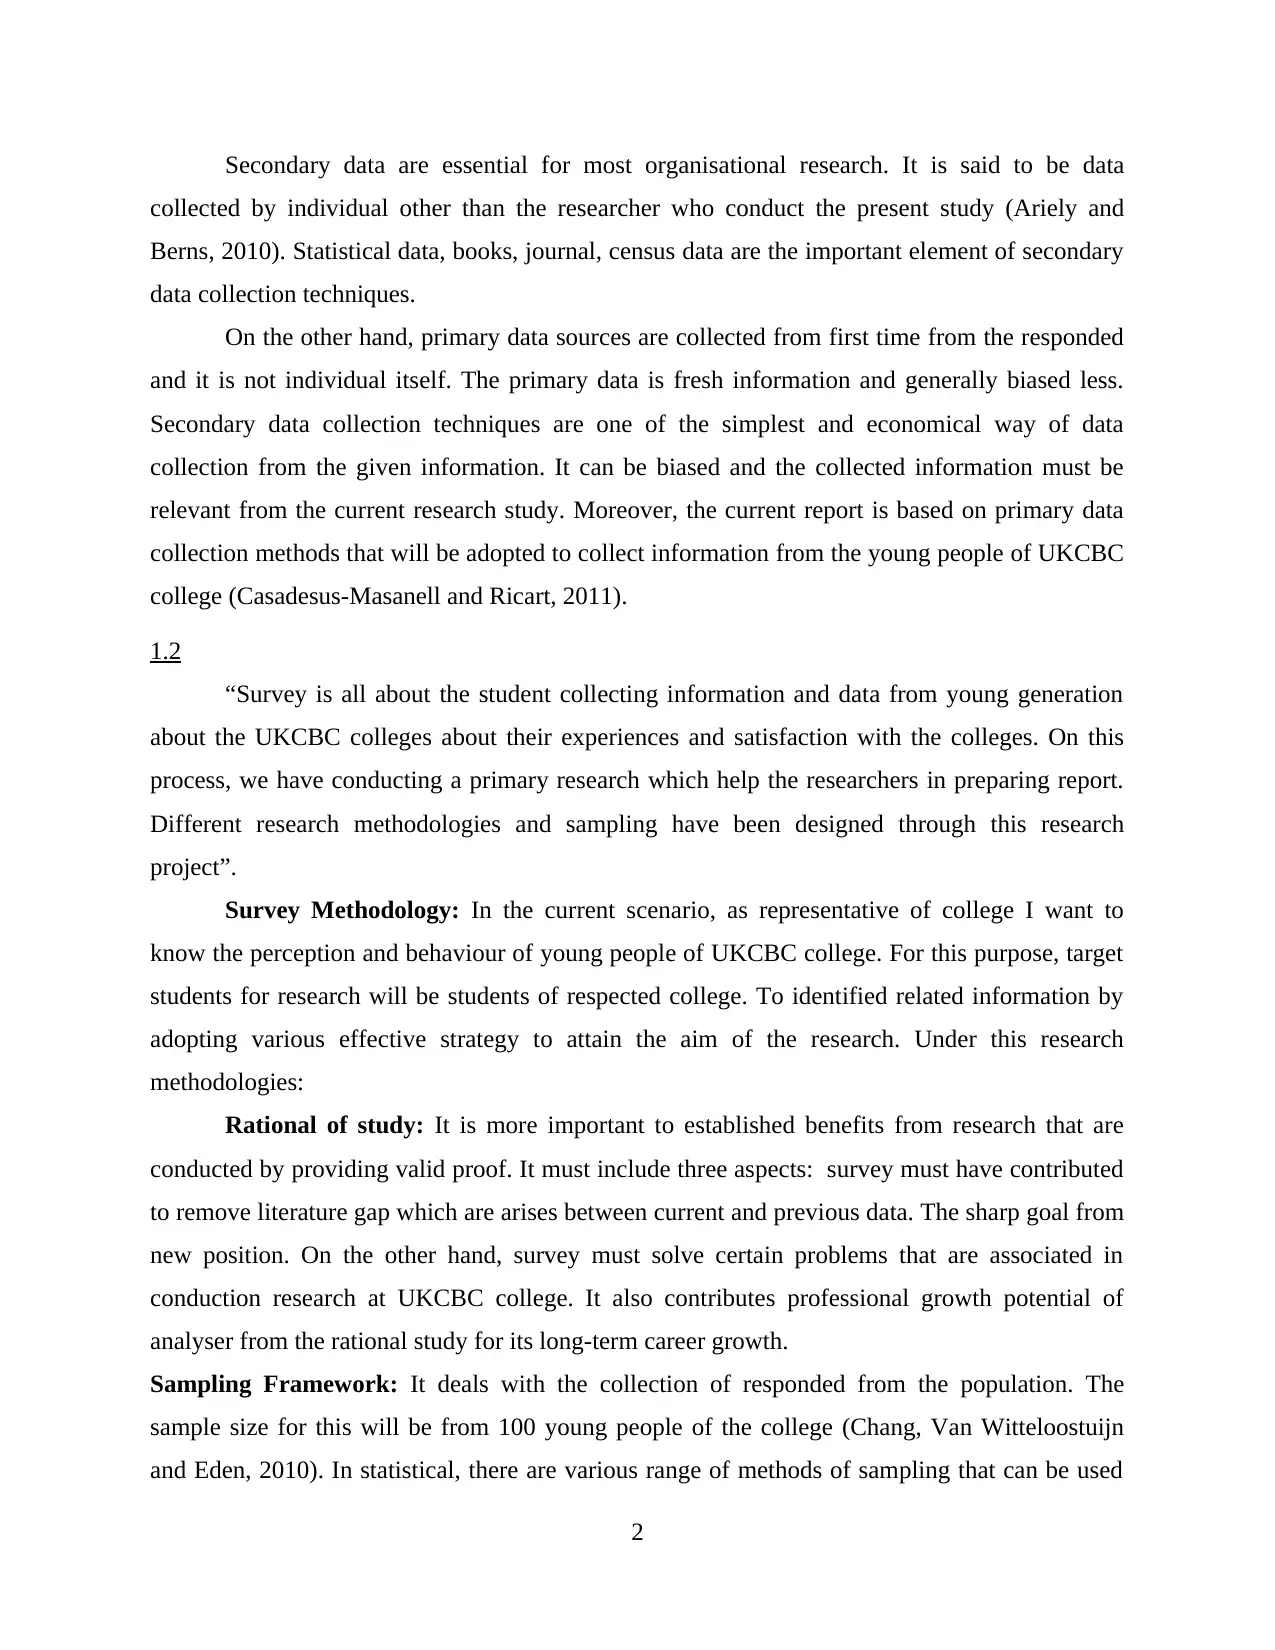
INTRODUCTION
BDM is considered as one of the important tool used by any organisation to manage and
control their decision regarding its daily operations. It is a content or a class of study between
various choice prospect. Any company plan to create honour for its holders, customer and other
partners (Ariely and Berns, 2010). Under this project report, there are respective tasks which are
explaining different situations of research. It consists of students experiences and their
satisfaction regarding there UKCBC college. In order to know correct results various data
collection plan is used. A complete of methods and techniques are used to collect necessary
information from students so that a perfect report should be made which is going to be submitted
to the QAA committee.
Thus, it is considered as that process which is used for making suitable and appropriate
decision, by examine and evaluating accessible data. Under the project research there are several
job are explain which is related with the functional prospect of business decision making.
In the introductory task, full research is planned for UKCBC that desire to know that
how youngsters view their college performance. The second task will comprises of different kind
of arithmetical calculation, graphs and techniques through which performance can be evaluated
simply. Further, it can be financial and project management tools will be discuss, that can be
helpful in making appropriate decision (Maxwell, Jeffrey and Lévesque, 2011).
TASK 1
1.1
On the basis of available case, UK colleges is to be reviewed by QAA team about student
experience and satisfaction which they recognised in the college. Hence, it has been stated that to
know that the perceptions and behaviours of young time period, regarding college perception. In
order to carry out research must be conducted through survey analysis from targeted masses and
collect data that has to be analysed by using appropriate tool in order to find conclusion.
Data collection plan
It is the process of collecting and measuring information on different variables of interest
in establishing individual perceptions that enables one to answer asked research questions,
testing hypotheses and analysed outcome. There are two kinds of data collection techniques such
as primary and secondary.
1
Secondary data are essential for most organisational research. It is said to be data
collected by individual other than the researcher who conduct the present study (Ariely and
Berns, 2010). Statistical data, books, journal, census data are the important element of secondary
data collection techniques.
On the other hand, primary data sources are collected from first time from the responded
and it is not individual itself. The primary data is fresh information and generally biased less.
Secondary data collection techniques are one of the simplest and economical way of data
collection from the given information. It can be biased and the collected information must be
relevant from the current research study. Moreover, the current report is based on primary data
collection methods that will be adopted to collect information from the young people of UKCBC
college (Casadesus-Masanell and Ricart, 2011).
1.2
“Survey is all about the student collecting information and data from young generation
about the UKCBC colleges about their experiences and satisfaction with the colleges. On this
process, we have conducting a primary research which help the researchers in preparing report.
Different research methodologies and sampling have been designed through this research
project”.
Survey Methodology: In the current scenario, as representative of college I want to
know the perception and behaviour of young people of UKCBC college. For this purpose, target
students for research will be students of respected college. To identified related information by
adopting various effective strategy to attain the aim of the research. Under this research
methodologies:
Rational of study: It is more important to established benefits from research that are
conducted by providing valid proof. It must include three aspects: survey must have contributed
to remove literature gap which are arises between current and previous data. The sharp goal from
new position. On the other hand, survey must solve certain problems that are associated in
conduction research at UKCBC college. It also contributes professional growth potential of
analyser from the rational study for its long-term career growth.
Sampling Framework: It deals with the collection of responded from the population. The
sample size for this will be from 100 young people of the college (Chang, Van Witteloostuijn
and Eden, 2010). In statistical, there are various range of methods of sampling that can be used
2
Secure Best Marks with AI Grader
Need help grading? Try our AI Grader for instant feedback on your assignments.
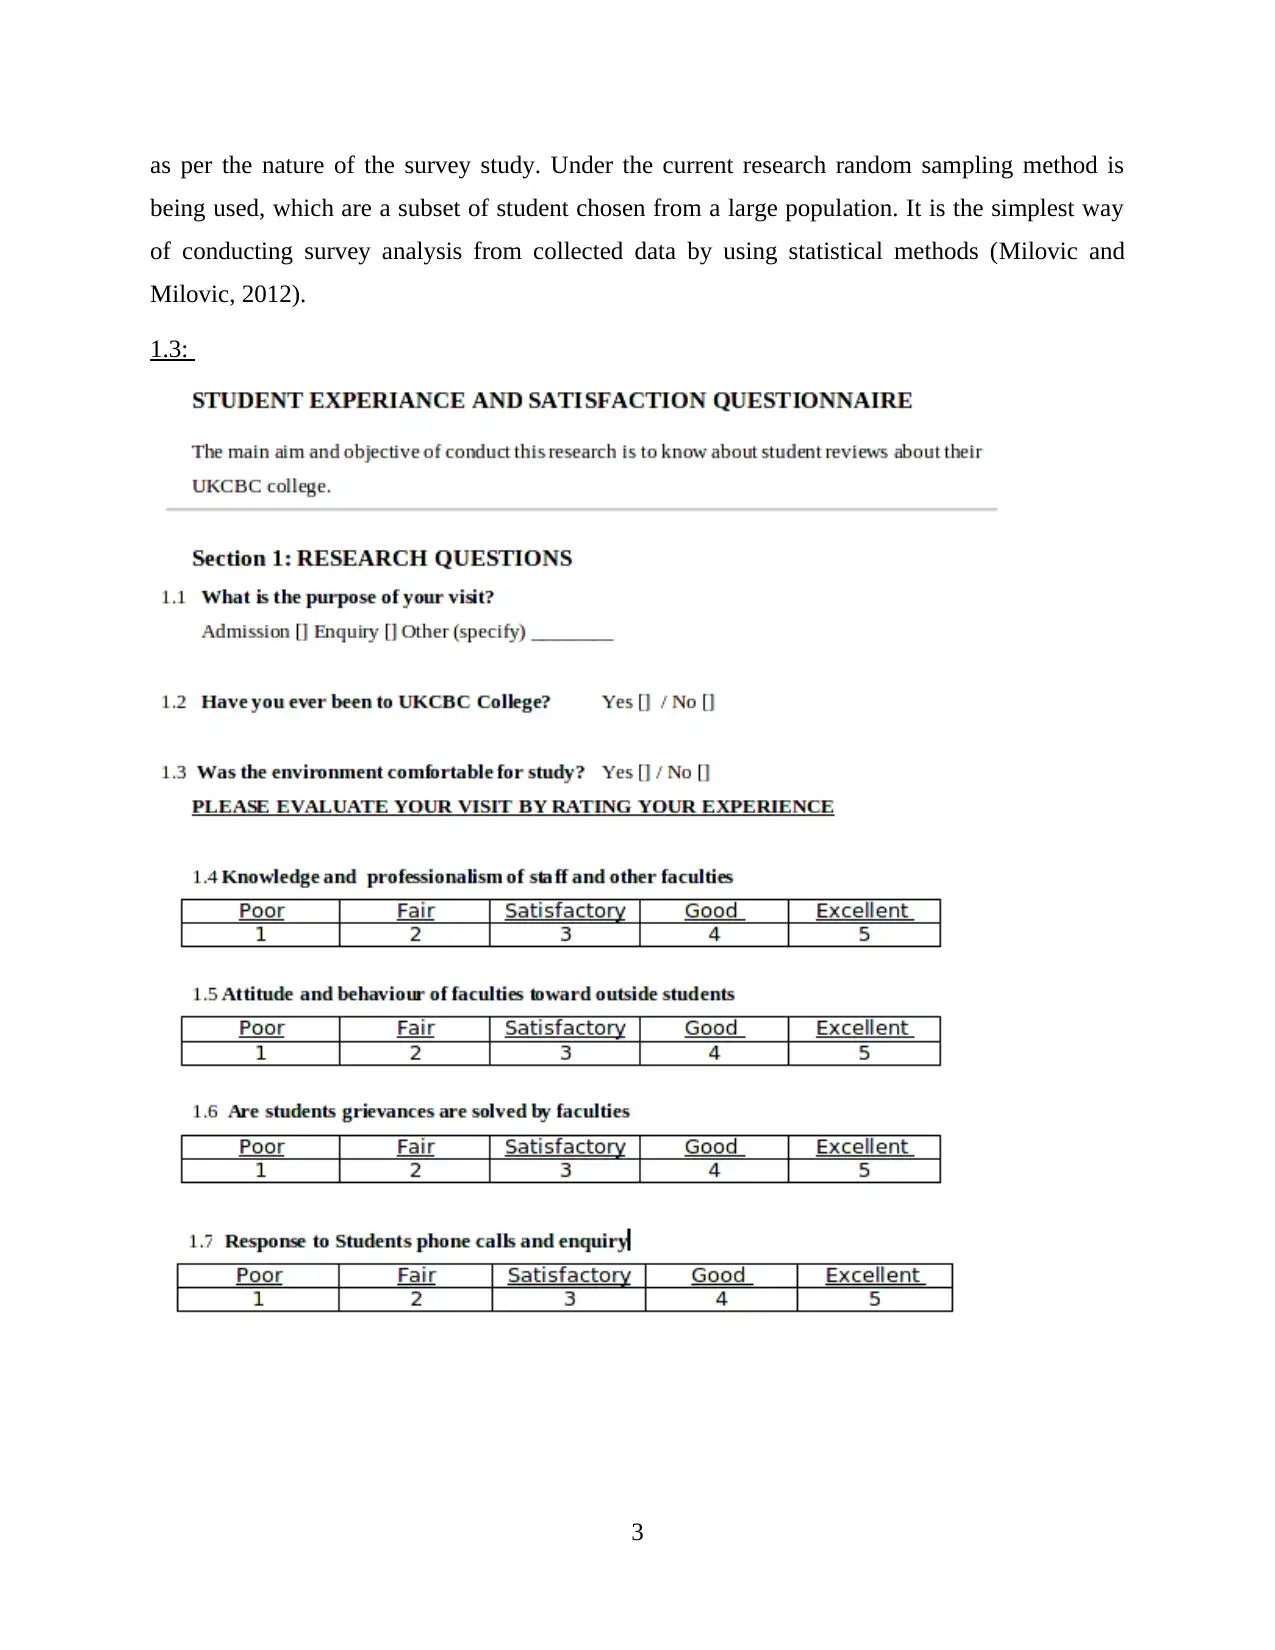
as per the nature of the survey study. Under the current research random sampling method is
being used, which are a subset of student chosen from a large population. It is the simplest way
of conducting survey analysis from collected data by using statistical methods (Milovic and
Milovic, 2012).
1.3:
3
being used, which are a subset of student chosen from a large population. It is the simplest way
of conducting survey analysis from collected data by using statistical methods (Milovic and
Milovic, 2012).
1.3:
3
4
TASK 2
2.1:
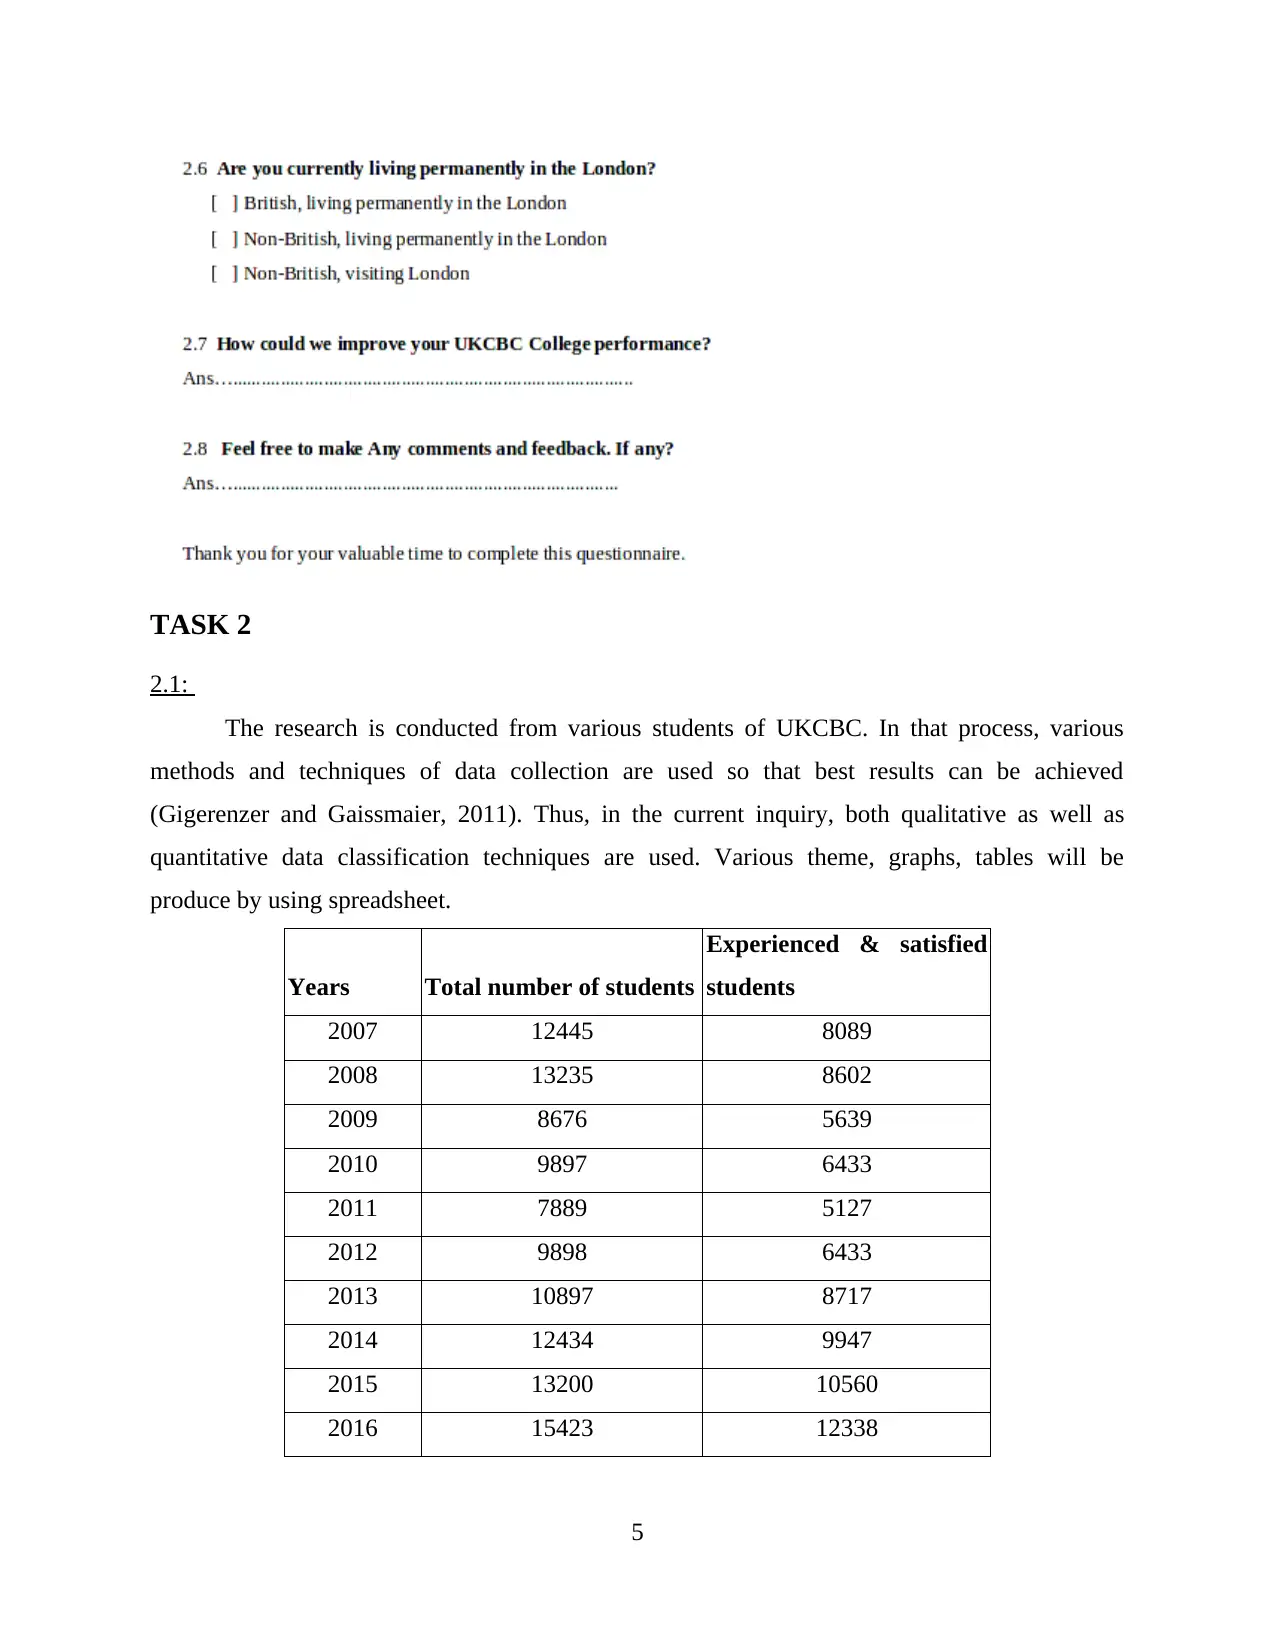
The research is conducted from various students of UKCBC. In that process, various
methods and techniques of data collection are used so that best results can be achieved
(Gigerenzer and Gaissmaier, 2011). Thus, in the current inquiry, both qualitative as well as
quantitative data classification techniques are used. Various theme, graphs, tables will be
produce by using spreadsheet.
Years Total number of students
Experienced & satisfied
students
2007 12445 8089
2008 13235 8602
2009 8676 5639
2010 9897 6433
2011 7889 5127
2012 9898 6433
2013 10897 8717
2014 12434 9947
2015 13200 10560
2016 15423 12338
5
2.1:
The research is conducted from various students of UKCBC. In that process, various
methods and techniques of data collection are used so that best results can be achieved
(Gigerenzer and Gaissmaier, 2011). Thus, in the current inquiry, both qualitative as well as
quantitative data classification techniques are used. Various theme, graphs, tables will be
produce by using spreadsheet.
Years Total number of students
Experienced & satisfied
students
2007 12445 8089
2008 13235 8602
2009 8676 5639
2010 9897 6433
2011 7889 5127
2012 9898 6433
2013 10897 8717
2014 12434 9947
2015 13200 10560
2016 15423 12338
5
Paraphrase This Document
Need a fresh take? Get an instant paraphrase of this document with our AI Paraphraser
For Number of student For satisfied
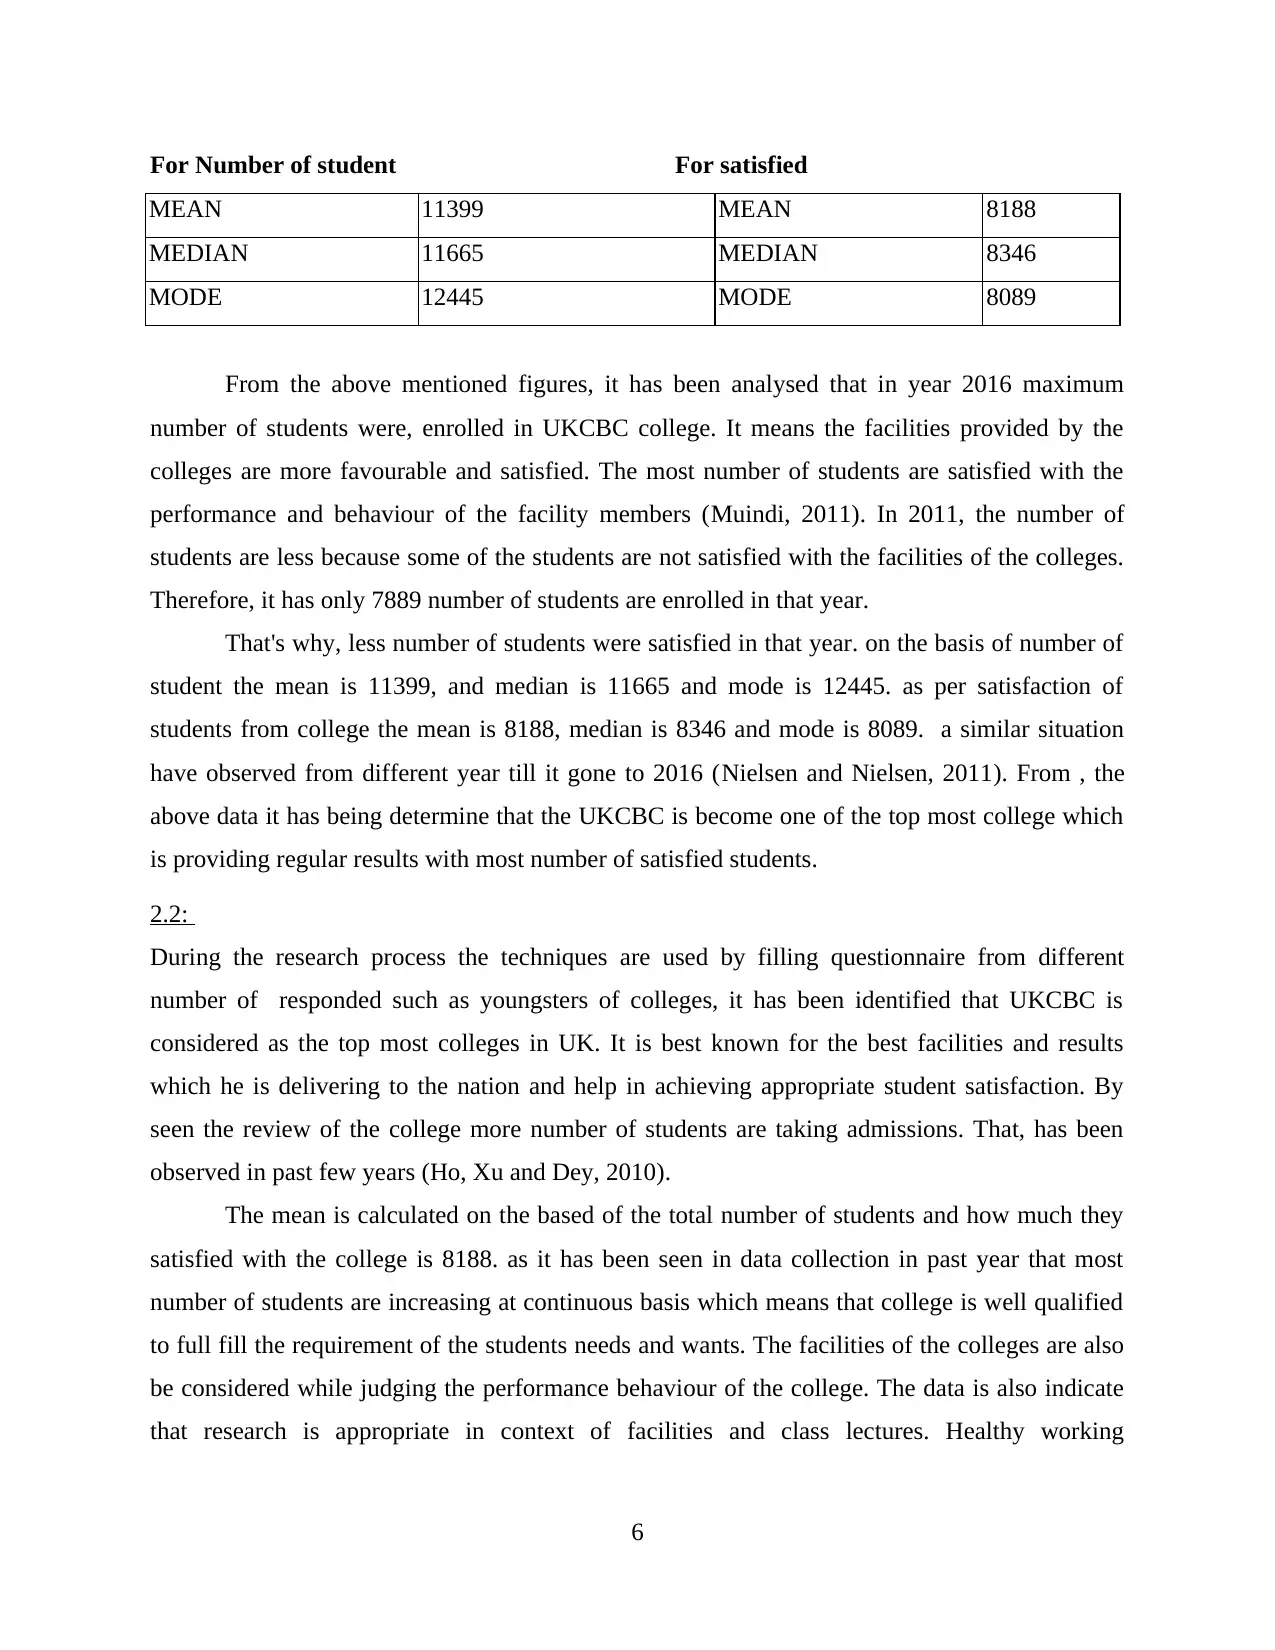
MEAN 11399 MEAN 8188
MEDIAN 11665 MEDIAN 8346
MODE 12445 MODE 8089
From the above mentioned figures, it has been analysed that in year 2016 maximum
number of students were, enrolled in UKCBC college. It means the facilities provided by the
colleges are more favourable and satisfied. The most number of students are satisfied with the
performance and behaviour of the facility members (Muindi, 2011). In 2011, the number of
students are less because some of the students are not satisfied with the facilities of the colleges.
Therefore, it has only 7889 number of students are enrolled in that year.
That's why, less number of students were satisfied in that year. on the basis of number of
student the mean is 11399, and median is 11665 and mode is 12445. as per satisfaction of
students from college the mean is 8188, median is 8346 and mode is 8089. a similar situation
have observed from different year till it gone to 2016 (Nielsen and Nielsen, 2011). From , the
above data it has being determine that the UKCBC is become one of the top most college which
is providing regular results with most number of satisfied students.
2.2:
During the research process the techniques are used by filling questionnaire from different
number of responded such as youngsters of colleges, it has been identified that UKCBC is
considered as the top most colleges in UK. It is best known for the best facilities and results
which he is delivering to the nation and help in achieving appropriate student satisfaction. By
seen the review of the college more number of students are taking admissions. That, has been
observed in past few years (Ho, Xu and Dey, 2010).
The mean is calculated on the based of the total number of students and how much they
satisfied with the college is 8188. as it has been seen in data collection in past year that most
number of students are increasing at continuous basis which means that college is well qualified
to full fill the requirement of the students needs and wants. The facilities of the colleges are also
be considered while judging the performance behaviour of the college. The data is also indicate
that research is appropriate in context of facilities and class lectures. Healthy working
6
environment has to be provided to the most number of individual to perform various task and
activities.
The logical capabilities are identified that the greatest educational institution which is presenting
healthy results in past years are free from any problems. However, these all must create value to
the colleges by utilizing forming the appropriate decision regarding development and growth of
the colleges. With the available learning experiences, the staff and faculties of the colleges must
help the others to enhance the skills and knowledges of the students.
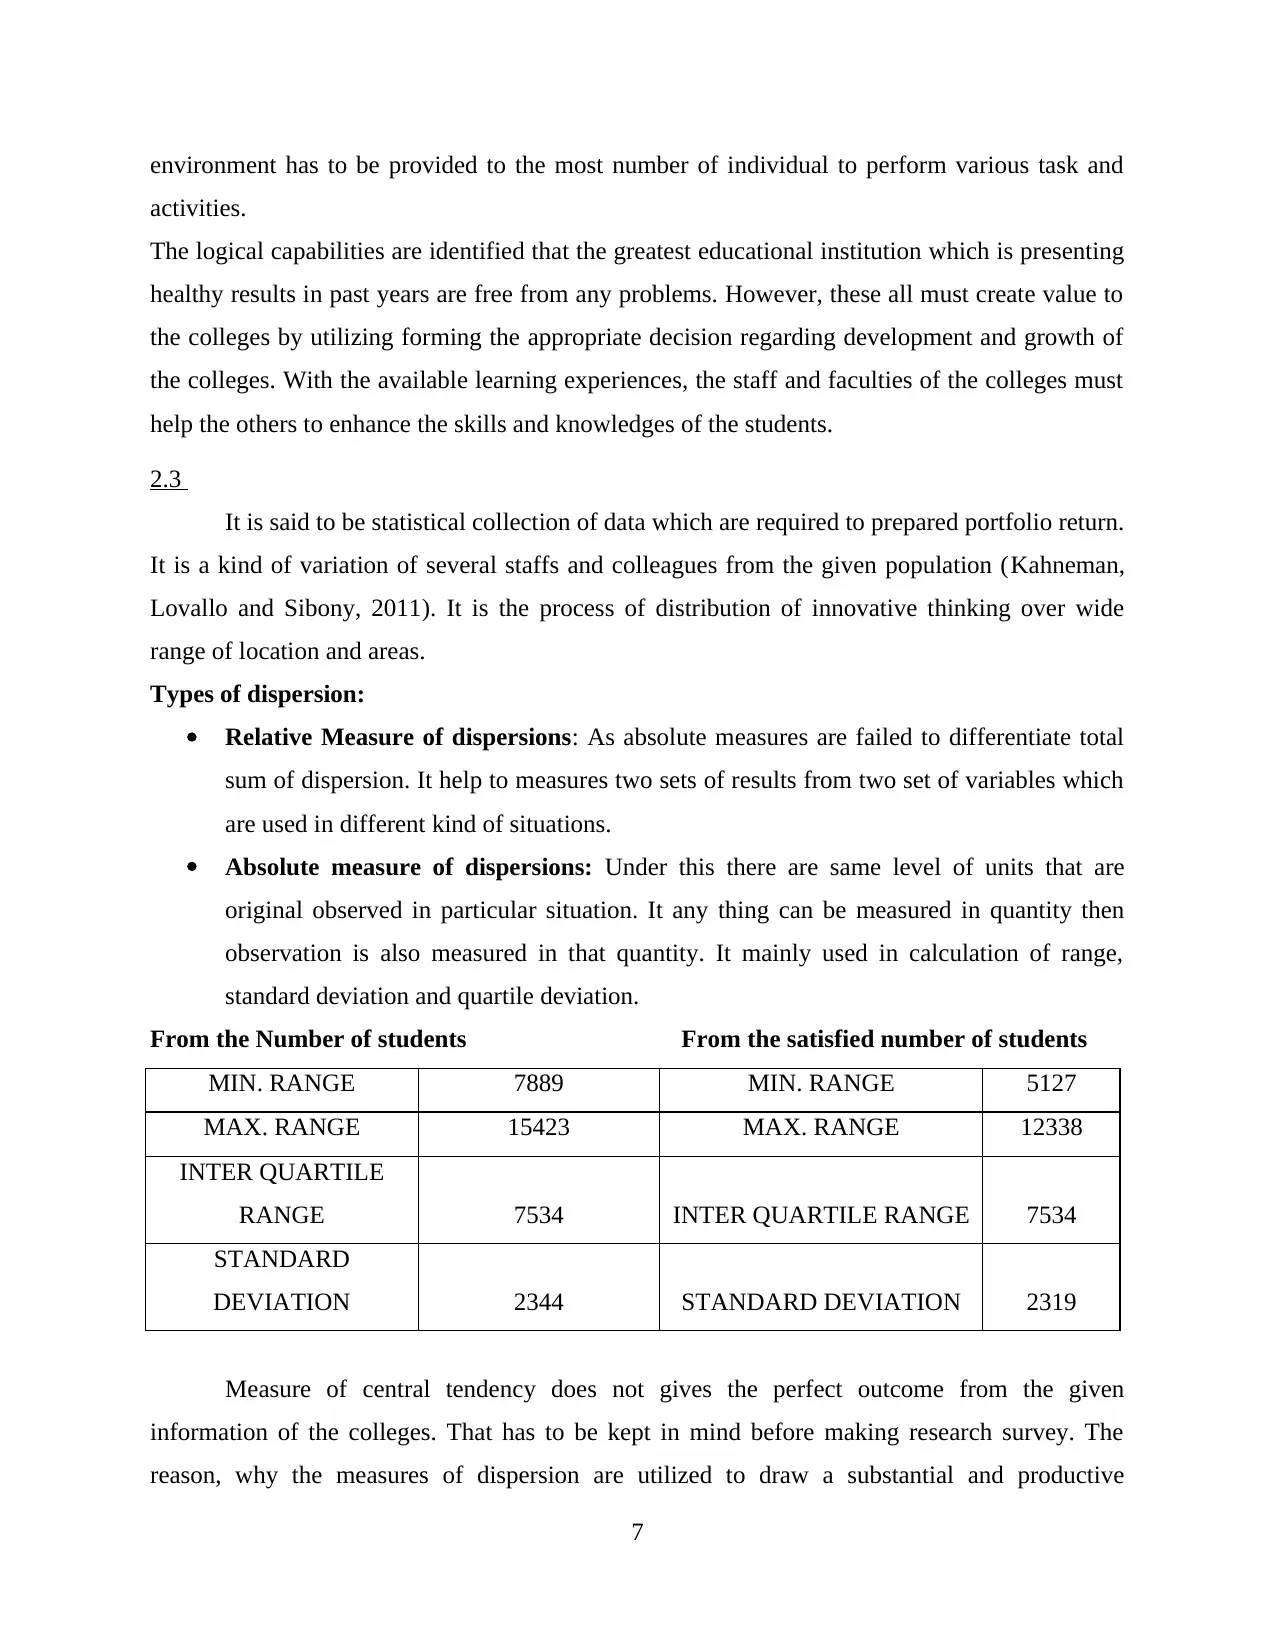
2.3
It is said to be statistical collection of data which are required to prepared portfolio return.
It is a kind of variation of several staffs and colleagues from the given population (Kahneman,
Lovallo and Sibony, 2011). It is the process of distribution of innovative thinking over wide
range of location and areas.
Types of dispersion:
Relative Measure of dispersions: As absolute measures are failed to differentiate total
sum of dispersion. It help to measures two sets of results from two set of variables which
are used in different kind of situations.
Absolute measure of dispersions: Under this there are same level of units that are
original observed in particular situation. It any thing can be measured in quantity then
observation is also measured in that quantity. It mainly used in calculation of range,
standard deviation and quartile deviation.
From the Number of students From the satisfied number of students
MIN. RANGE 7889 MIN. RANGE 5127
MAX. RANGE 15423 MAX. RANGE 12338
INTER QUARTILE
RANGE 7534 INTER QUARTILE RANGE 7534
STANDARD
DEVIATION 2344 STANDARD DEVIATION 2319
Measure of central tendency does not gives the perfect outcome from the given
information of the colleges. That has to be kept in mind before making research survey. The
reason, why the measures of dispersion are utilized to draw a substantial and productive
7
activities.
The logical capabilities are identified that the greatest educational institution which is presenting
healthy results in past years are free from any problems. However, these all must create value to
the colleges by utilizing forming the appropriate decision regarding development and growth of
the colleges. With the available learning experiences, the staff and faculties of the colleges must
help the others to enhance the skills and knowledges of the students.
2.3
It is said to be statistical collection of data which are required to prepared portfolio return.
It is a kind of variation of several staffs and colleagues from the given population (Kahneman,
Lovallo and Sibony, 2011). It is the process of distribution of innovative thinking over wide
range of location and areas.
Types of dispersion:
Relative Measure of dispersions: As absolute measures are failed to differentiate total
sum of dispersion. It help to measures two sets of results from two set of variables which
are used in different kind of situations.
Absolute measure of dispersions: Under this there are same level of units that are
original observed in particular situation. It any thing can be measured in quantity then
observation is also measured in that quantity. It mainly used in calculation of range,
standard deviation and quartile deviation.
From the Number of students From the satisfied number of students
MIN. RANGE 7889 MIN. RANGE 5127
MAX. RANGE 15423 MAX. RANGE 12338
INTER QUARTILE
RANGE 7534 INTER QUARTILE RANGE 7534
STANDARD
DEVIATION 2344 STANDARD DEVIATION 2319
Measure of central tendency does not gives the perfect outcome from the given
information of the colleges. That has to be kept in mind before making research survey. The
reason, why the measures of dispersion are utilized to draw a substantial and productive
7
conclusion (Li, 2010). Under the given slandered deviation which is derived from total number
of students are 2344. It is higher then satisfied number of students those are2319. The coefficient
and co relation is 0.9426 which under control of ranges. It can be manageable by the college, as
in development and growth of college.
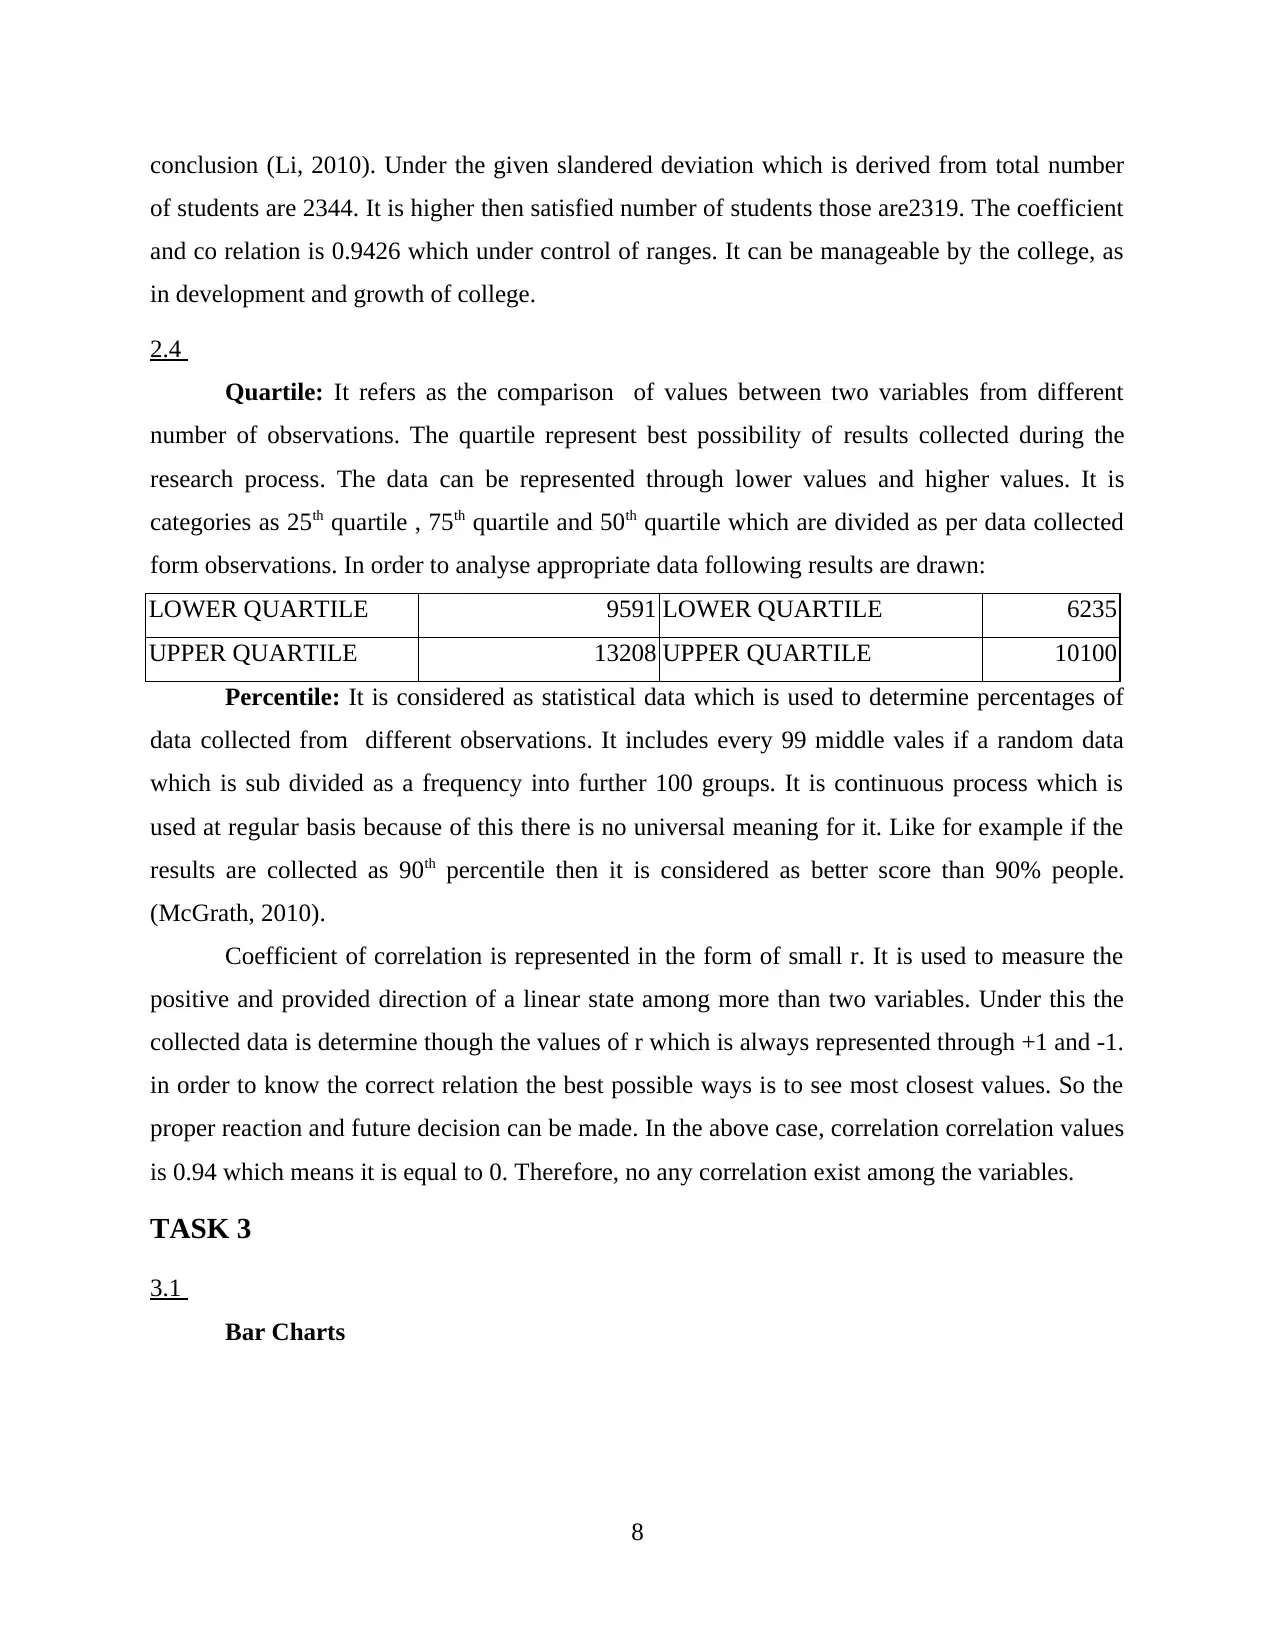
2.4
Quartile: It refers as the comparison of values between two variables from different
number of observations. The quartile represent best possibility of results collected during the
research process. The data can be represented through lower values and higher values. It is
categories as 25th quartile , 75th quartile and 50th quartile which are divided as per data collected
form observations. In order to analyse appropriate data following results are drawn:
LOWER QUARTILE 9591 LOWER QUARTILE 6235
UPPER QUARTILE 13208 UPPER QUARTILE 10100
Percentile: It is considered as statistical data which is used to determine percentages of
data collected from different observations. It includes every 99 middle vales if a random data
which is sub divided as a frequency into further 100 groups. It is continuous process which is
used at regular basis because of this there is no universal meaning for it. Like for example if the
results are collected as 90th percentile then it is considered as better score than 90% people.
(McGrath, 2010).
Coefficient of correlation is represented in the form of small r. It is used to measure the
positive and provided direction of a linear state among more than two variables. Under this the
collected data is determine though the values of r which is always represented through +1 and -1.
in order to know the correct relation the best possible ways is to see most closest values. So the
proper reaction and future decision can be made. In the above case, correlation correlation values
is 0.94 which means it is equal to 0. Therefore, no any correlation exist among the variables.
TASK 3
3.1
Bar Charts
8
of students are 2344. It is higher then satisfied number of students those are2319. The coefficient
and co relation is 0.9426 which under control of ranges. It can be manageable by the college, as
in development and growth of college.
2.4
Quartile: It refers as the comparison of values between two variables from different
number of observations. The quartile represent best possibility of results collected during the
research process. The data can be represented through lower values and higher values. It is
categories as 25th quartile , 75th quartile and 50th quartile which are divided as per data collected
form observations. In order to analyse appropriate data following results are drawn:
LOWER QUARTILE 9591 LOWER QUARTILE 6235
UPPER QUARTILE 13208 UPPER QUARTILE 10100
Percentile: It is considered as statistical data which is used to determine percentages of
data collected from different observations. It includes every 99 middle vales if a random data
which is sub divided as a frequency into further 100 groups. It is continuous process which is
used at regular basis because of this there is no universal meaning for it. Like for example if the
results are collected as 90th percentile then it is considered as better score than 90% people.
(McGrath, 2010).
Coefficient of correlation is represented in the form of small r. It is used to measure the
positive and provided direction of a linear state among more than two variables. Under this the
collected data is determine though the values of r which is always represented through +1 and -1.
in order to know the correct relation the best possible ways is to see most closest values. So the
proper reaction and future decision can be made. In the above case, correlation correlation values
is 0.94 which means it is equal to 0. Therefore, no any correlation exist among the variables.
TASK 3
3.1
Bar Charts
8
Secure Best Marks with AI Grader
Need help grading? Try our AI Grader for instant feedback on your assignments.
1
2
3
4
5
6
7
8
9
10
0 2000 4000 6000 8000 1000012000140001600018000
Experienced&satisfied
students
Total number of students
Years
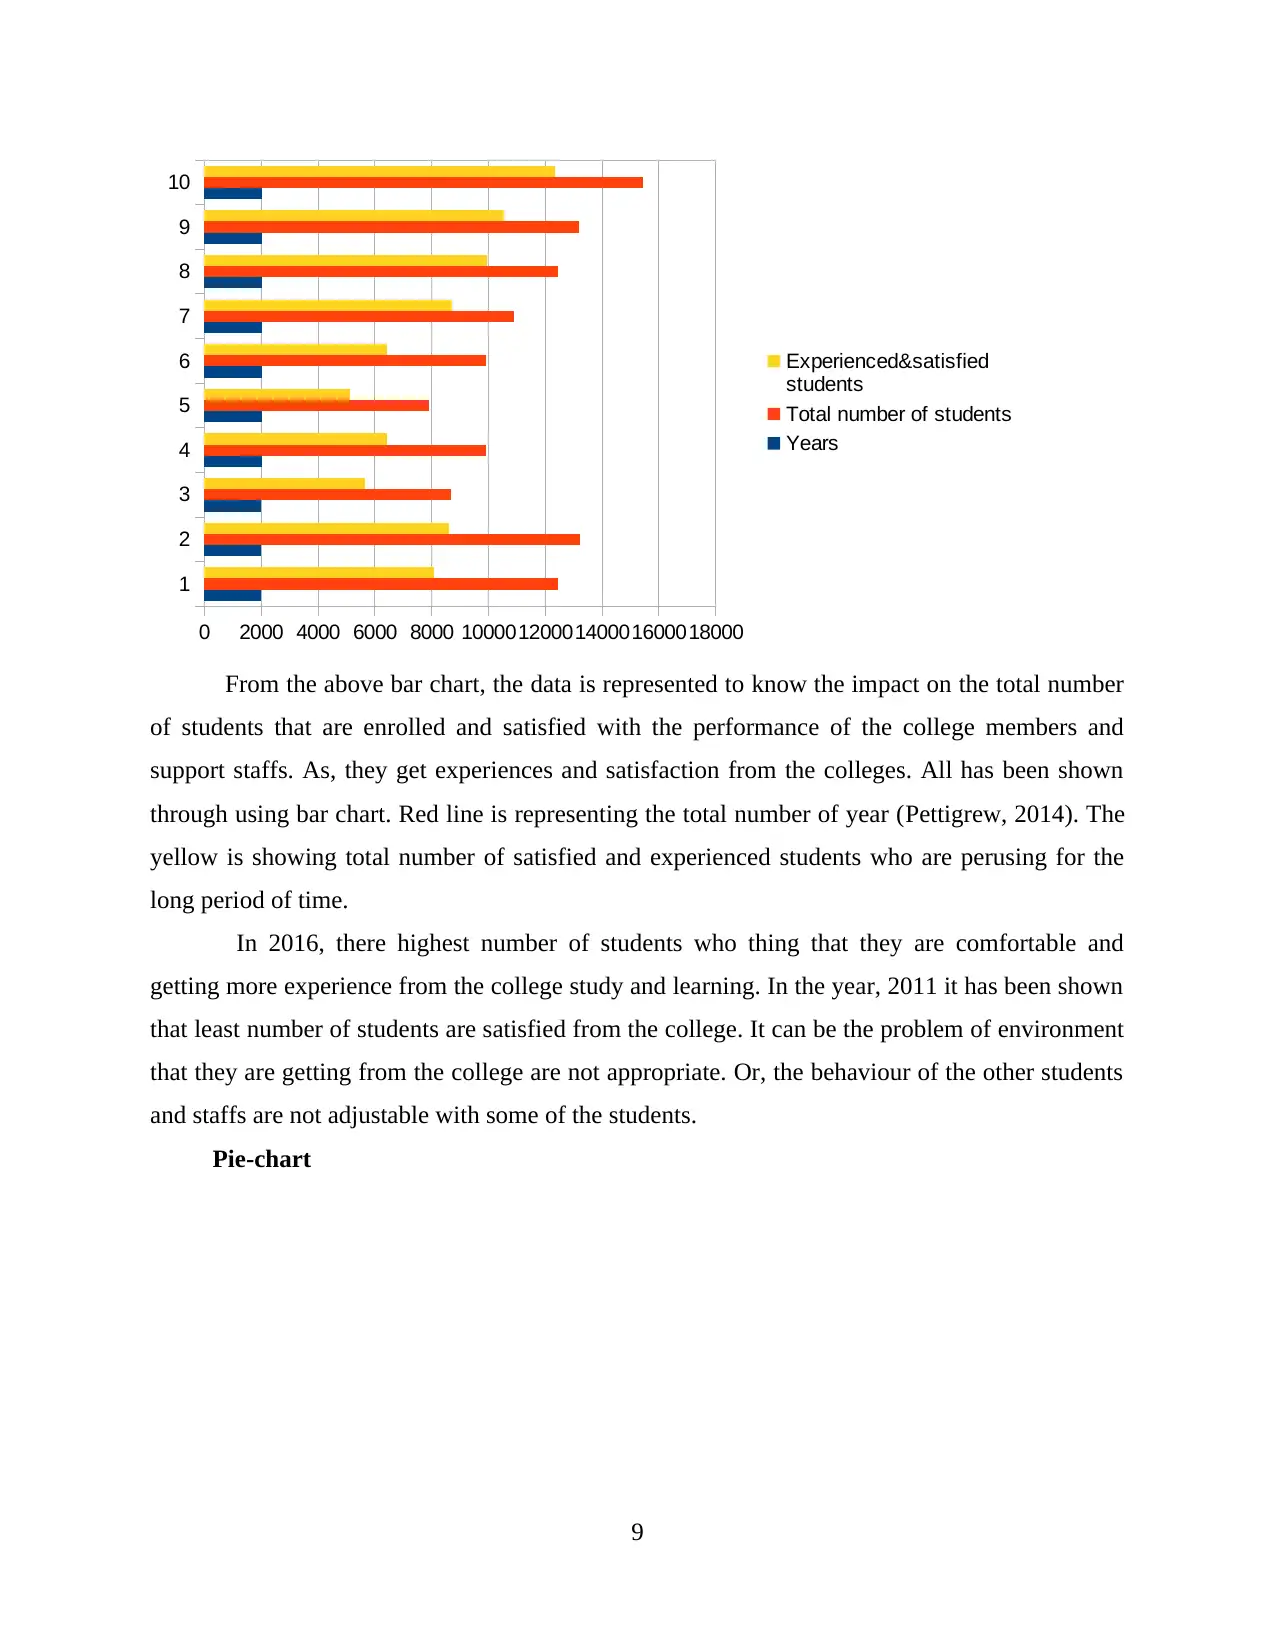
From the above bar chart, the data is represented to know the impact on the total number
of students that are enrolled and satisfied with the performance of the college members and
support staffs. As, they get experiences and satisfaction from the colleges. All has been shown
through using bar chart. Red line is representing the total number of year (Pettigrew, 2014). The
yellow is showing total number of satisfied and experienced students who are perusing for the
long period of time.
In 2016, there highest number of students who thing that they are comfortable and
getting more experience from the college study and learning. In the year, 2011 it has been shown
that least number of students are satisfied from the college. It can be the problem of environment
that they are getting from the college are not appropriate. Or, the behaviour of the other students
and staffs are not adjustable with some of the students.
Pie-chart
9
2
3
4
5
6
7
8
9
10
0 2000 4000 6000 8000 1000012000140001600018000
Experienced&satisfied
students
Total number of students
Years
From the above bar chart, the data is represented to know the impact on the total number
of students that are enrolled and satisfied with the performance of the college members and
support staffs. As, they get experiences and satisfaction from the colleges. All has been shown
through using bar chart. Red line is representing the total number of year (Pettigrew, 2014). The
yellow is showing total number of satisfied and experienced students who are perusing for the
long period of time.
In 2016, there highest number of students who thing that they are comfortable and
getting more experience from the college study and learning. In the year, 2011 it has been shown
that least number of students are satisfied from the college. It can be the problem of environment
that they are getting from the college are not appropriate. Or, the behaviour of the other students
and staffs are not adjustable with some of the students.
Pie-chart
9
2007
2008
2009
2010
2011 2012
2013
2014
2015
2016
1
2
3
4
5
6
7
8
9
10
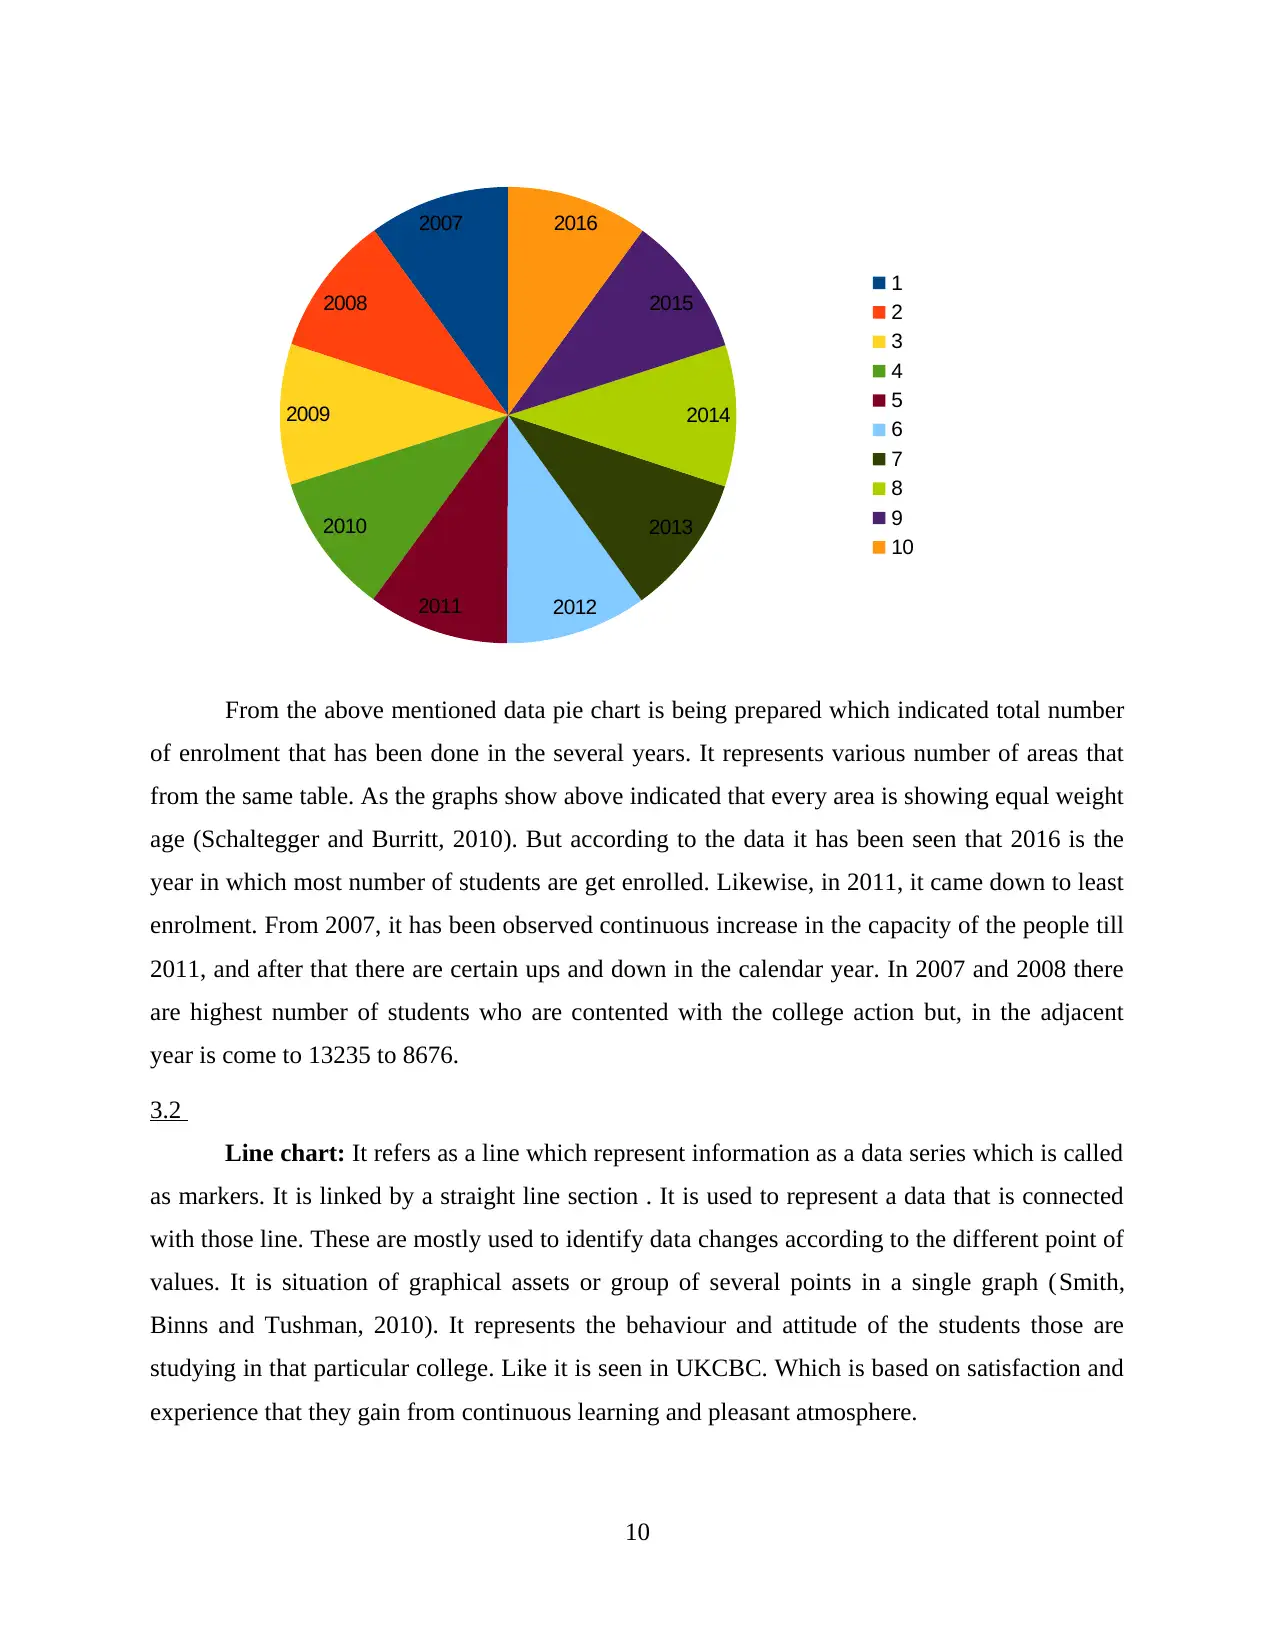
From the above mentioned data pie chart is being prepared which indicated total number
of enrolment that has been done in the several years. It represents various number of areas that
from the same table. As the graphs show above indicated that every area is showing equal weight
age (Schaltegger and Burritt, 2010). But according to the data it has been seen that 2016 is the
year in which most number of students are get enrolled. Likewise, in 2011, it came down to least
enrolment. From 2007, it has been observed continuous increase in the capacity of the people till
2011, and after that there are certain ups and down in the calendar year. In 2007 and 2008 there
are highest number of students who are contented with the college action but, in the adjacent
year is come to 13235 to 8676.
3.2
Line chart: It refers as a line which represent information as a data series which is called
as markers. It is linked by a straight line section . It is used to represent a data that is connected
with those line. These are mostly used to identify data changes according to the different point of
values. It is situation of graphical assets or group of several points in a single graph (Smith,
Binns and Tushman, 2010). It represents the behaviour and attitude of the students those are
studying in that particular college. Like it is seen in UKCBC. Which is based on satisfaction and
experience that they gain from continuous learning and pleasant atmosphere.
10
2008
2009
2010
2011 2012
2013
2014
2015
2016
1
2
3
4
5
6
7
8
9
10
From the above mentioned data pie chart is being prepared which indicated total number
of enrolment that has been done in the several years. It represents various number of areas that
from the same table. As the graphs show above indicated that every area is showing equal weight
age (Schaltegger and Burritt, 2010). But according to the data it has been seen that 2016 is the
year in which most number of students are get enrolled. Likewise, in 2011, it came down to least
enrolment. From 2007, it has been observed continuous increase in the capacity of the people till
2011, and after that there are certain ups and down in the calendar year. In 2007 and 2008 there
are highest number of students who are contented with the college action but, in the adjacent
year is come to 13235 to 8676.
3.2
Line chart: It refers as a line which represent information as a data series which is called
as markers. It is linked by a straight line section . It is used to represent a data that is connected
with those line. These are mostly used to identify data changes according to the different point of
values. It is situation of graphical assets or group of several points in a single graph (Smith,
Binns and Tushman, 2010). It represents the behaviour and attitude of the students those are
studying in that particular college. Like it is seen in UKCBC. Which is based on satisfaction and
experience that they gain from continuous learning and pleasant atmosphere.
10
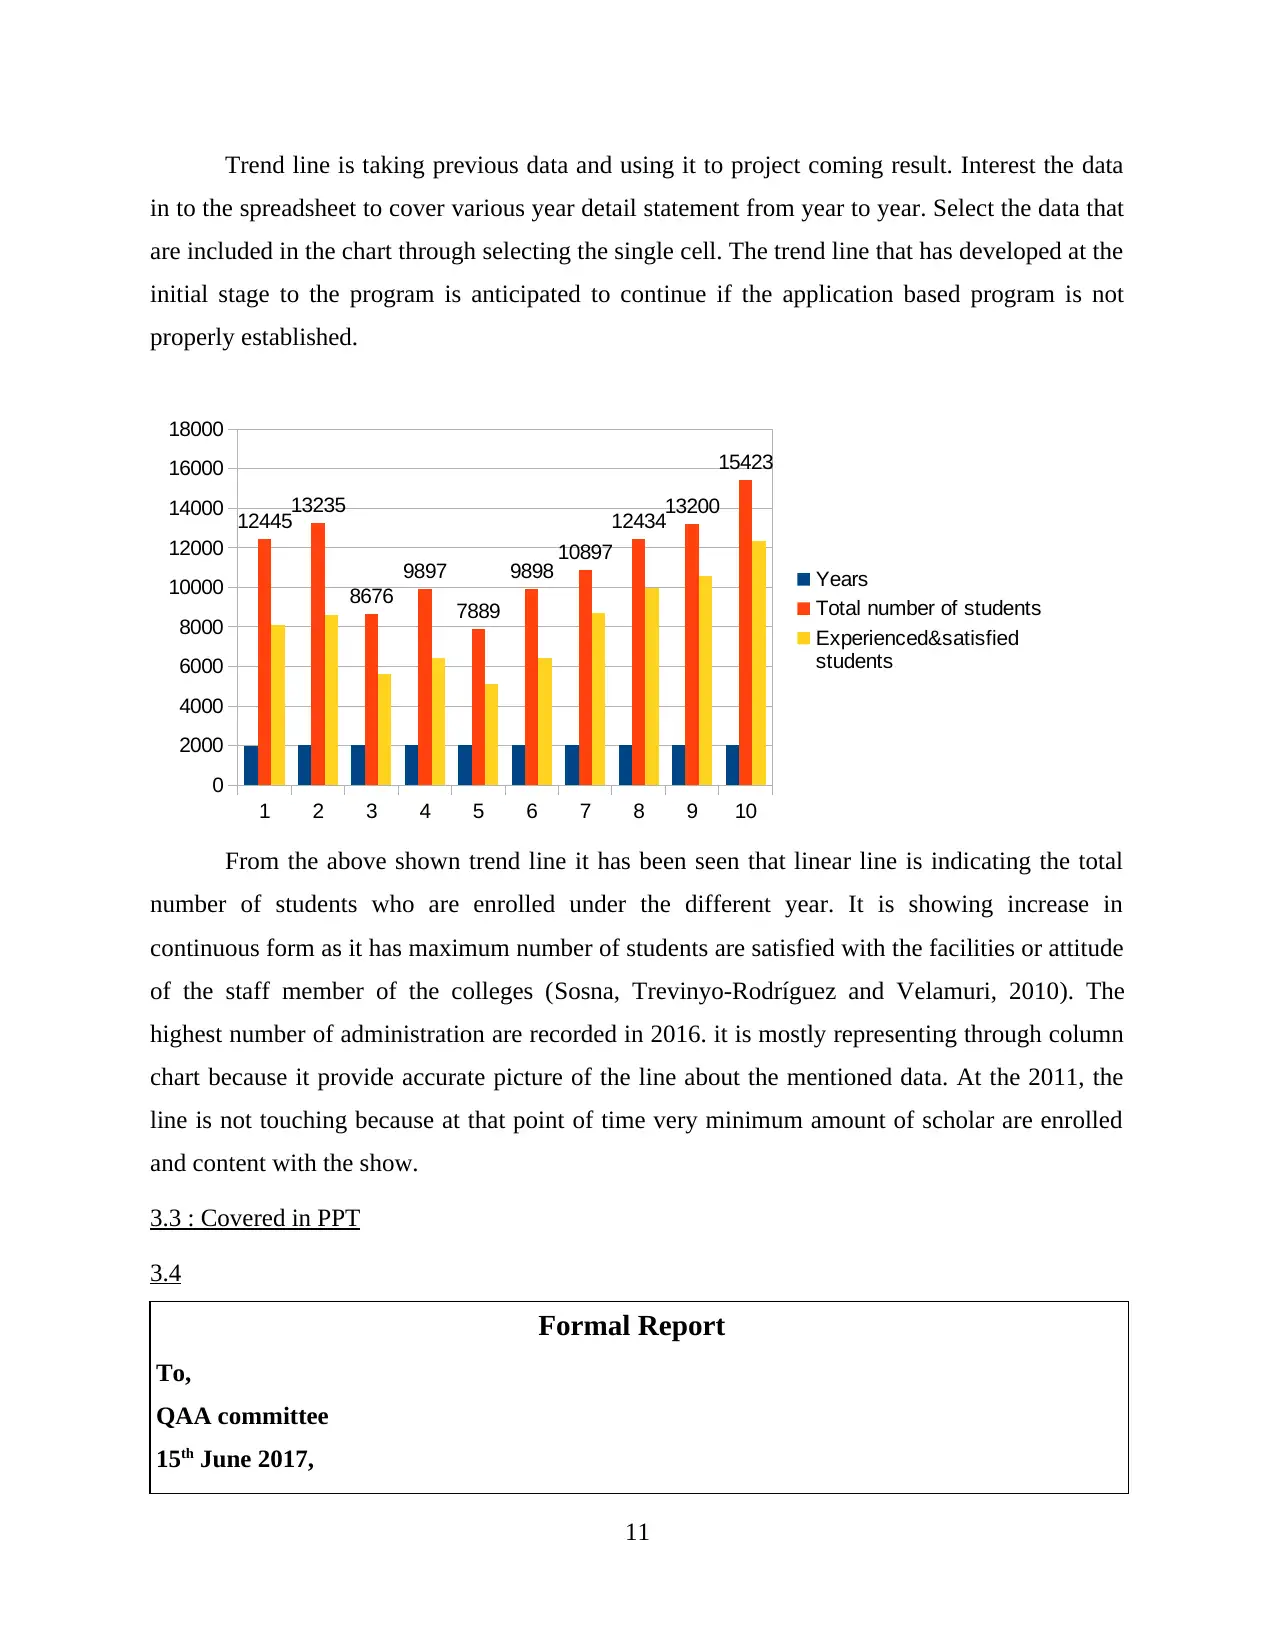
Trend line is taking previous data and using it to project coming result. Interest the data
in to the spreadsheet to cover various year detail statement from year to year. Select the data that
are included in the chart through selecting the single cell. The trend line that has developed at the
initial stage to the program is anticipated to continue if the application based program is not
properly established.
1 2 3 4 5 6 7 8 9 10
0
2000
4000
6000
8000
10000
12000
14000
16000
18000
1244513235
8676
9897
7889
9898 10897
1243413200
15423
Years
Total number of students
Experienced&satisfied
students
From the above shown trend line it has been seen that linear line is indicating the total
number of students who are enrolled under the different year. It is showing increase in
continuous form as it has maximum number of students are satisfied with the facilities or attitude
of the staff member of the colleges (Sosna, Trevinyo-Rodríguez and Velamuri, 2010). The
highest number of administration are recorded in 2016. it is mostly representing through column
chart because it provide accurate picture of the line about the mentioned data. At the 2011, the
line is not touching because at that point of time very minimum amount of scholar are enrolled
and content with the show.
3.3 : Covered in PPT
3.4
Formal Report
To,
QAA committee
15th June 2017,
11
Paraphrase This Document
Need a fresh take? Get an instant paraphrase of this document with our AI Paraphraser
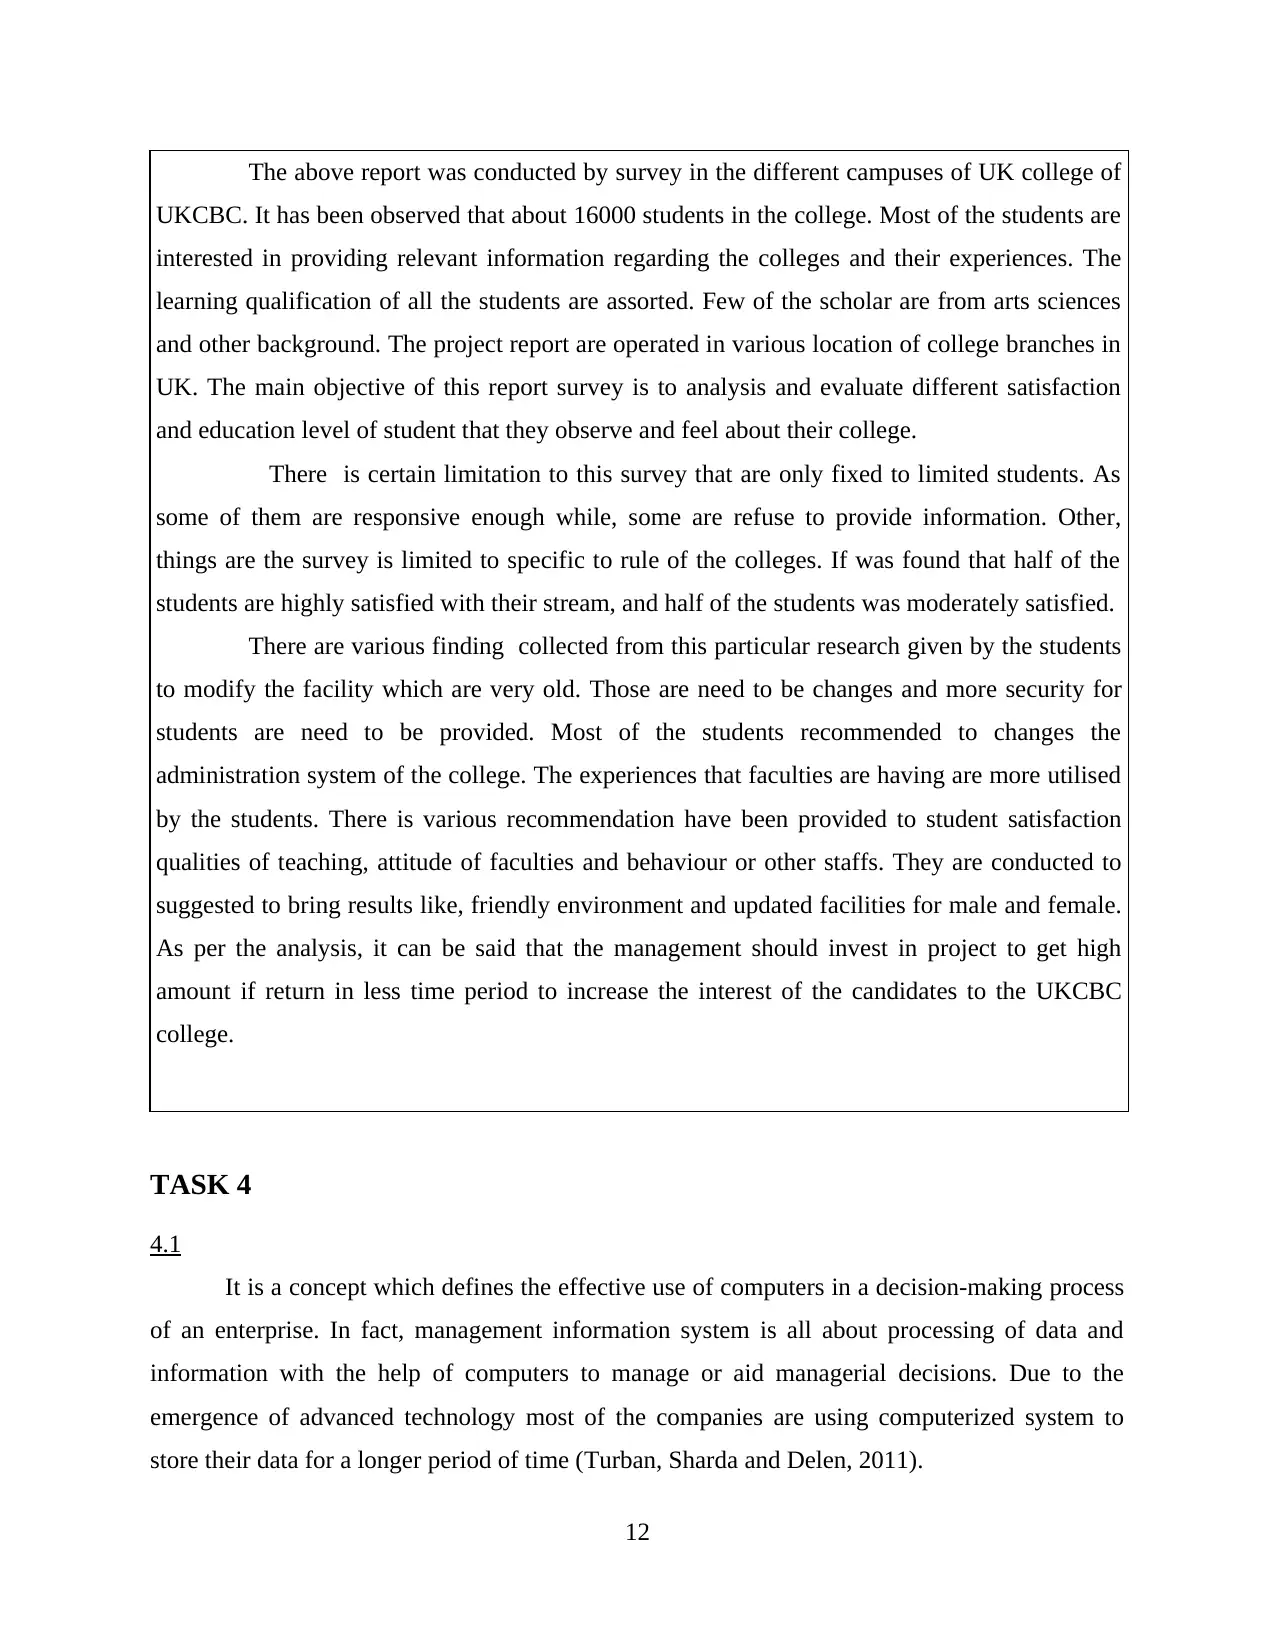
The above report was conducted by survey in the different campuses of UK college of
UKCBC. It has been observed that about 16000 students in the college. Most of the students are
interested in providing relevant information regarding the colleges and their experiences. The
learning qualification of all the students are assorted. Few of the scholar are from arts sciences
and other background. The project report are operated in various location of college branches in
UK. The main objective of this report survey is to analysis and evaluate different satisfaction
and education level of student that they observe and feel about their college.
There is certain limitation to this survey that are only fixed to limited students. As
some of them are responsive enough while, some are refuse to provide information. Other,
things are the survey is limited to specific to rule of the colleges. If was found that half of the
students are highly satisfied with their stream, and half of the students was moderately satisfied.
There are various finding collected from this particular research given by the students
to modify the facility which are very old. Those are need to be changes and more security for
students are need to be provided. Most of the students recommended to changes the
administration system of the college. The experiences that faculties are having are more utilised
by the students. There is various recommendation have been provided to student satisfaction
qualities of teaching, attitude of faculties and behaviour or other staffs. They are conducted to
suggested to bring results like, friendly environment and updated facilities for male and female.
As per the analysis, it can be said that the management should invest in project to get high
amount if return in less time period to increase the interest of the candidates to the UKCBC
college.
TASK 4
4.1
It is a concept which defines the effective use of computers in a decision-making process
of an enterprise. In fact, management information system is all about processing of data and
information with the help of computers to manage or aid managerial decisions. Due to the
emergence of advanced technology most of the companies are using computerized system to
store their data for a longer period of time (Turban, Sharda and Delen, 2011).
12
1. Cited enterprise uses computerized techniques in different way such as-
2. Make an effective plan to reduce future errors.
3. Helpful in hedging the risk as well as provide courage to face challenges.
4. Presence of proper record of daily transactions.
5. Helpful in measuring the actual performance of an employees by conducting various
impressive activities.
6. Provides accurate data and evidences which act as a effective tool in decision making
process.
Apart from this a cited organization uses management information system for smooth
running of their business by attaining their objectives in a minimum period of time with the help
of various innovative ideas (Tzeng and Huang, 2011). Therefore it act as a indispensable method
for whole nation to direct their business in a correct path by implementing this effective
technique.
Advantages of MIS-
2. Facilitates planning – During expansion in existing enterprise it requires appropriate
information or data to improve their plan quality with the help of useful planning process
which is very helpful in decision making process.
3. Provides accuracy – Basically to establish a successful business an enterprise need to
acquire accurate results.
4. Relevancy – In fact it also provides relevant data or information which might be very
indispensable during decision making.
5. Speedy – One of the major advantages of MIS is to complete whole work in a minimum
period of time (Vercellis, 2011).
Major role of management information system at different levels.
Strategic level- Accurate information or data is acquired from internal and external
sources and they are very much essential at strategic level because it helps in enhancing
the plan or existing strategy of an enterprise.
Tactical level – According to this level information supports middle level mangers to
allocate whole resources by establishing their control on it.
13
Operational level- Overall business is depend on production department because they are
responsible to design the product by generating innovative or creative ideas.
At last management information system is one of the indispensable method for cited
enterprise because it helps in promoting their products at international level.
4.2
14
responsible to design the product by generating innovative or creative ideas.
At last management information system is one of the indispensable method for cited
enterprise because it helps in promoting their products at international level.
4.2
14
Secure Best Marks with AI Grader
Need help grading? Try our AI Grader for instant feedback on your assignments.
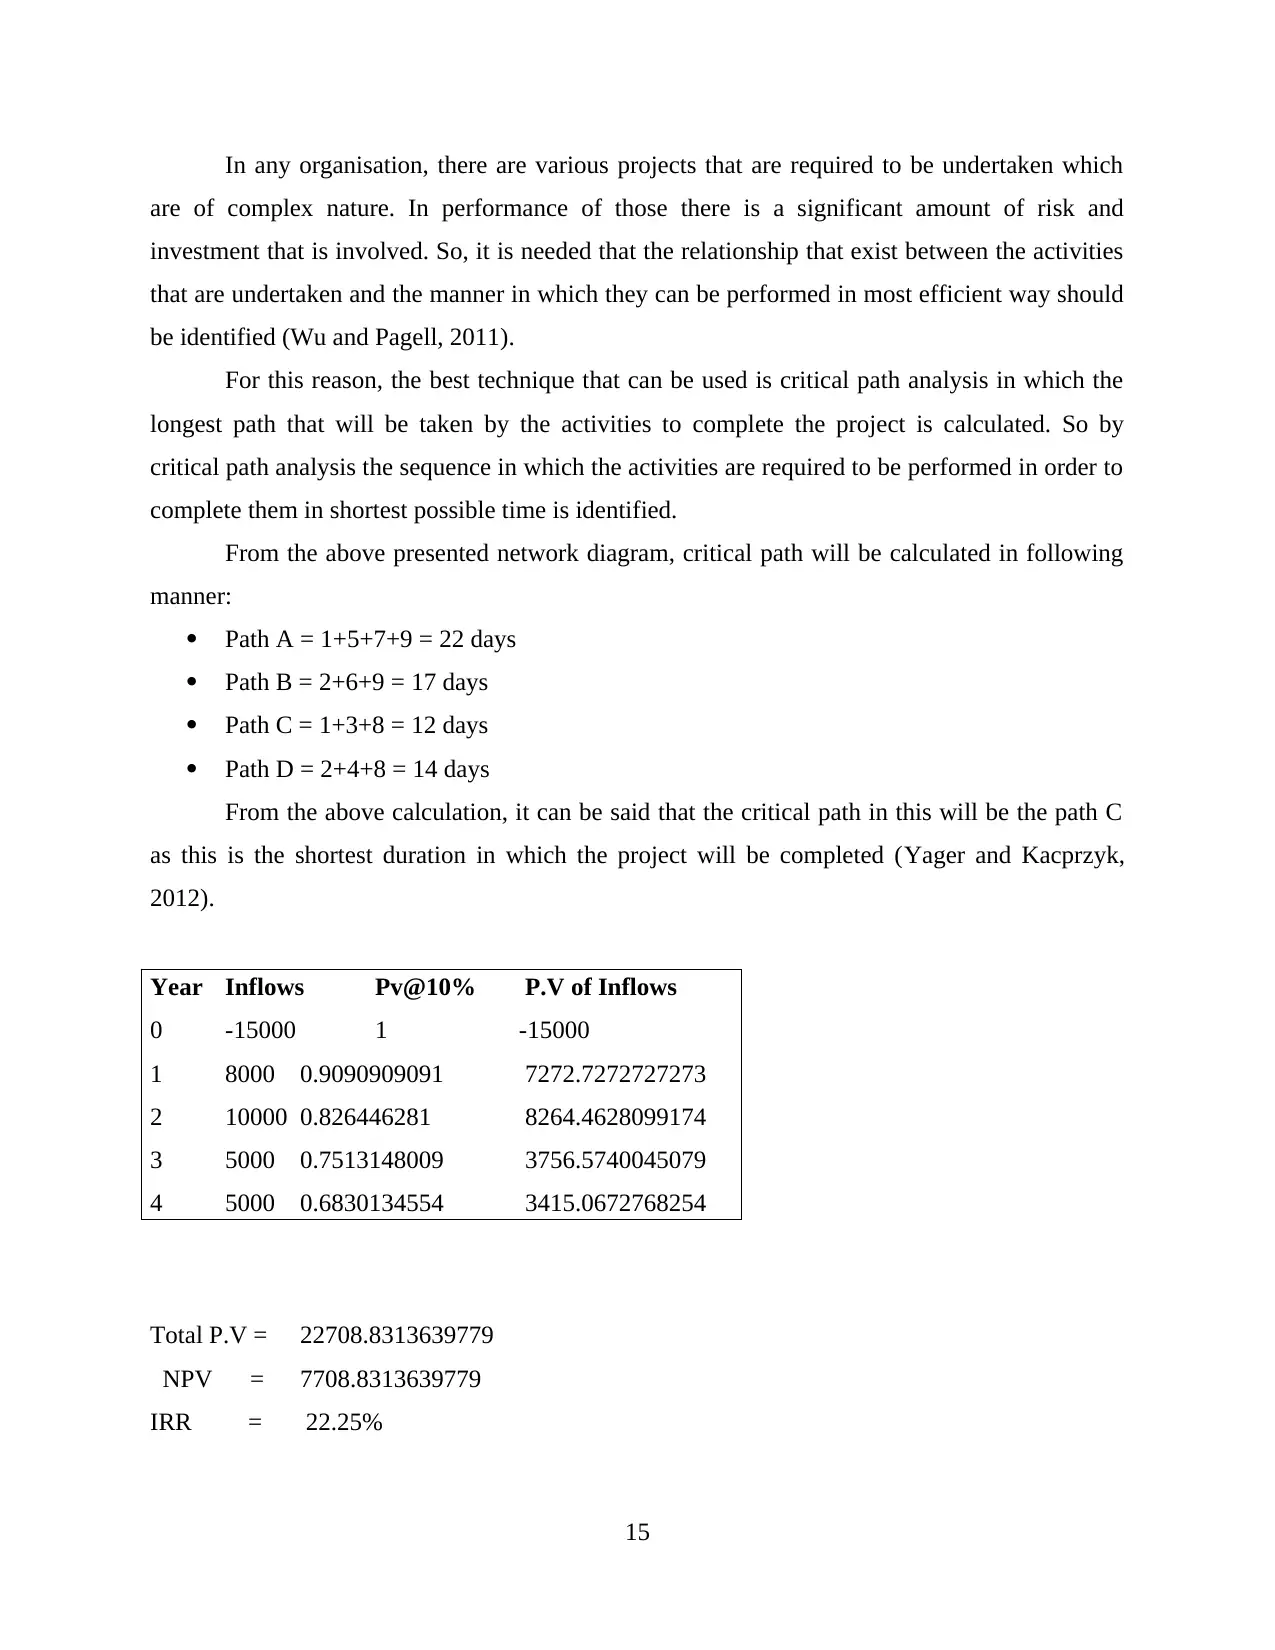
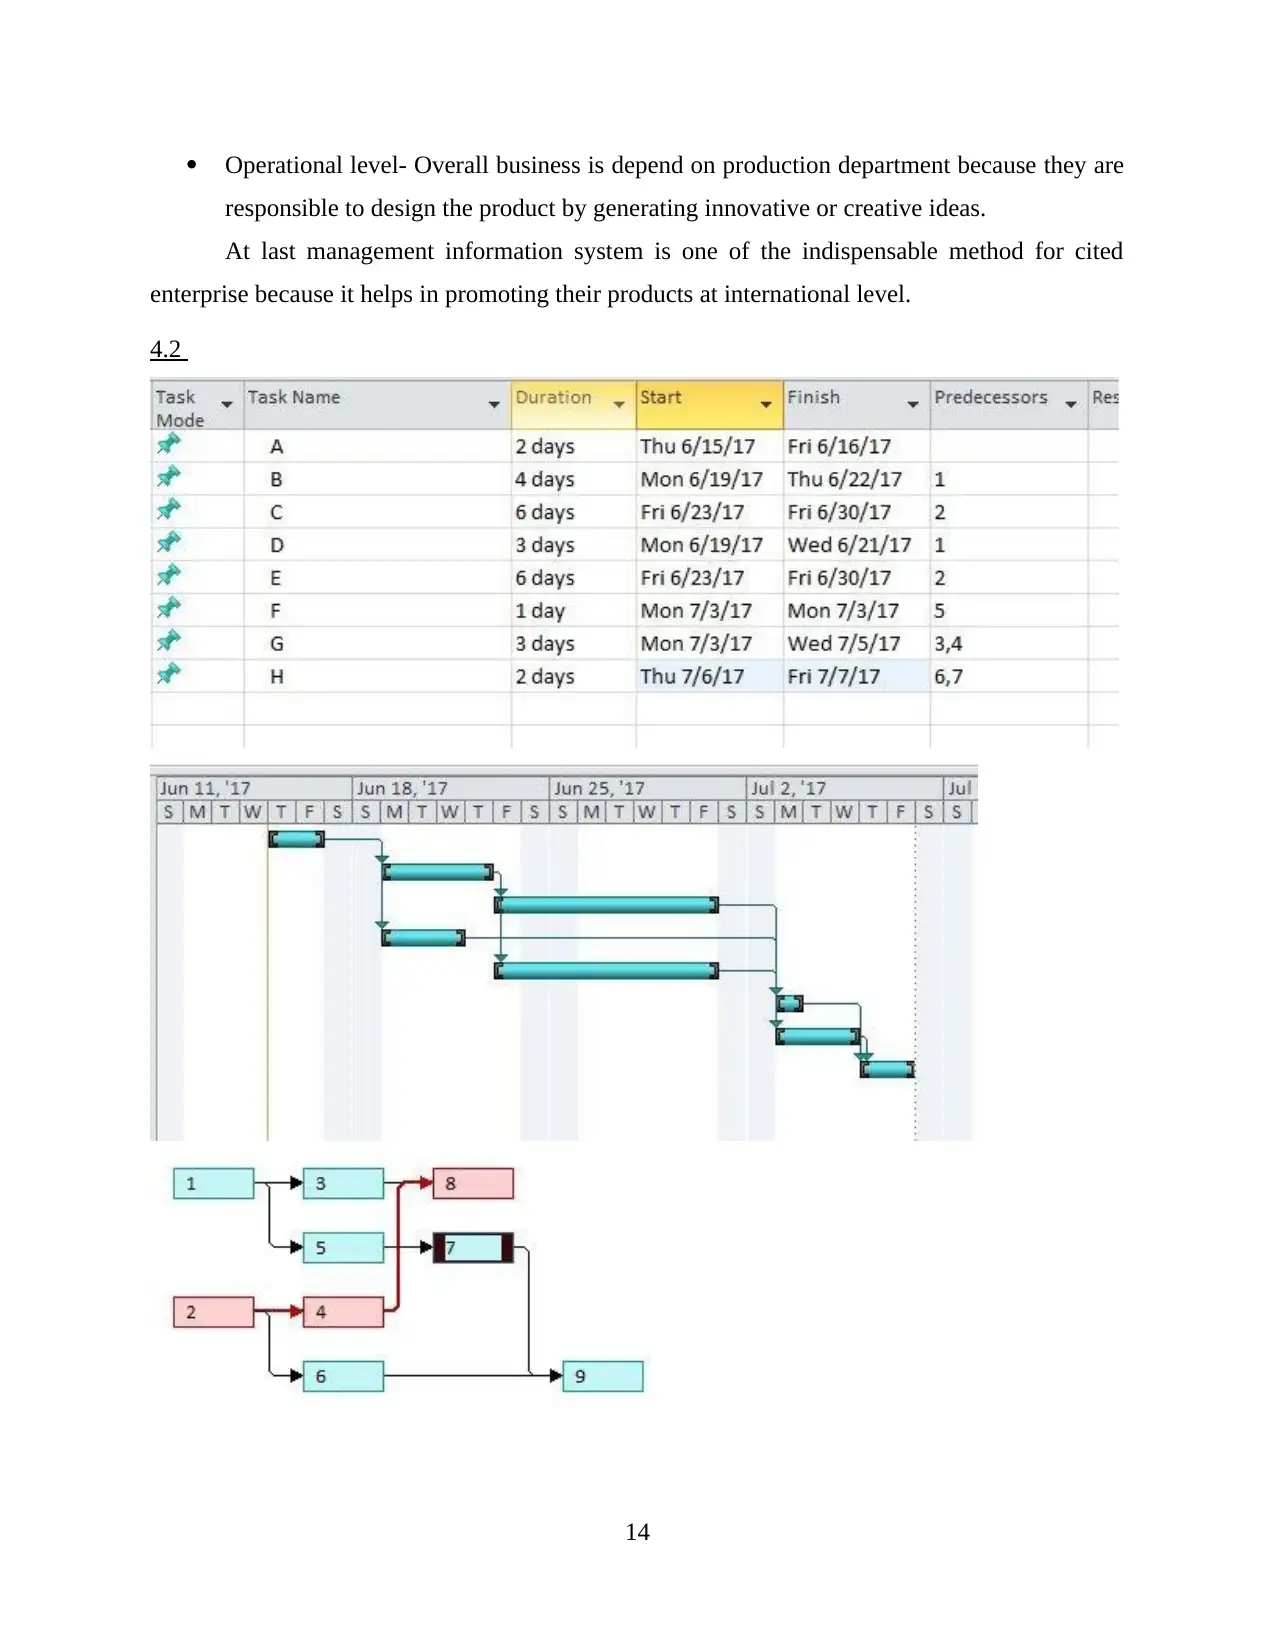
In any organisation, there are various projects that are required to be undertaken which
are of complex nature. In performance of those there is a significant amount of risk and
investment that is involved. So, it is needed that the relationship that exist between the activities
that are undertaken and the manner in which they can be performed in most efficient way should
be identified (Wu and Pagell, 2011).
For this reason, the best technique that can be used is critical path analysis in which the
longest path that will be taken by the activities to complete the project is calculated. So by
critical path analysis the sequence in which the activities are required to be performed in order to
complete them in shortest possible time is identified.
From the above presented network diagram, critical path will be calculated in following
manner:
Path A = 1+5+7+9 = 22 days
Path B = 2+6+9 = 17 days
Path C = 1+3+8 = 12 days
Path D = 2+4+8 = 14 days
From the above calculation, it can be said that the critical path in this will be the path C
as this is the shortest duration in which the project will be completed (Yager and Kacprzyk,
2012).
Year Inflows Pv@10% P.V of Inflows
0 -15000 1 -15000
1 8000 0.9090909091 7272.7272727273
2 10000 0.826446281 8264.4628099174
3 5000 0.7513148009 3756.5740045079
4 5000 0.6830134554 3415.0672768254
Total P.V = 22708.8313639779
NPV = 7708.8313639779
IRR = 22.25%
15
In every organisation there are various decisions that are required to be taken by the
management and it is important that they should be made in a manner which will prove to be
most beneficial to the business (Zikmund and et., al. 2013). For this purpose there are various
financial techniques available that can be used by them and it includes techniques such as
internal rate of return (IRR) and net present value (NPV) which are described below :
Net present value: It is the difference that is calculated between the present value of all
the cash flows that will be arising in the future from and the amount of investment that
has been made and this will be done by using required rate of return for the purpose of
discounting (Cash Flow2017).
Internal rate of return: This is the rate at which the net present value that will be
calculated in respect of any project will be equal to zero. The project will be accepted if
IRR is more than the required rate of return.
From the above mentioned calculation it can be said that the project will be accepted as
NPV that has been calculated is positive which is equal to 7708.83 and also the IRR of the
project is 22.52% which is more than required rate of return so it will be profitable to invest in
this project (Zsambok and Klein, 2014).
CONCLUSION
This report is all about effective use of decision making process with the help of various
useful methods or techniques to achieve their target as soon as possible. In fact to maximize the
profit of an enterprise accurate data and information act as a useful tool by implementing
different methods for example arithmetic mean, median and mode.
UKCBC is one of the famous college popular for its standard as well as quality of
providing knowledge. Apart from this it also describes the use of quartiles, percentiles and
correlation in between multiple variables. At last it also helpful in selecting profitable projects by
conducting analysis of critical path and it supports in decision making process.
16
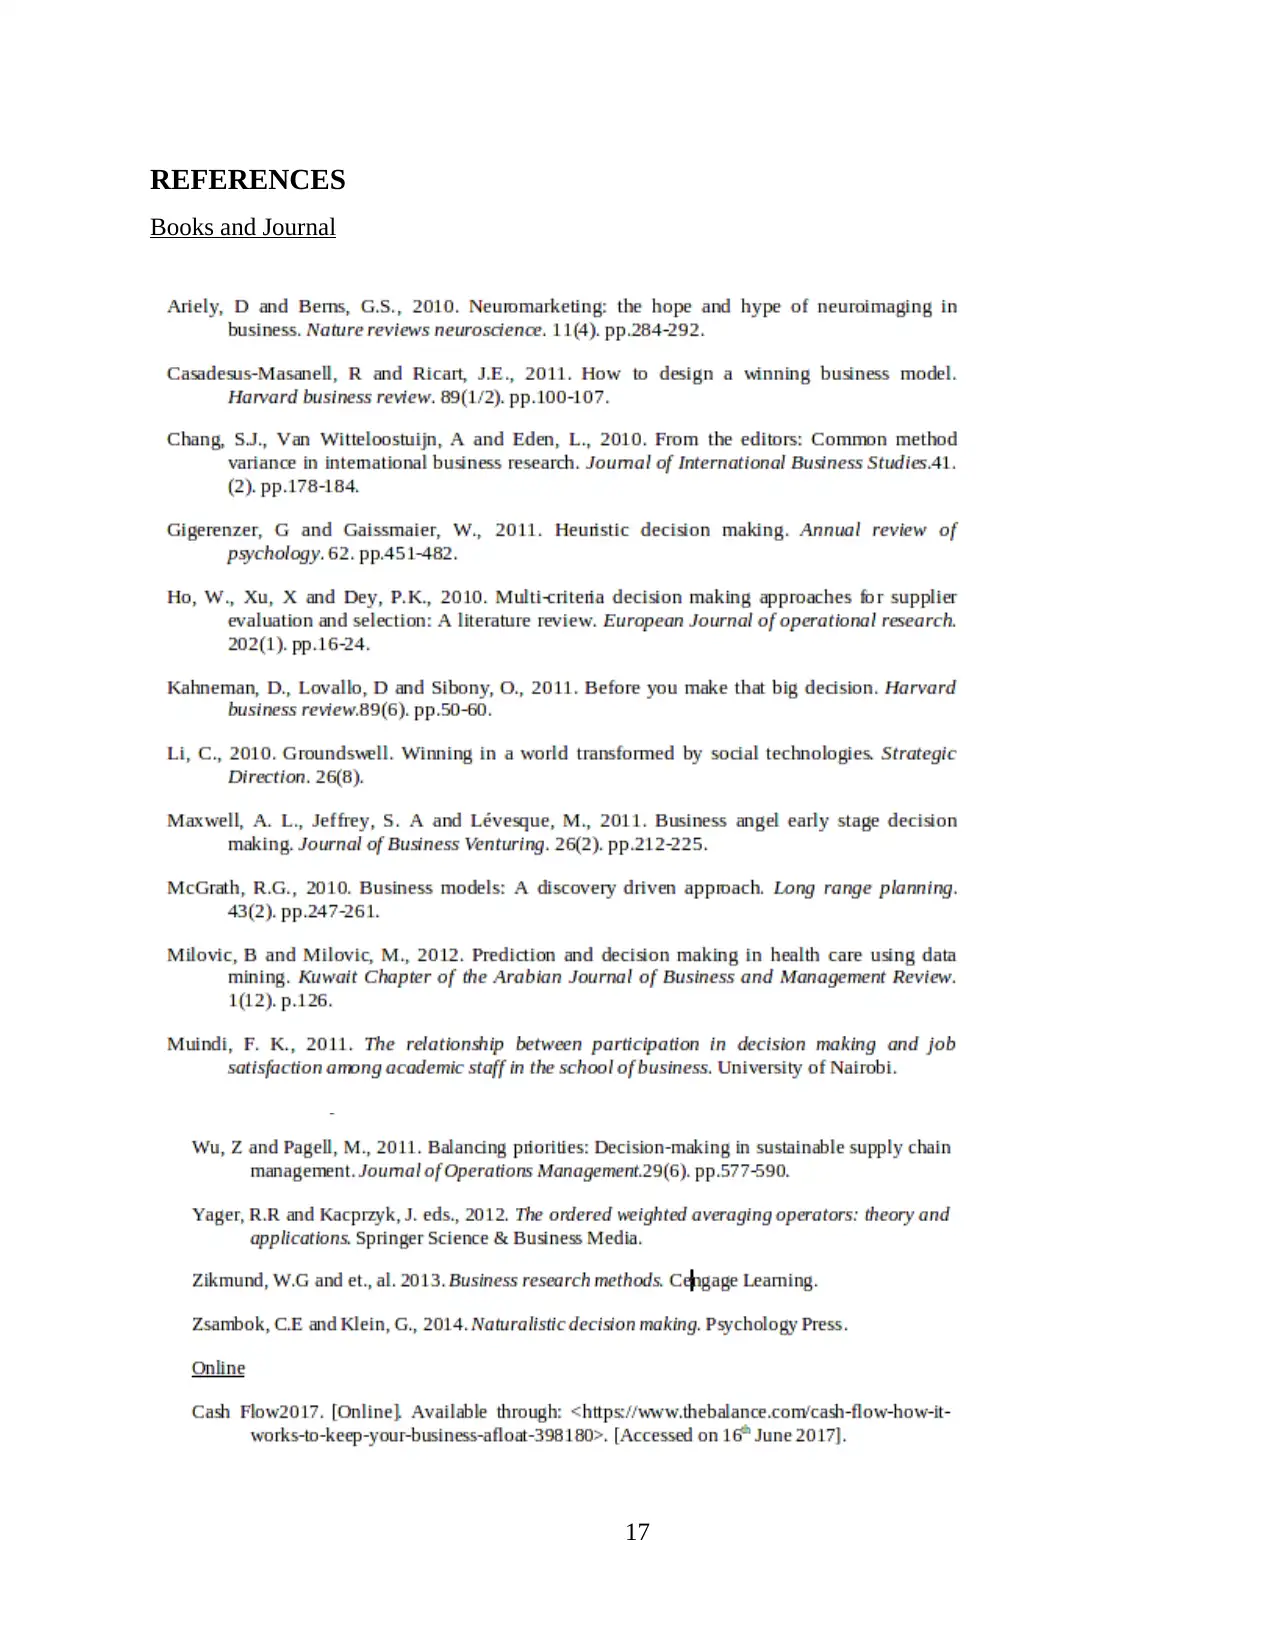
REFERENCES
Books and Journal
17
Books and Journal
17
1 out of 19
Related Documents


Your All-in-One AI-Powered Toolkit for Academic Success.
+13062052269
info@desklib.com
Available 24*7 on WhatsApp / Email
![[object Object]](/_next/static/media/star-bottom.7253800d.svg)
Unlock your academic potential
© 2024 | Zucol Services PVT LTD | All rights reserved.