Business Decision Making Report: Student Satisfaction at UKCBC College
VerifiedAdded on 2020/07/23
|26
|5570
|29
Report
AI Summary
This report presents a business decision-making analysis focused on student experiences and satisfaction at UKCBC College. The research begins with a detailed data collection plan, utilizing primary and secondary sources, and employing various research methodologies. A key component of the research involves the design and distribution of questionnaires to gather student feedback. The report then delves into data interpretation, including the calculation of descriptive statistics such as mean, median, and mode, followed by a comprehensive analysis of the results. Data is presented through charts and graphs to illustrate key findings. The report also explores the application of project management tools, including process tools and network diagrams, to aid in decision-making. Finally, the report includes an overview of investment tools used by the company, providing a holistic view of the business decision-making process. All research is conducted to make positive outcomes from the students.

BUSINESS DECISION
MAKING
MAKING
Paraphrase This Document
Need a fresh take? Get an instant paraphrase of this document with our AI Paraphraser
Table of Contents
INTRODUCTION...........................................................................................................................1
TASK 1............................................................................................................................................1
1.1 Data collection plan from different sources..........................................................................1
1.2 Research methodologies used under this research................................................................2
1.3 Designing of questionnaire...................................................................................................3
TASK 2............................................................................................................................................6
2.1 Data interpretation from the collected information...............................................................6
2.2 Results analysis...................................................................................................................10
2.3 Calculation of different ranges............................................................................................10
2.4 Benefits of quartile, percentile and correlation coefficient.................................................11
TASK 3..........................................................................................................................................12
3.1 Data representation by using charts and graphs..................................................................12
...................................................................................................................................................19
3.2 Trend line ...........................................................................................................................19
3.3 Covered PPT.......................................................................................................................20
3.4 A formal report....................................................................................................................20
TASK 4..........................................................................................................................................21
4.1 Process tools used in project designing...............................................................................21
4.2 Network diagram.................................................................................................................22
4.3 Investment tools used by the company...............................................................................22
CONCLUSION..............................................................................................................................23
REFERENCES..............................................................................................................................24
INTRODUCTION
Business decision-making is one of the crucial part of any business concern by which
they are able to make valuable decision regarding their day-to-day operations. It is said to be
most important part of any business those are associate with implementing appropriate strategies
so that management will attain its objectives (Barlett, 2016). It has been always found that every
decision-making leads to positive and negative impact on the growth and development of the
company. Under this project report a research is conducted regarding students experiences and
their satisfaction about UKCBC college. The project begun with a data collection plan by using
primary and secondary sources by applying research methodologies. Under this research
questionnaire are being designed in order to know students responses. The other part of the task
discuss about necessary calculation of arithmetic mean, median and mode. The results are being
presented through various charts and graphs. At last different tools are used to make financial
decision and a network diagram is being drawn to find out critical path. All the research are
conducted with the objective to make positive outcome from the students.
TASK 1
1.1 Data collection plan from different sources
In order to make the project more effective a proper data collection plan is being deigned.
It will help to make a research more accurate and in right direction so that goal are achieve in set
time duration. It also help to influence students responses about their experience and satisfaction
from their UKCBC college (Craft, Ford and Richardson, 2013). It comprises of various questions
that are being answered by the students and also test the impact of research and find out best
possible results from this research. The sources of data is being collected from interviews, filing
questionnaires, phone calls and personal observation from selected group of respondents.
Location from which the research is carried out in different campuses of UKCBC college:
Crickle wood campus
Lord house campus
Holborn campus
Oxford street campus
The main location which is taken fro this research are from above mentioned colleges and
it will take more than 5 weeks time duration to conduct proper research work. It will be helpful
1
⊘ This is a preview!⊘
Do you want full access?
Subscribe today to unlock all pages.
Trusted by 1+ million students worldwide
in achieving more accurate results and students feedback during the research (Frey, Schulz-Hardt
and Stahlberg, 2013).
For any research the most important part is fund that is use during this research process.
Because without capital not any research work is possible. So regarding this research 2500
pound to 5500 pounds will be required. These cost which are use in selecting skilled people
those are going to different campuses from research. So that proper estimation of cost is being
calculated before organising any research.
Under this project various methods of information collection that includes questionnaire
and interviews that are related with research and related records are being prepared. Number of
questionnaire is filled by selected group of students in order to get positive response from them.
Sampling is done by using different means that are used in most of the campuses of UKCBC
college. A sample size of 60 is being used under this research that are done from students and
other staffs members of that college (García-Peñalvo and Conde, 2014).
The data collection methods used is qualitative because personal interviews are done
from selected number of groups those are being associated with research and from them
questionnaire are filled.
The most important part of the research is that primary sources are used on priority
because the information collected from the students are fresh and it first time collected. The
chance of biasses is very less and most accurate results are produce. But to evaluate the data
more accurate secondary source are use in order to compare it from past records.
1.2 Research methodologies used under this research
As it has been observed that research is the journey to get some new information form
any a kind of situation. It arises the curiosity of the researcher to find something that is not
known to them. To complete their survey they required a set of proper methodologies to
investigate basics features and quality of that particular objects or any other things. It can be
done through evaluation of question and statistical data those are suppose to become big assets
for the country as well as from individual prospective (Gigerenzer and Gaissmaier, 2011). It
consist of hypothetical and practical knowledge from the study. The types of research are:
Qualitative research: To analyse the in depth study from that particular research are
collected from students those are based on various facts and figures. From which quality
2
Paraphrase This Document
Need a fresh take? Get an instant paraphrase of this document with our AI Paraphraser
of research is being so that most appropriate decision should be taken regarding any
change to UKCBC college.
Descriptive research: It is used to depict the respondent in most accurate manner. There
are mainly three ways to collect information like observation, case study and in-depth
study of an individual or a selected group (Groebner and et. al., 2011).
In this project two main research techniques used as: Interviews in following ways that
are explained below: Interview which is said to be that ways in which people interact with each
other in order to known their background and personal knowledge about the college. It is of two
types: Face to face interviews that are done directly communicating with students in-front. And
other is focused groups it means from number of students various groups are being divided in
order to get their common reactions.
2nd Questionnaire which is summarised with multiple choice option that are available to
the respondents. It can either be directly or indirectly.
There are several methods of sampling is being used under this research work. Some of the are as
follows:
Cluster sampling: Under this sampling framework a small group of people are divided
into various groups from different number of respondents.
Simple random sampling: In this sampling methods each units and or groups have equal
possibilities to being selected.
Quota sampling: It is collected in order to make representative values from chosen
groups. It is said to be opposite of random sampling.
Stratified sampling: Under this sampling a population is divided into a smaller groups
that is based on probability (Laudon and et. al., 2012).
Systematic sampling: It is said to be that methods which are selected from large part of
groups those are based on starting phase and a set measure of time duration.
There are various methods of sampling framework and from which random sampling
and quota are used under this research work because they are said to be the most appropriate
sampling tools which will provide most appropriate results.
1.3 Designing of questionnaire
A questionnaire is a set of various questions those are having multiple choice option to
answer with their own choice. It is required to be filled with the objectives to reach out to
3
definite outcome from the overall study. It is design in order to get information that what they
think about the college in their own perception (Maxwell Jeffrey and Lévesque, 2011). There are
various types of designing questionnaire like open ended and close ended. In spite of that some
of them are:
Ordinal – polytomus, it is said to be that types in which options are available in order or
sequence.
Nominal – polytomus: Under this type of questions there are more than two option are
available with the respondents.
Dichotomous: In this types of questions there are only tow options available with the
respondents.
The objective of research questionnaire is to know about different students and other faculties
experience and their satisfaction about UKCBC college.
Questionnaire
Q1. In which campus of UKCBC college to do studying?
a) Royal park campus
b) Holborn campus
c) Crickle Wood
d) Oxford street
Q2. Which age category you belongs ?
a) 19 or younger
b) 20-25
c) 25-30
d) 30-40
e) 40-50
Q3. From below mentioned courses available in your college ?
a) AAT
b) HNCSD
c) HNHSC
d) HNDB
e) HNTTM
4
⊘ This is a preview!⊘
Do you want full access?
Subscribe today to unlock all pages.
Trusted by 1+ million students worldwide
Q4. Is teaching quality of UKCBC college are ?
a) Most satisfied
b) Satisfied
c) Not satisfied
Q5. Learning material provided by college are ?
a) Satisfied
b) Good
c) Average
Q6. Does the procedure of admission are simple?
a) Yes
b) No
Q7. Response toward other faculties and outside students are ?
a) Good
b) Average
c) Below Average
Q8. Is the personality is be groom after completion of their course are ?
a) Enough
b) Not enough
Q9. Do you agree with the skills and learning provided by the college?
a) Highly Agree
b) Agree
c) Disagree
Q10. How much your are satisfied with UKCBC college ?
a) Highly satisfied
5
Paraphrase This Document
Need a fresh take? Get an instant paraphrase of this document with our AI Paraphraser
b) satisfied
c) Dissatisfied
Q11. Provide any feedback and suggestion. If any?
Ans:....................................................................................................................................................
.......................................................................................
TASK 2
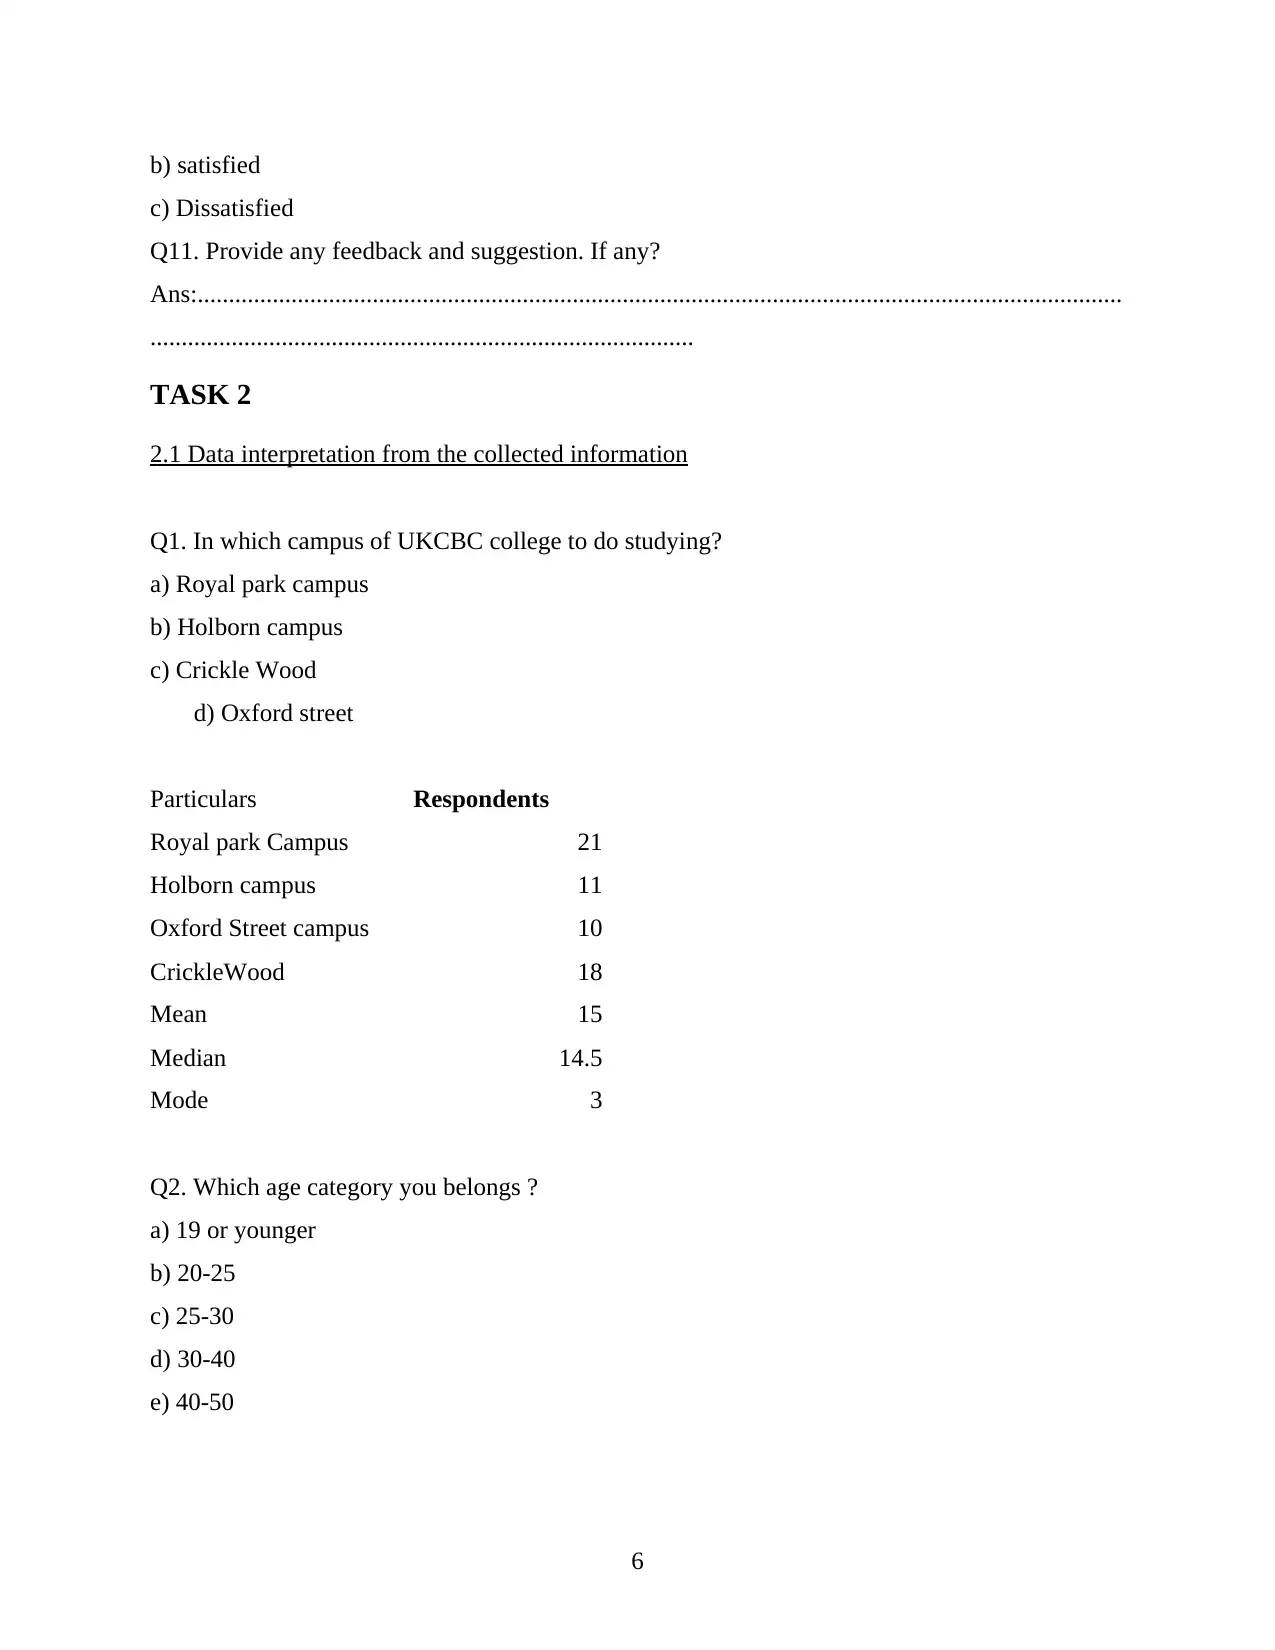
2.1 Data interpretation from the collected information
Q1. In which campus of UKCBC college to do studying?
a) Royal park campus
b) Holborn campus
c) Crickle Wood
d) Oxford street
Particulars Respondents
Royal park Campus 21
Holborn campus 11
Oxford Street campus 10
CrickleWood 18
Mean 15
Median 14.5
Mode 3
Q2. Which age category you belongs ?
a) 19 or younger
b) 20-25
c) 25-30
d) 30-40
e) 40-50
6
c) Dissatisfied
Q11. Provide any feedback and suggestion. If any?
Ans:....................................................................................................................................................
.......................................................................................
TASK 2
2.1 Data interpretation from the collected information
Q1. In which campus of UKCBC college to do studying?
a) Royal park campus
b) Holborn campus
c) Crickle Wood
d) Oxford street
Particulars Respondents
Royal park Campus 21
Holborn campus 11
Oxford Street campus 10
CrickleWood 18
Mean 15
Median 14.5
Mode 3
Q2. Which age category you belongs ?
a) 19 or younger
b) 20-25
c) 25-30
d) 30-40
e) 40-50
6
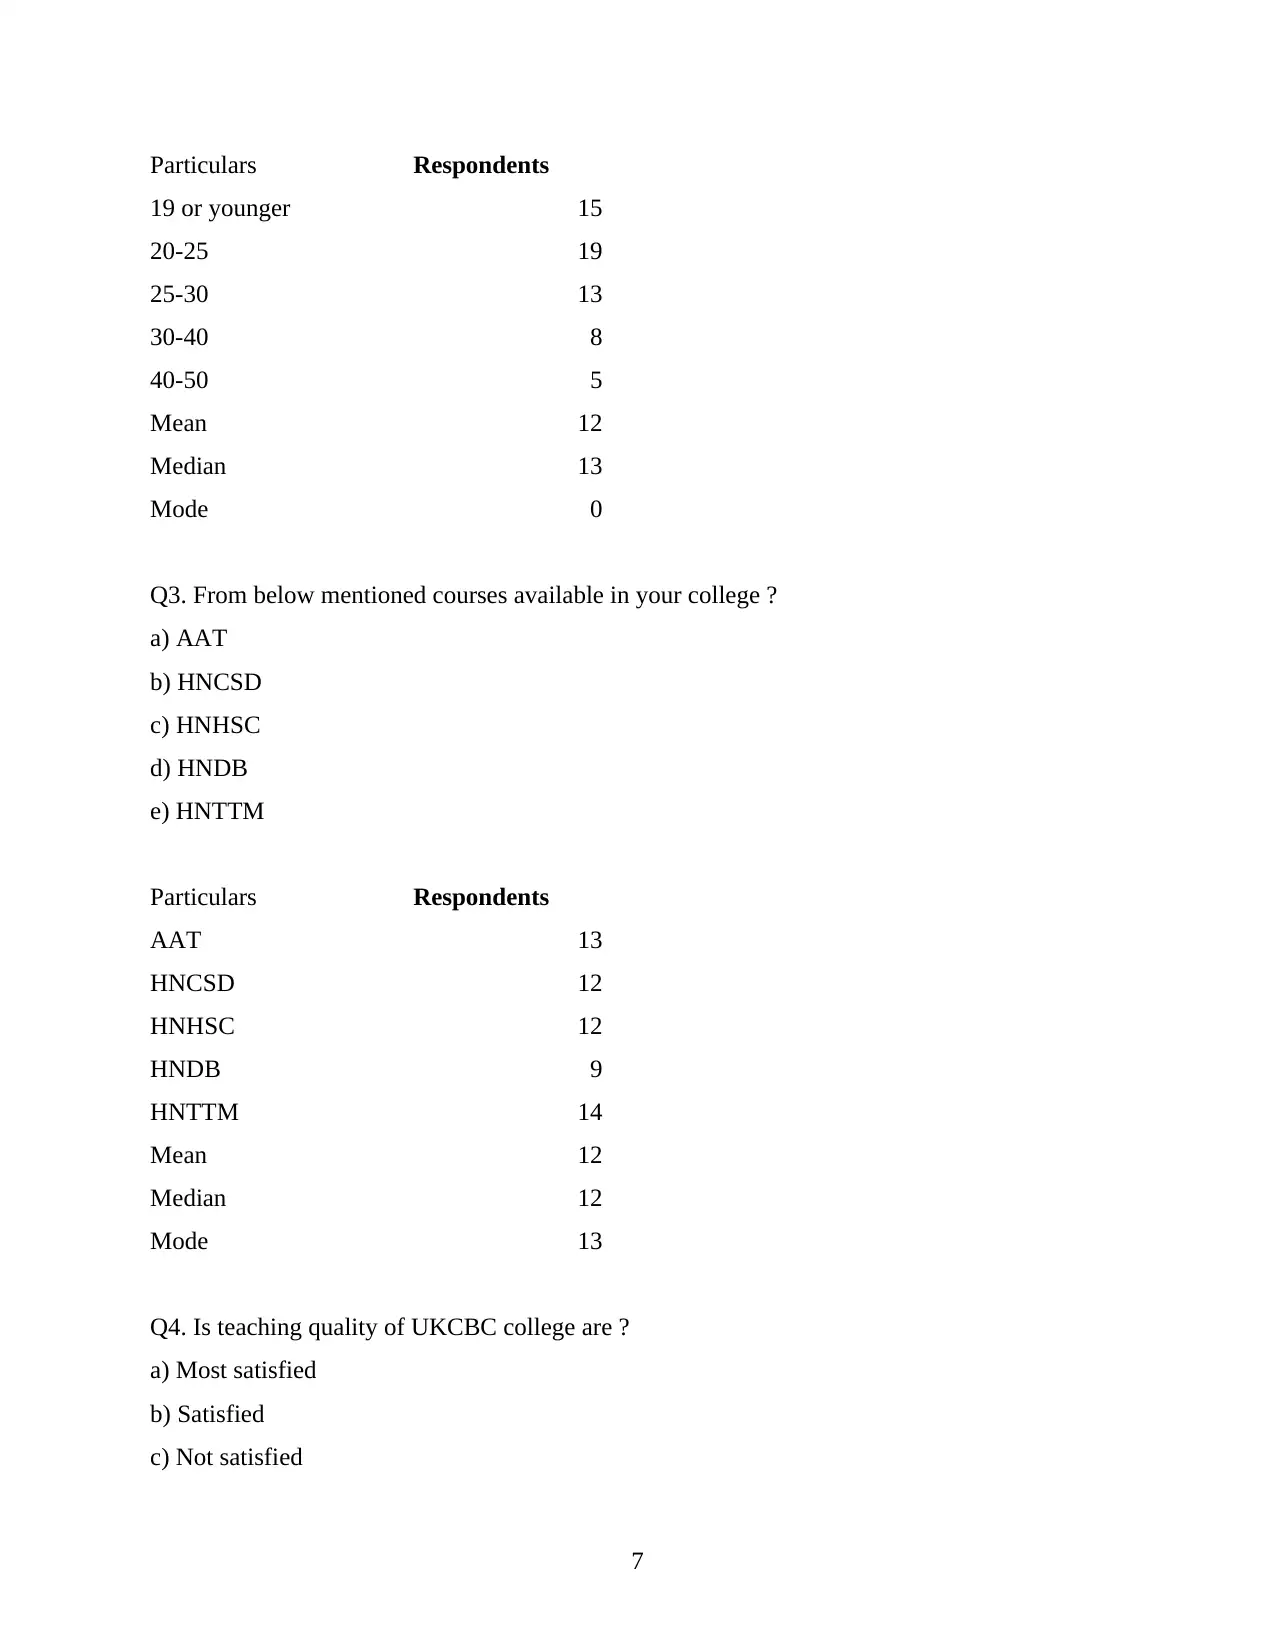
Particulars Respondents
19 or younger 15
20-25 19
25-30 13
30-40 8
40-50 5
Mean 12
Median 13
Mode 0
Q3. From below mentioned courses available in your college ?
a) AAT
b) HNCSD
c) HNHSC
d) HNDB
e) HNTTM
Particulars Respondents
AAT 13
HNCSD 12
HNHSC 12
HNDB 9
HNTTM 14
Mean 12
Median 12
Mode 13
Q4. Is teaching quality of UKCBC college are ?
a) Most satisfied
b) Satisfied
c) Not satisfied
7
⊘ This is a preview!⊘
Do you want full access?
Subscribe today to unlock all pages.
Trusted by 1+ million students worldwide
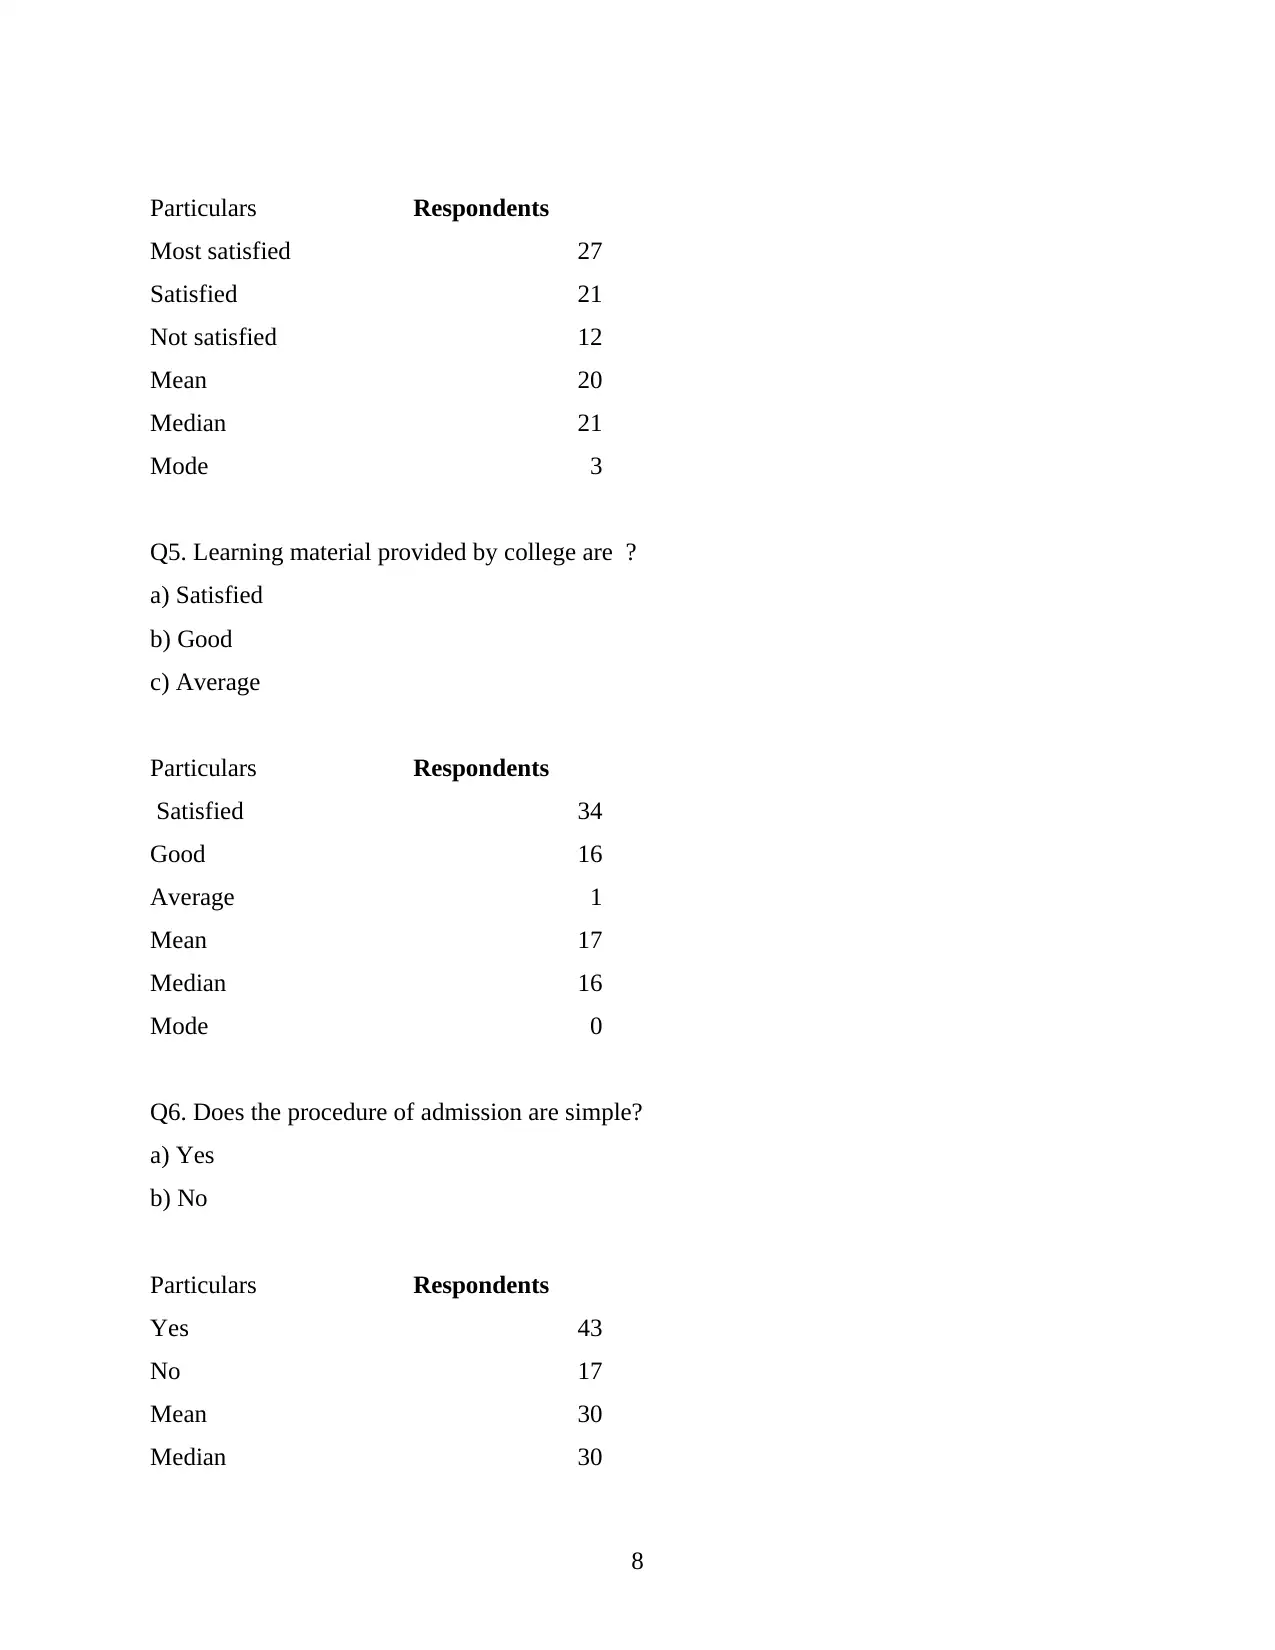
Particulars Respondents
Most satisfied 27
Satisfied 21
Not satisfied 12
Mean 20
Median 21
Mode 3
Q5. Learning material provided by college are ?
a) Satisfied
b) Good
c) Average
Particulars Respondents
Satisfied 34
Good 16
Average 1
Mean 17
Median 16
Mode 0
Q6. Does the procedure of admission are simple?
a) Yes
b) No
Particulars Respondents
Yes 43
No 17
Mean 30
Median 30
8
Paraphrase This Document
Need a fresh take? Get an instant paraphrase of this document with our AI Paraphraser
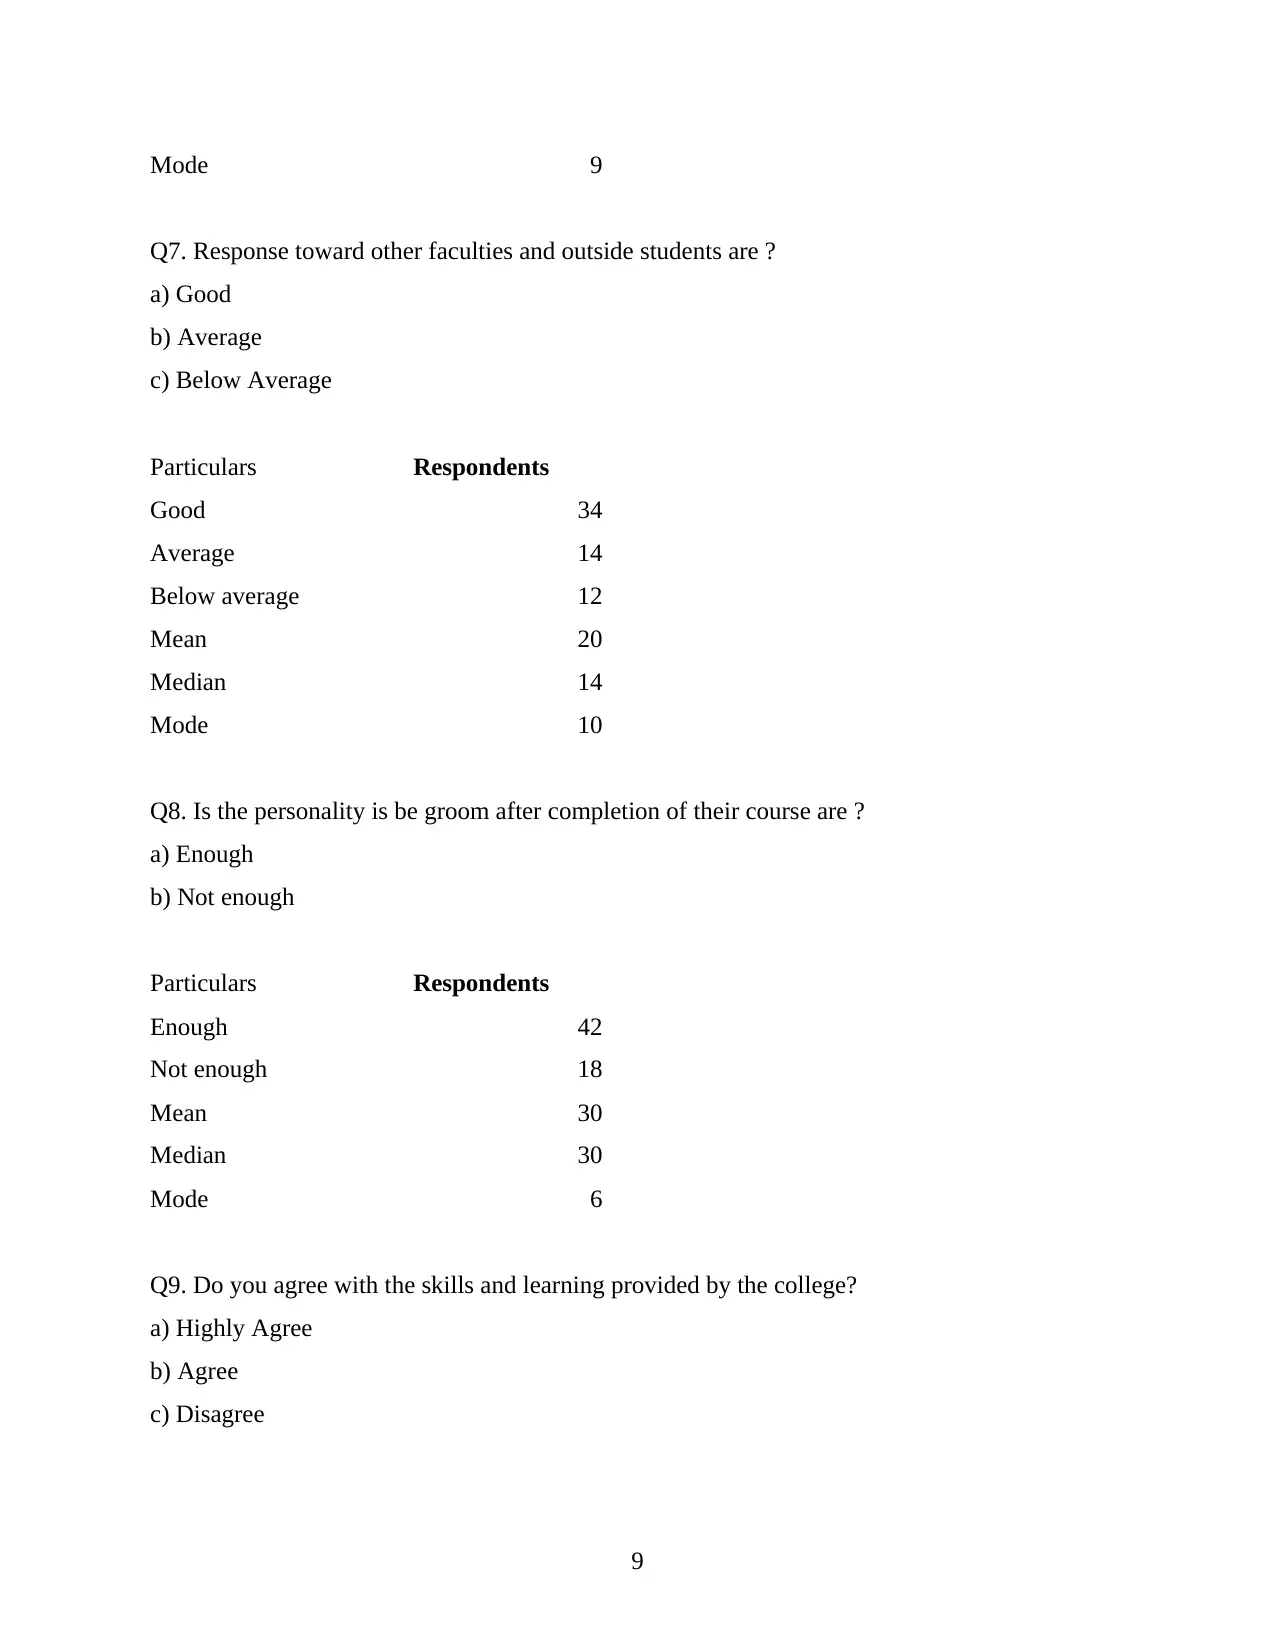
Mode 9
Q7. Response toward other faculties and outside students are ?
a) Good
b) Average
c) Below Average
Particulars Respondents
Good 34
Average 14
Below average 12
Mean 20
Median 14
Mode 10
Q8. Is the personality is be groom after completion of their course are ?
a) Enough
b) Not enough
Particulars Respondents
Enough 42
Not enough 18
Mean 30
Median 30
Mode 6
Q9. Do you agree with the skills and learning provided by the college?
a) Highly Agree
b) Agree
c) Disagree
9
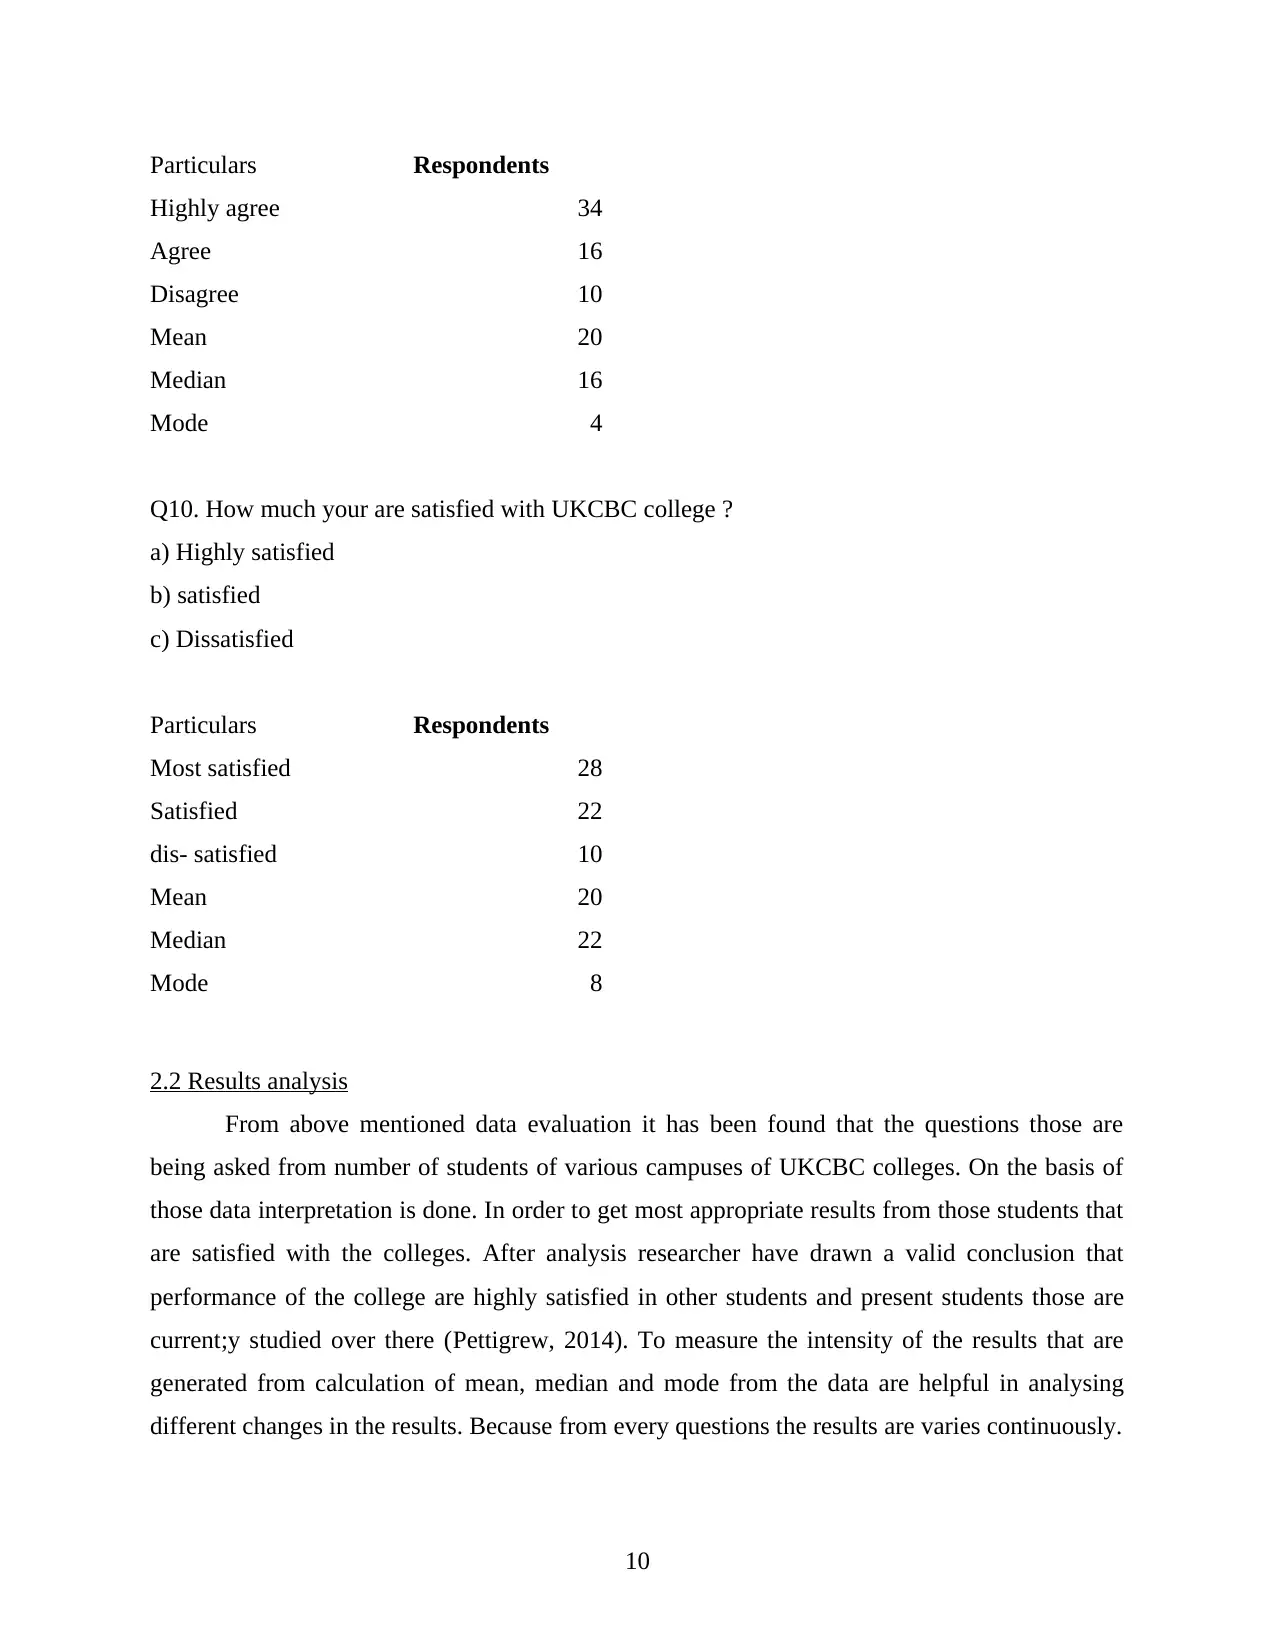
Particulars Respondents
Highly agree 34
Agree 16
Disagree 10
Mean 20
Median 16
Mode 4
Q10. How much your are satisfied with UKCBC college ?
a) Highly satisfied
b) satisfied
c) Dissatisfied
Particulars Respondents
Most satisfied 28
Satisfied 22
dis- satisfied 10
Mean 20
Median 22
Mode 8
2.2 Results analysis
From above mentioned data evaluation it has been found that the questions those are
being asked from number of students of various campuses of UKCBC colleges. On the basis of
those data interpretation is done. In order to get most appropriate results from those students that
are satisfied with the colleges. After analysis researcher have drawn a valid conclusion that
performance of the college are highly satisfied in other students and present students those are
current;y studied over there (Pettigrew, 2014). To measure the intensity of the results that are
generated from calculation of mean, median and mode from the data are helpful in analysing
different changes in the results. Because from every questions the results are varies continuously.
10
⊘ This is a preview!⊘
Do you want full access?
Subscribe today to unlock all pages.
Trusted by 1+ million students worldwide
1 out of 26
Related Documents


Your All-in-One AI-Powered Toolkit for Academic Success.
+13062052269
info@desklib.com
Available 24*7 on WhatsApp / Email
![[object Object]](/_next/static/media/star-bottom.7253800d.svg)
Unlock your academic potential
Copyright © 2020–2025 A2Z Services. All Rights Reserved. Developed and managed by ZUCOL.