Business Decision Making Models
VerifiedAdded on 2020/01/07
|20
|4600
|153
Essay
AI Summary
This assignment delves into the realm of business decision making by examining different models employed to analyze situations and arrive at optimal solutions. It discusses the theoretical underpinnings of these models, their practical applications in diverse business contexts, and the ethical dilemmas that may arise during the decision-making process. The focus is on understanding how businesses utilize structured approaches to navigate complex choices and achieve desired outcomes while adhering to ethical principles.
Contribute Materials
Your contribution can guide someone’s learning journey. Share your
documents today.

BUSINESS DECISION
MAKING
MAKING
Secure Best Marks with AI Grader
Need help grading? Try our AI Grader for instant feedback on your assignments.
TABLE OF CONTENTS
INTRODUCTION...........................................................................................................................3
TASK 1............................................................................................................................................4
1.1 Create a plan for collecting data from students across all campuses...............................4
1.2 Present the survey methodology and sampling frame used..............................................5
1.3 Design a questionnaire for collecting the data.................................................................6
TASK 2............................................................................................................................................9
2.1 Data summarisation..........................................................................................................9
2.2 The results of the survey and conclusions......................................................................10
2.3 Measures of dispersion...................................................................................................11
2.4 Use of quartiles, percentiles and the correlation coefficient..........................................11
TASK 3..........................................................................................................................................13
3.1 Graphs.............................................................................................................................13
3.2 Trend lines......................................................................................................................15
3.3 Covered in PPT...............................................................................................................16
3.4 A formal report...............................................................................................................16
TASK 4..........................................................................................................................................17
4.1 Using information processing tools................................................................................17
4.2 A project plan for the given project activity and the critical path..................................18
4.3 Financial tools for decision making...............................................................................19
CONCLUSION..............................................................................................................................20
REFERENCES..............................................................................................................................21

INTRODUCTION
Decision making is important whether it is an individuals life or business. It plays an
important role. In a business it is required to maintain the consistency which can be occurred by
the environment in which the business is operating. Decision making can be theoretical or
practical. A decision can be taken by assessing the things as well as collecting data to convert
that into an information by various methodologies. In this report the presentation of data by
conducting a survey to present in various committee meetings of UKCBC(UK college of
business and computing). The critical path analysis and the calculation of various factors which
can effect the decision making on the operation of a business is illustrated in this project which
could help the presenter to present it to QAA(quality assurance agency). There are two methods
to have a conclusion by the the method of collecting the data first is primary method and second
is secondary method. The proper usage of both the tools has to be done to have a information for
the decision making process of an organisation. So in this report all the tools of research to
ascertain and have a proper base to make decision is explained which will be represent to QAA
team which will be coming to UKCBC for reviewing the procedure.
TASK 1
1.1 Create a plan for collecting data from students across all campuses
Data can be collected from the students by various means across the campus. There are
several ways to collect the data (Aharoni, 2011). They can be used by the collector to have data
from the students. These methods are listed as below: Questionnaire: A formal questionnaire to collect data from the students can be prepared
regarding the relevant information which is to be collected from the students. This
questionnaire should have relevant questions which can be exactly used by the researcher
to collect information. Feedback Forms: Feedback forms are prepared to know what opinion students actually
have about the different things in the college.
Personal Observation: A person can be appointed to ask questions from the students and
the records of that data can be maintained by that person at the same time.
Secure Best Marks with AI Grader
Need help grading? Try our AI Grader for instant feedback on your assignments.
For this research questionnaire would be the best to ask questions from the people. A
questionnaire is prepared on two basis open ended questionnaire and closed ended questionnaire.
An open ended questionnaire contains questions which have various factors on which the answer
is recorded. A closed ended questionnaire only ascertain about agreeing or disagreeing or yes or
no which do not have any factors to choose just a right or wrong (Bayne, 2011). In this research
a questionnaire should be planned as open ended to collect various reviews of the students.
Questions related to basic problems and major problems which may be faced by the students can
be asked they can be:
What problems they face in the college?
What is the best thing of the college?
What is required to add in the infrastructure?
Which department is best?
Which faculty is your most favourite?
Do you like online attendance system?
What all activities you would like to add up in college?
Which rules in the college are to be changed in the college?
1.2 Present the survey methodology and sampling frame used
Survey methodology is a concept which consist of various methods which can be used to
collect data from the people. When we form a questionnaire for survey these questionnaire has to
be fulfilled from the people as in this report the questionnaire has to be filled by the students in
UKCBC college (Zsambok, 2014). There are various factors which are to be considered while
doing survey they are as follows:
Population:
The people which are being chosen to fill the questionnaire of the survey. This is chosen as
required in the research like in this research we have chosen the students of the college who will
fill the questionnaire. The population is chosen because there is no enough finance and data
collection method is there to collect data from each and every person. So some of the many are
chosen which represents the whole population.
Sample frame:
It is the subset of the individuals or the population which is chosen for the survey. There are two
methods of sample framing probability and non probability sample frames. Probability sample
framing aims at collecting data from random people out of the population and non probability
framing do not include this they can be used even when there is no sample frame. This method is
less complicated and easy to undertake (Yager, 2012).
In this research report probability sampling has been chosen which considers random
sampling. Random sampling consist of collecting the data from the random people from the
population. The people who will fill the questionnaire is randomly chosen. As in UKCBC there
are students of different field who are chosen to fill the questionnaire.
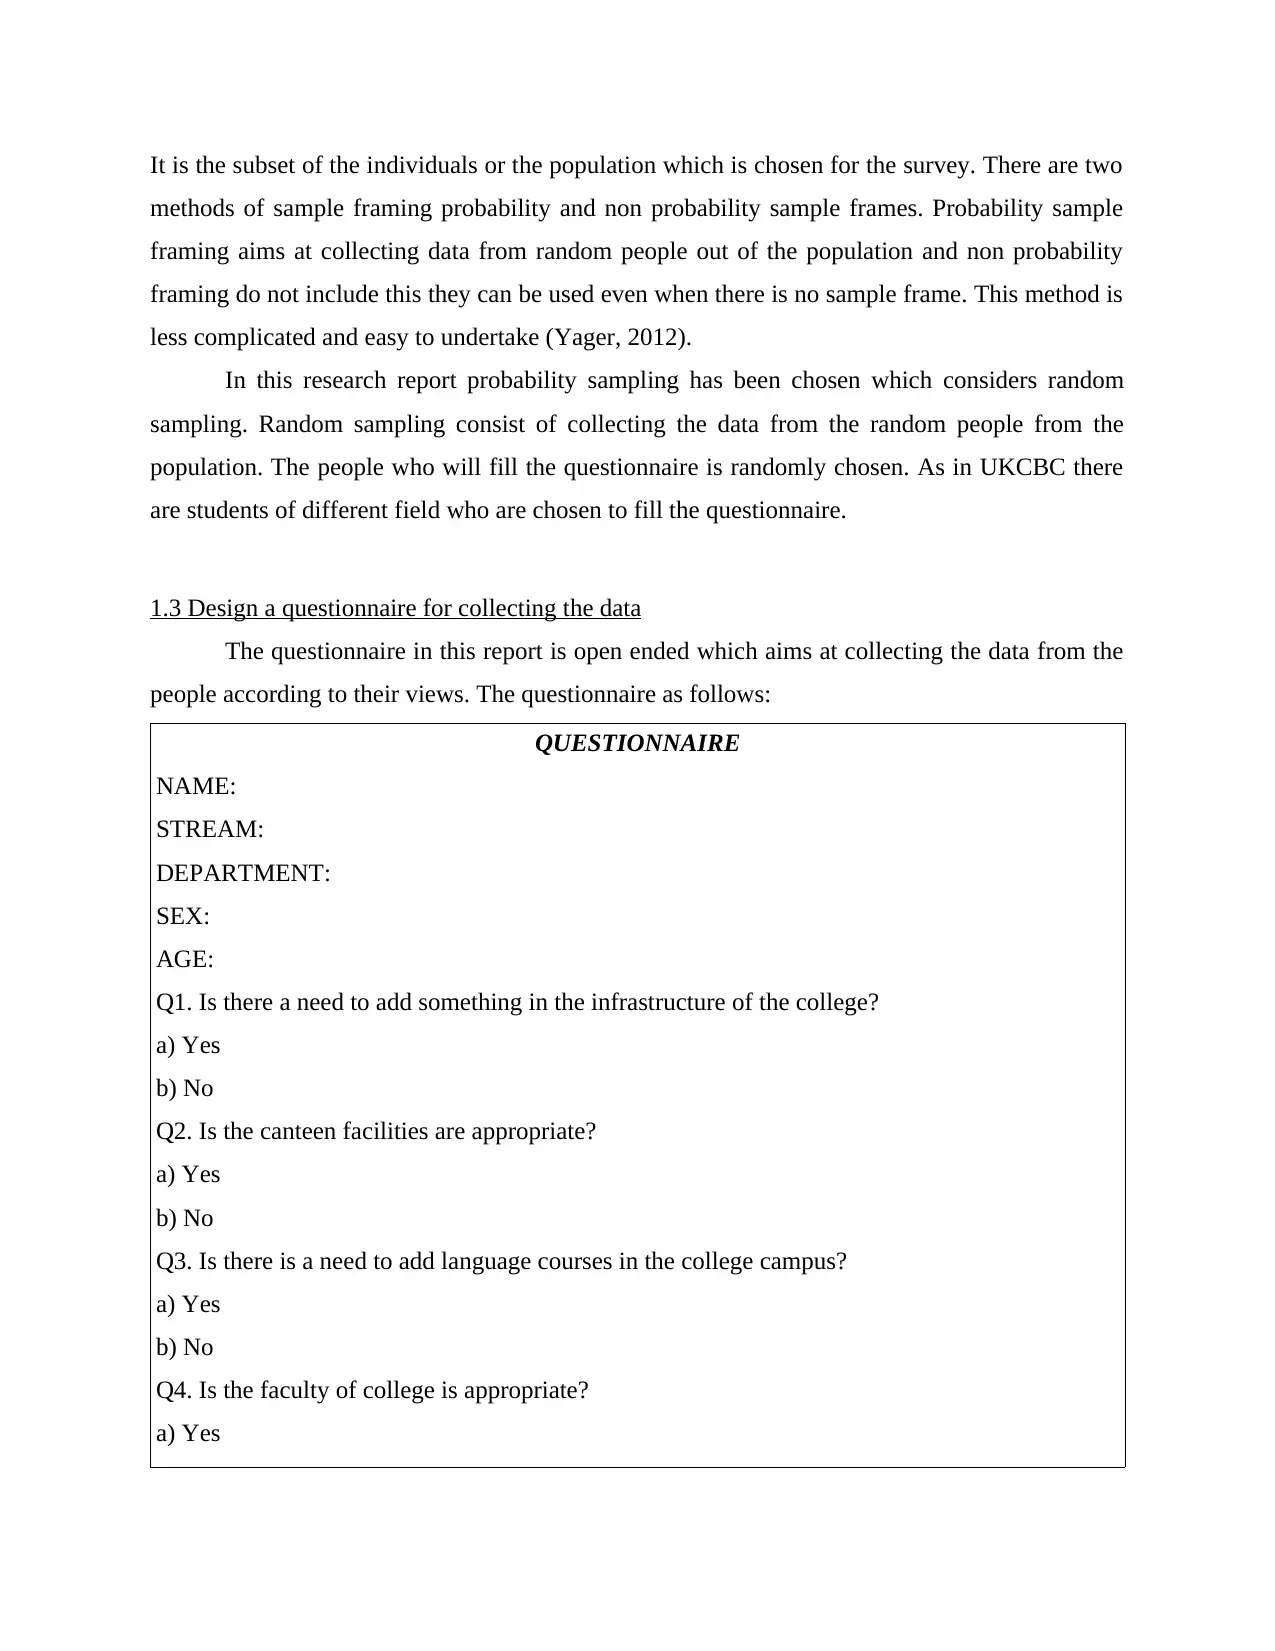
1.3 Design a questionnaire for collecting the data
The questionnaire in this report is open ended which aims at collecting the data from the
people according to their views. The questionnaire as follows:
QUESTIONNAIRE
NAME:
STREAM:
DEPARTMENT:
SEX:
AGE:
Q1. Is there a need to add something in the infrastructure of the college?
a) Yes
b) No
Q2. Is the canteen facilities are appropriate?
a) Yes
b) No
Q3. Is there is a need to add language courses in the college campus?
a) Yes
b) No
Q4. Is the faculty of college is appropriate?
a) Yes
methods of sample framing probability and non probability sample frames. Probability sample
framing aims at collecting data from random people out of the population and non probability
framing do not include this they can be used even when there is no sample frame. This method is
less complicated and easy to undertake (Yager, 2012).
In this research report probability sampling has been chosen which considers random
sampling. Random sampling consist of collecting the data from the random people from the
population. The people who will fill the questionnaire is randomly chosen. As in UKCBC there
are students of different field who are chosen to fill the questionnaire.
1.3 Design a questionnaire for collecting the data
The questionnaire in this report is open ended which aims at collecting the data from the
people according to their views. The questionnaire as follows:
QUESTIONNAIRE
NAME:
STREAM:
DEPARTMENT:
SEX:
AGE:
Q1. Is there a need to add something in the infrastructure of the college?
a) Yes
b) No
Q2. Is the canteen facilities are appropriate?
a) Yes
b) No
Q3. Is there is a need to add language courses in the college campus?
a) Yes
b) No
Q4. Is the faculty of college is appropriate?
a) Yes
b) No
Q.5 Is the environment of the college is appropriate?
a) Yes
b) No
Q6. Is there any improvement required in the teaching pattern of the college?
a) Yes
b) No
Q7. Is the behaviour of the teachers in the college is appropriate?
a) Yes
b) No
Q8. Do you get time to invest in work after college?
a) Yes
b) No
Q9. Does the course of your subject is completed on time?
a) Yes
b) No
Q10. Is this questionnaire is appropriate?
a) Yes
b) No
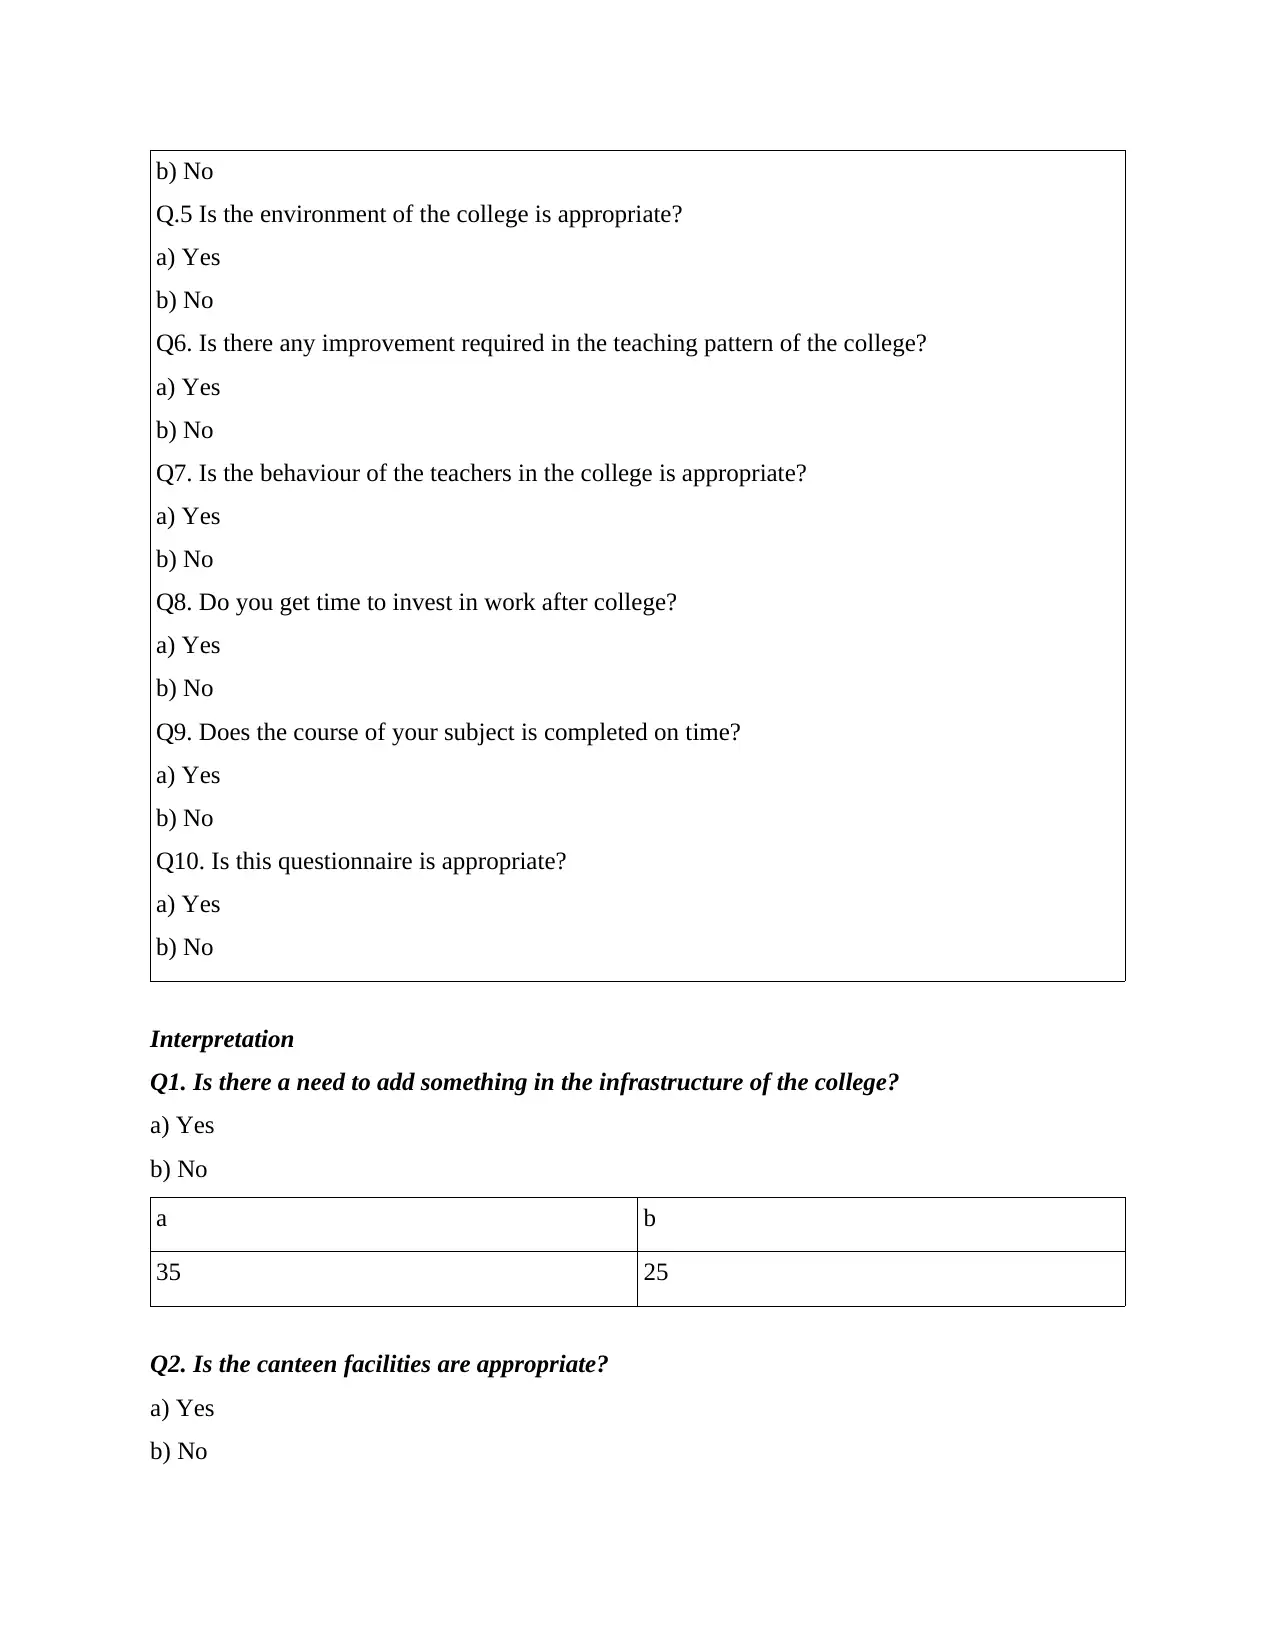
Interpretation
Q1. Is there a need to add something in the infrastructure of the college?
a) Yes
b) No
a b
35 25
Q2. Is the canteen facilities are appropriate?
a) Yes
b) No
Q.5 Is the environment of the college is appropriate?
a) Yes
b) No
Q6. Is there any improvement required in the teaching pattern of the college?
a) Yes
b) No
Q7. Is the behaviour of the teachers in the college is appropriate?
a) Yes
b) No
Q8. Do you get time to invest in work after college?
a) Yes
b) No
Q9. Does the course of your subject is completed on time?
a) Yes
b) No
Q10. Is this questionnaire is appropriate?
a) Yes
b) No
Interpretation
Q1. Is there a need to add something in the infrastructure of the college?
a) Yes
b) No
a b
35 25
Q2. Is the canteen facilities are appropriate?
a) Yes
b) No
Paraphrase This Document
Need a fresh take? Get an instant paraphrase of this document with our AI Paraphraser
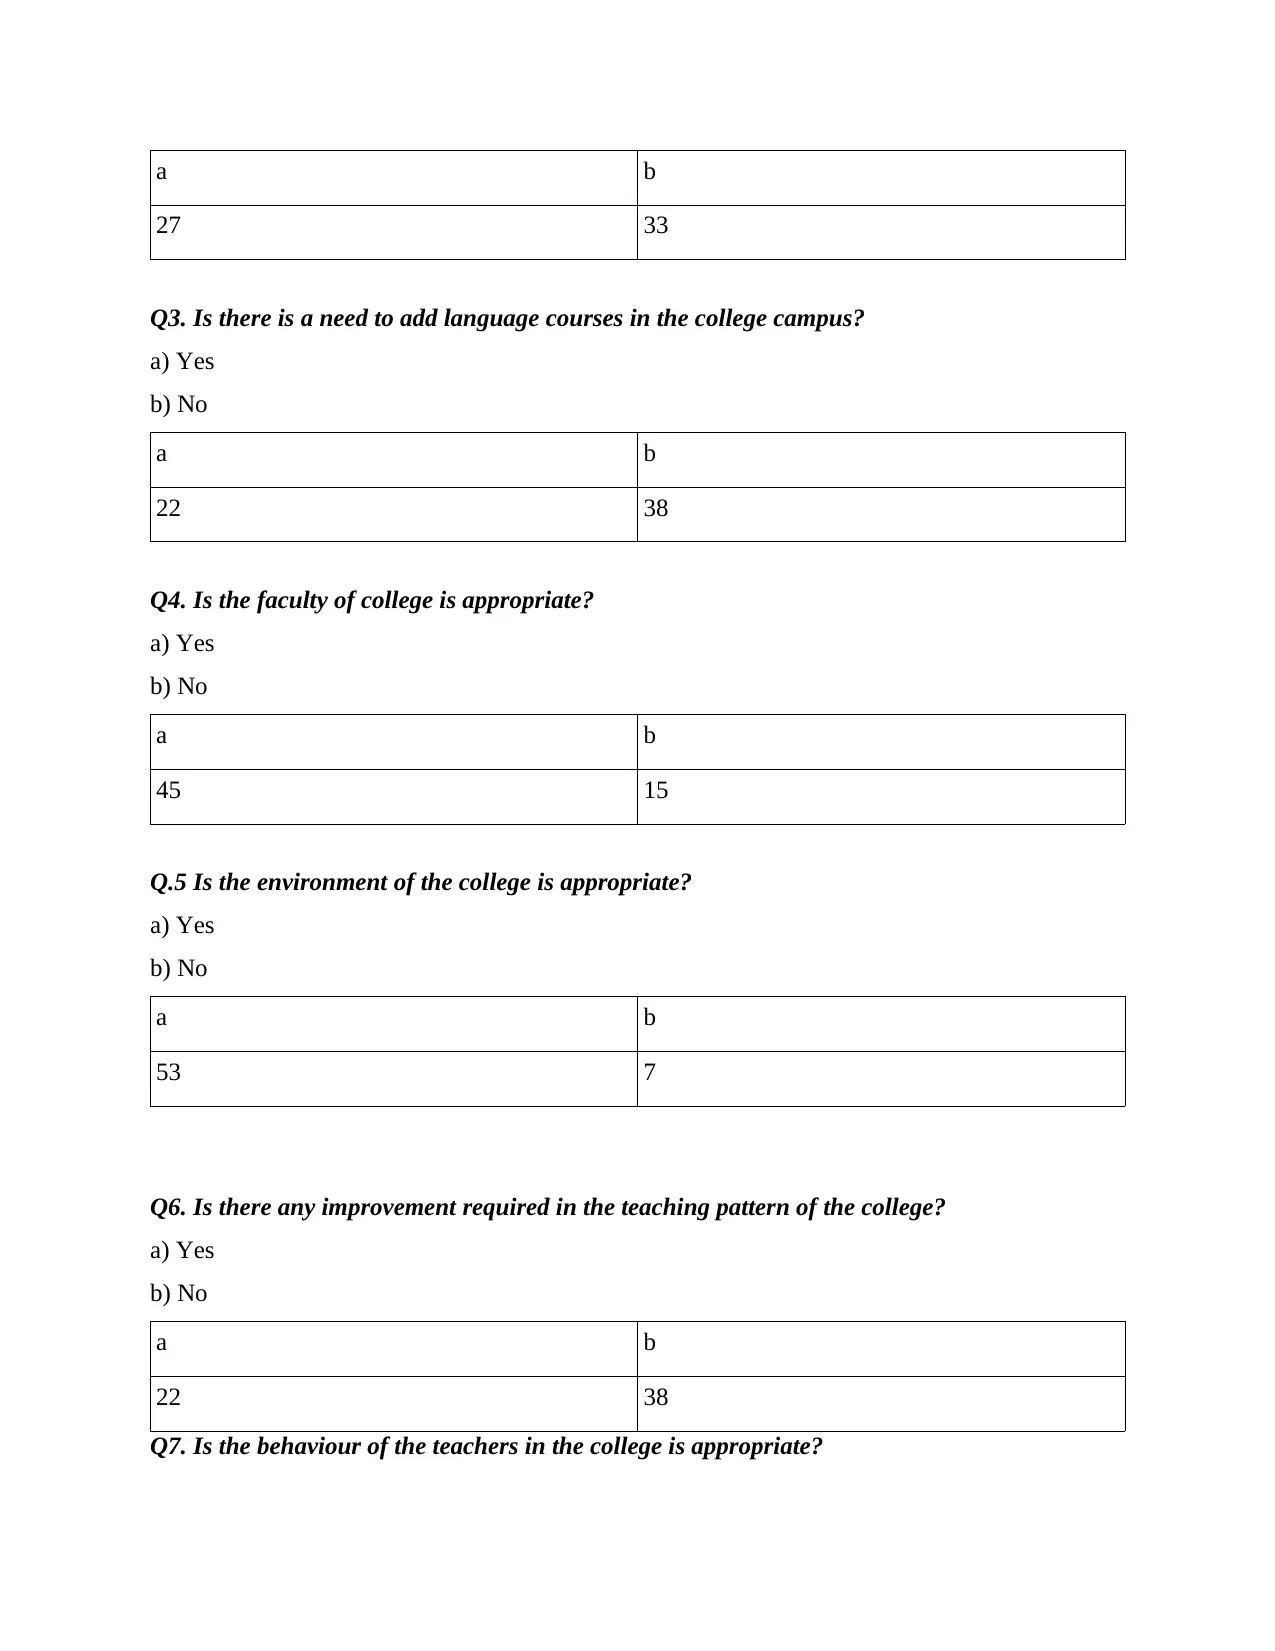
a b
27 33
Q3. Is there is a need to add language courses in the college campus?
a) Yes
b) No
a b
22 38
Q4. Is the faculty of college is appropriate?
a) Yes
b) No
a b
45 15
Q.5 Is the environment of the college is appropriate?
a) Yes
b) No
a b
53 7
Q6. Is there any improvement required in the teaching pattern of the college?
a) Yes
b) No
a b
22 38
Q7. Is the behaviour of the teachers in the college is appropriate?
a) Yes
b) No
a b
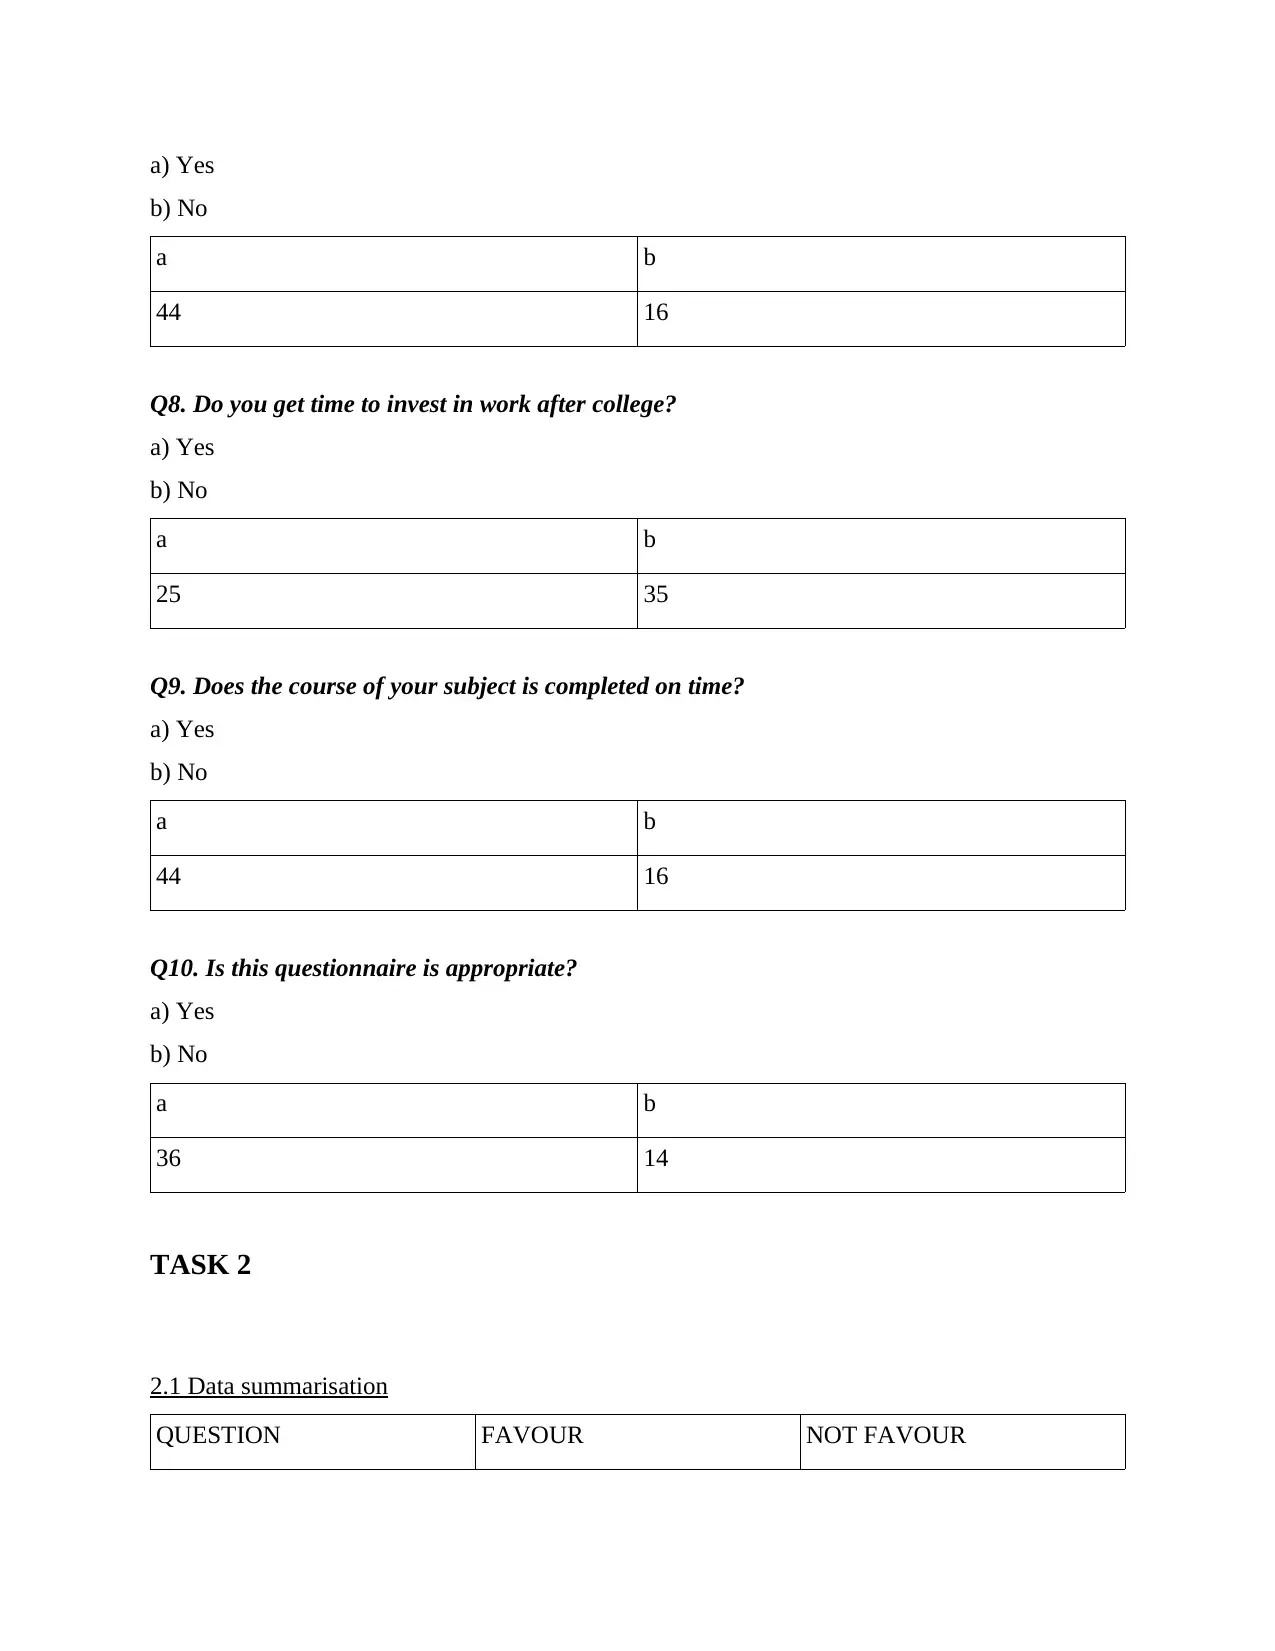
44 16
Q8. Do you get time to invest in work after college?
a) Yes
b) No
a b
25 35
Q9. Does the course of your subject is completed on time?
a) Yes
b) No
a b
44 16
Q10. Is this questionnaire is appropriate?
a) Yes
b) No
a b
36 14
TASK 2
2.1 Data summarisation
QUESTION FAVOUR NOT FAVOUR
b) No
a b
44 16
Q8. Do you get time to invest in work after college?
a) Yes
b) No
a b
25 35
Q9. Does the course of your subject is completed on time?
a) Yes
b) No
a b
44 16
Q10. Is this questionnaire is appropriate?
a) Yes
b) No
a b
36 14
TASK 2
2.1 Data summarisation
QUESTION FAVOUR NOT FAVOUR
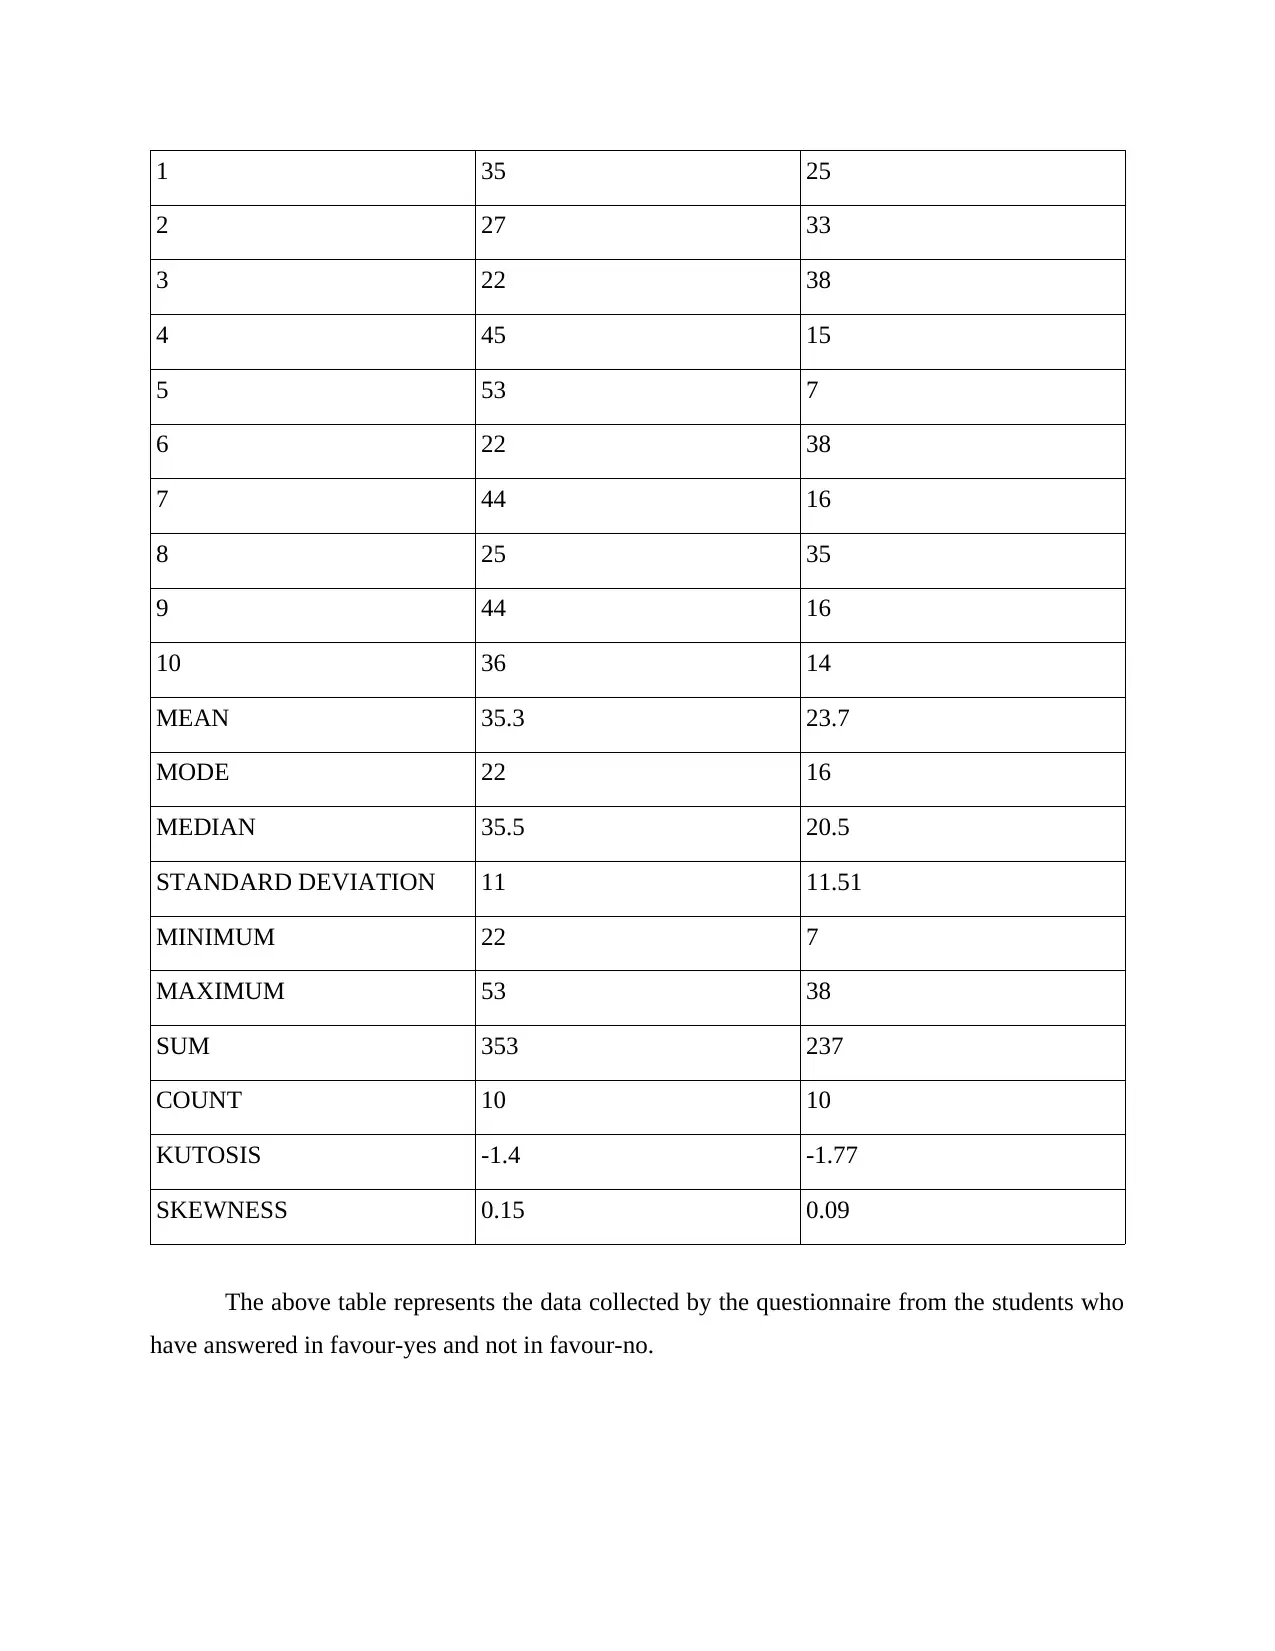
1 35 25
2 27 33
3 22 38
4 45 15
5 53 7
6 22 38
7 44 16
8 25 35
9 44 16
10 36 14
MEAN 35.3 23.7
MODE 22 16
MEDIAN 35.5 20.5
STANDARD DEVIATION 11 11.51
MINIMUM 22 7
MAXIMUM 53 38
SUM 353 237
COUNT 10 10
KUTOSIS -1.4 -1.77
SKEWNESS 0.15 0.09
The above table represents the data collected by the questionnaire from the students who
have answered in favour-yes and not in favour-no.
Secure Best Marks with AI Grader
Need help grading? Try our AI Grader for instant feedback on your assignments.
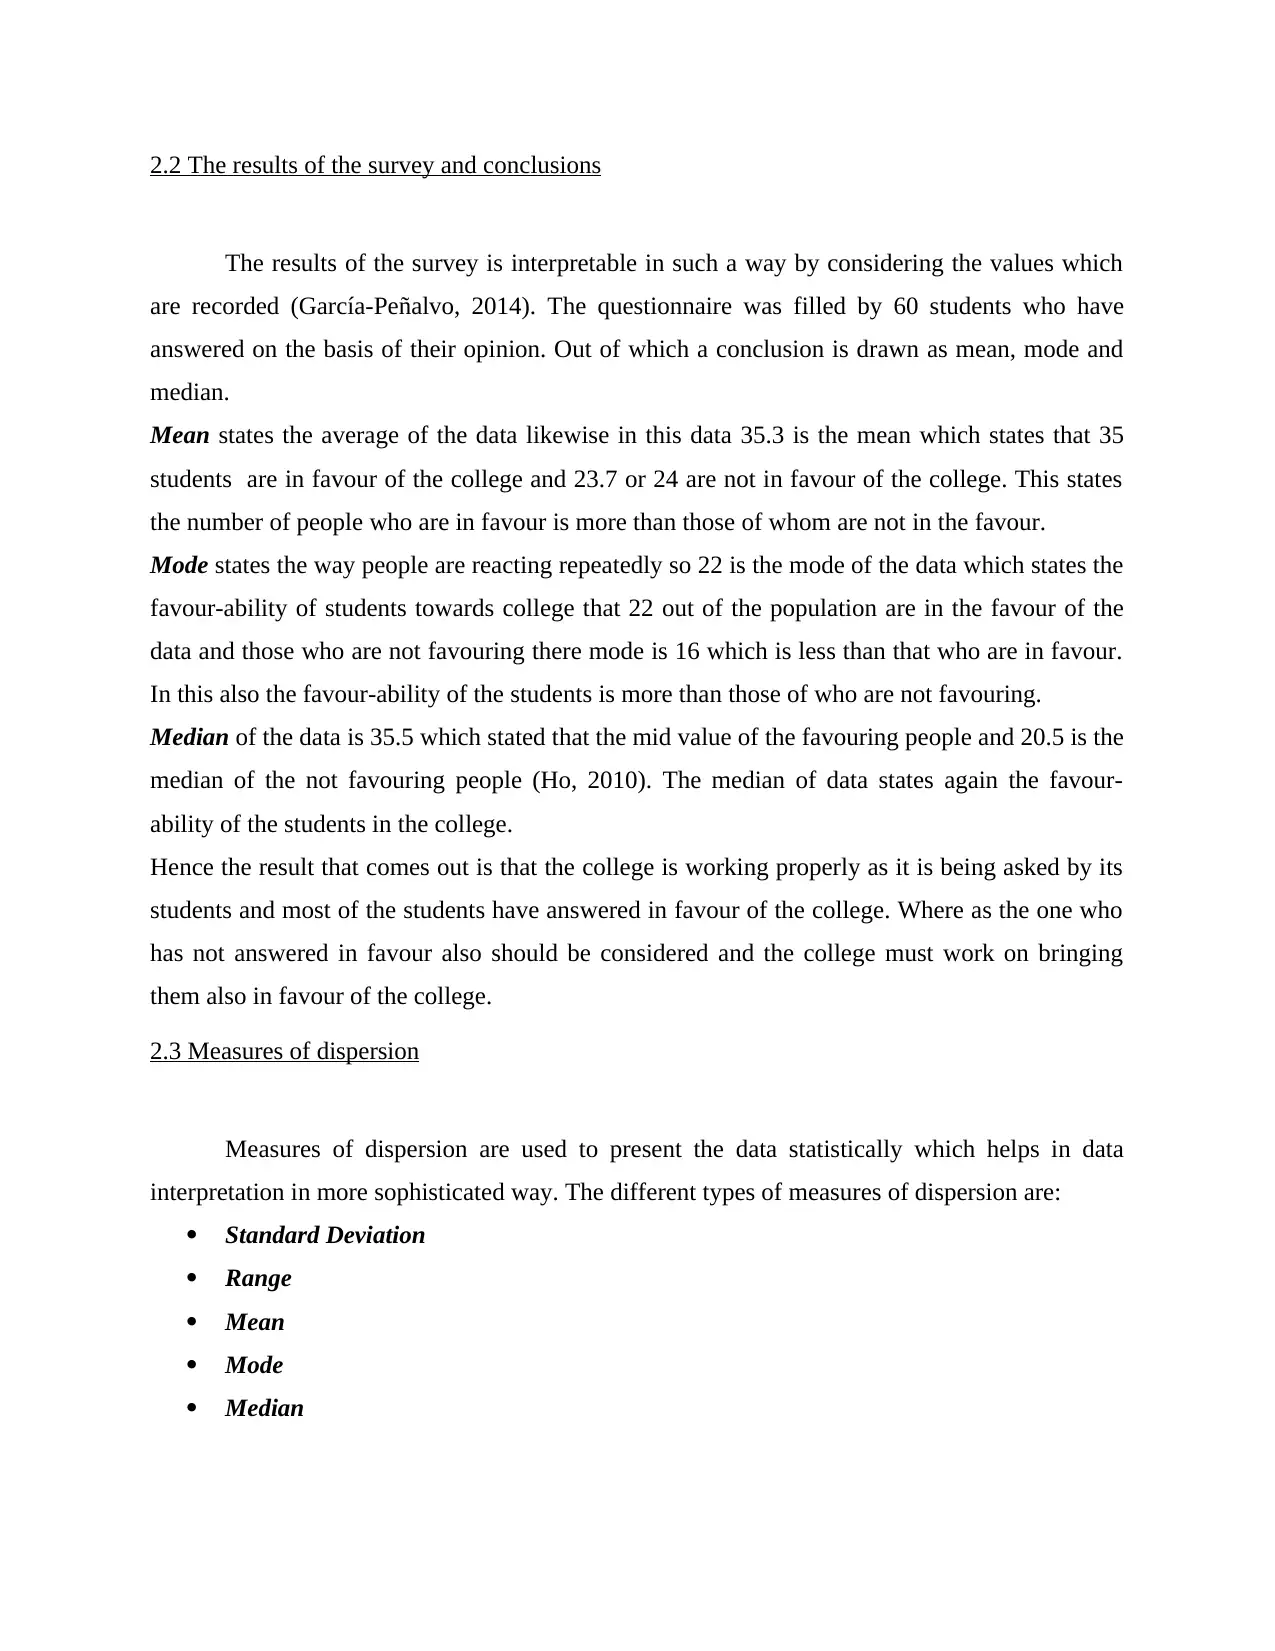
2.2 The results of the survey and conclusions
The results of the survey is interpretable in such a way by considering the values which
are recorded (García-Peñalvo, 2014). The questionnaire was filled by 60 students who have
answered on the basis of their opinion. Out of which a conclusion is drawn as mean, mode and
median.
Mean states the average of the data likewise in this data 35.3 is the mean which states that 35
students are in favour of the college and 23.7 or 24 are not in favour of the college. This states
the number of people who are in favour is more than those of whom are not in the favour.
Mode states the way people are reacting repeatedly so 22 is the mode of the data which states the
favour-ability of students towards college that 22 out of the population are in the favour of the
data and those who are not favouring there mode is 16 which is less than that who are in favour.
In this also the favour-ability of the students is more than those of who are not favouring.
Median of the data is 35.5 which stated that the mid value of the favouring people and 20.5 is the
median of the not favouring people (Ho, 2010). The median of data states again the favour-
ability of the students in the college.
Hence the result that comes out is that the college is working properly as it is being asked by its
students and most of the students have answered in favour of the college. Where as the one who
has not answered in favour also should be considered and the college must work on bringing
them also in favour of the college.
2.3 Measures of dispersion
Measures of dispersion are used to present the data statistically which helps in data
interpretation in more sophisticated way. The different types of measures of dispersion are:
Standard Deviation
Range
Mean
Mode
Median
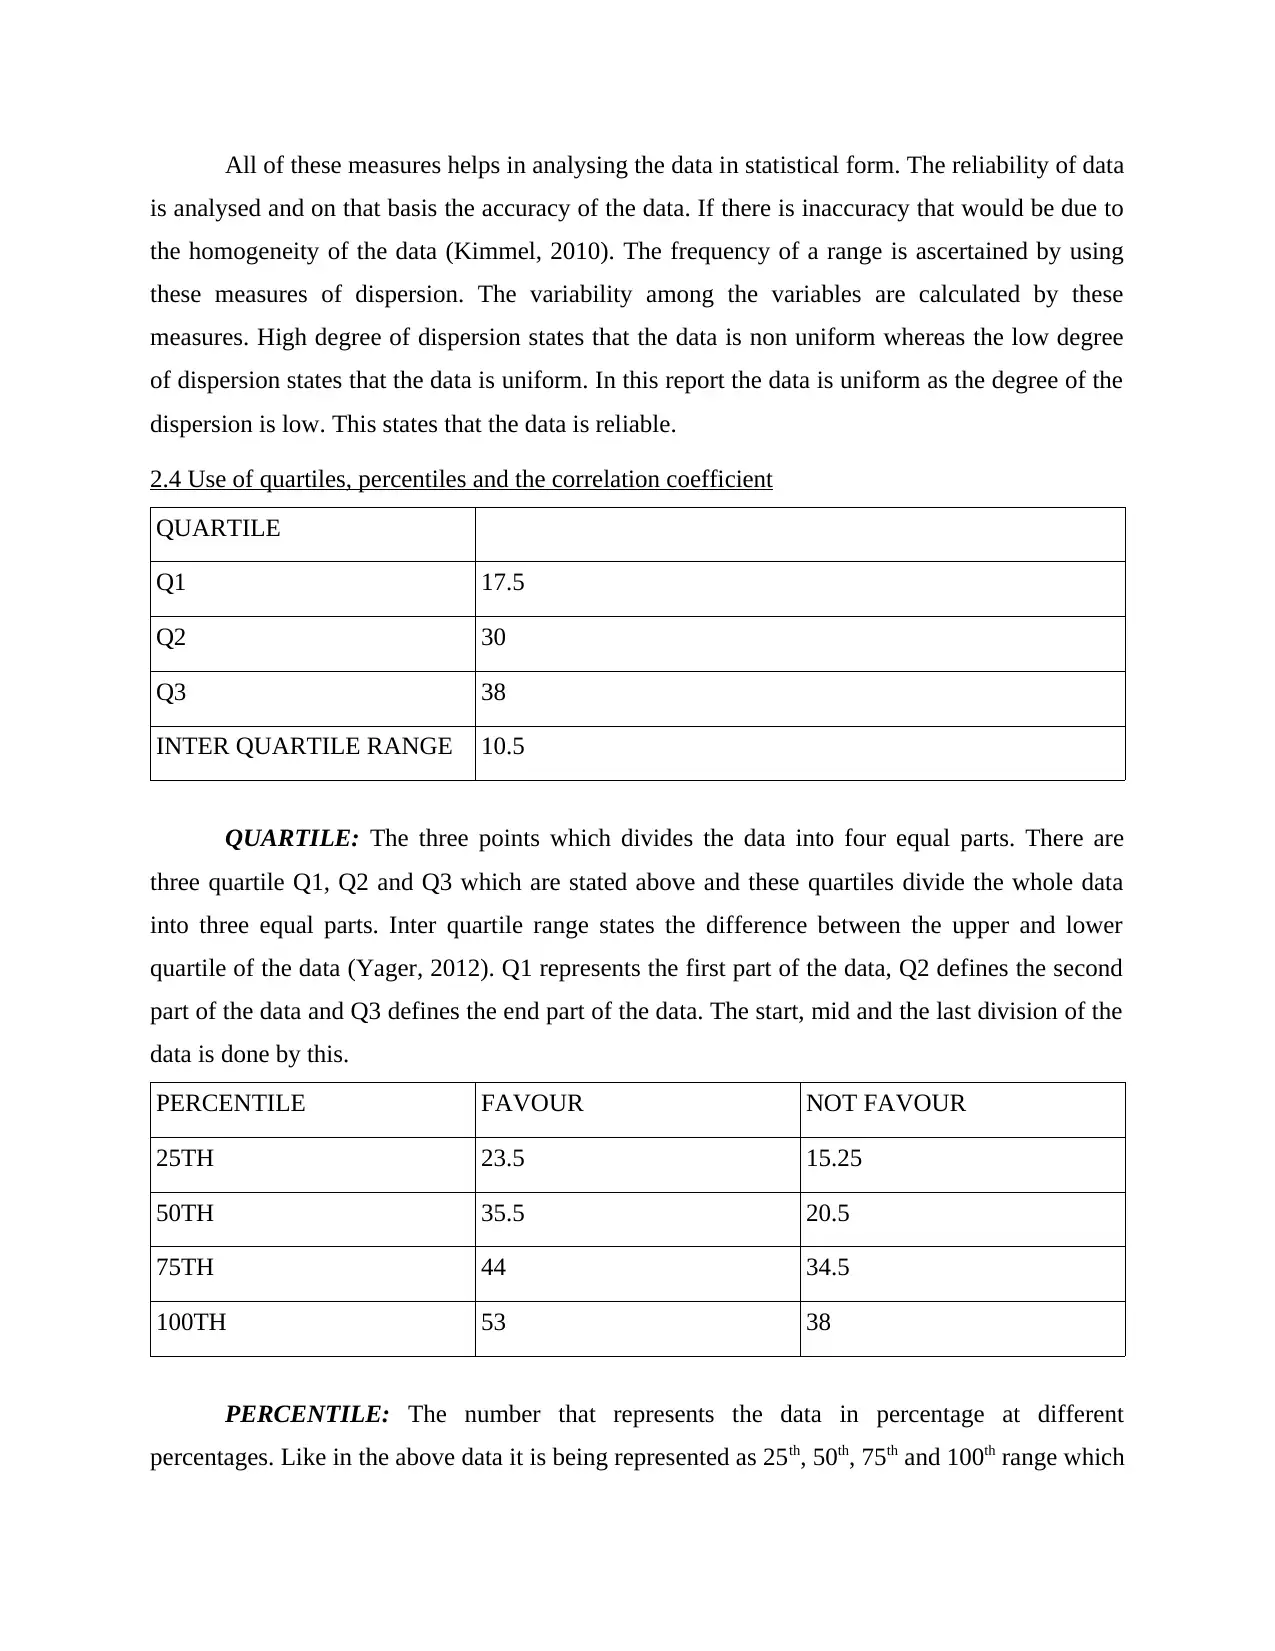
All of these measures helps in analysing the data in statistical form. The reliability of data
is analysed and on that basis the accuracy of the data. If there is inaccuracy that would be due to
the homogeneity of the data (Kimmel, 2010). The frequency of a range is ascertained by using
these measures of dispersion. The variability among the variables are calculated by these
measures. High degree of dispersion states that the data is non uniform whereas the low degree
of dispersion states that the data is uniform. In this report the data is uniform as the degree of the
dispersion is low. This states that the data is reliable.
2.4 Use of quartiles, percentiles and the correlation coefficient
QUARTILE
Q1 17.5
Q2 30
Q3 38
INTER QUARTILE RANGE 10.5
QUARTILE: The three points which divides the data into four equal parts. There are
three quartile Q1, Q2 and Q3 which are stated above and these quartiles divide the whole data
into three equal parts. Inter quartile range states the difference between the upper and lower
quartile of the data (Yager, 2012). Q1 represents the first part of the data, Q2 defines the second
part of the data and Q3 defines the end part of the data. The start, mid and the last division of the
data is done by this.
PERCENTILE FAVOUR NOT FAVOUR
25TH 23.5 15.25
50TH 35.5 20.5
75TH 44 34.5
100TH 53 38
PERCENTILE: The number that represents the data in percentage at different
percentages. Like in the above data it is being represented as 25th, 50th, 75th and 100th range which
represents the value of the data at different percentages that are defined above. Which states the
value of the data of the students who are in favour and not in favour (Vercellis, 2011).
CORRELATION= -0.96
CORRELATION: This defines the relationship between the data which is collected.
Likewise in the above data the relationship between the favouring students and the students who
are not favouring the situation. The correlation between the data is negative which states that it
have negative relation as the favour of the students and not favouring will impact the college so
it has a negative relation which states that the not favour rise can lead to decline in favouring
students.
TASK 3
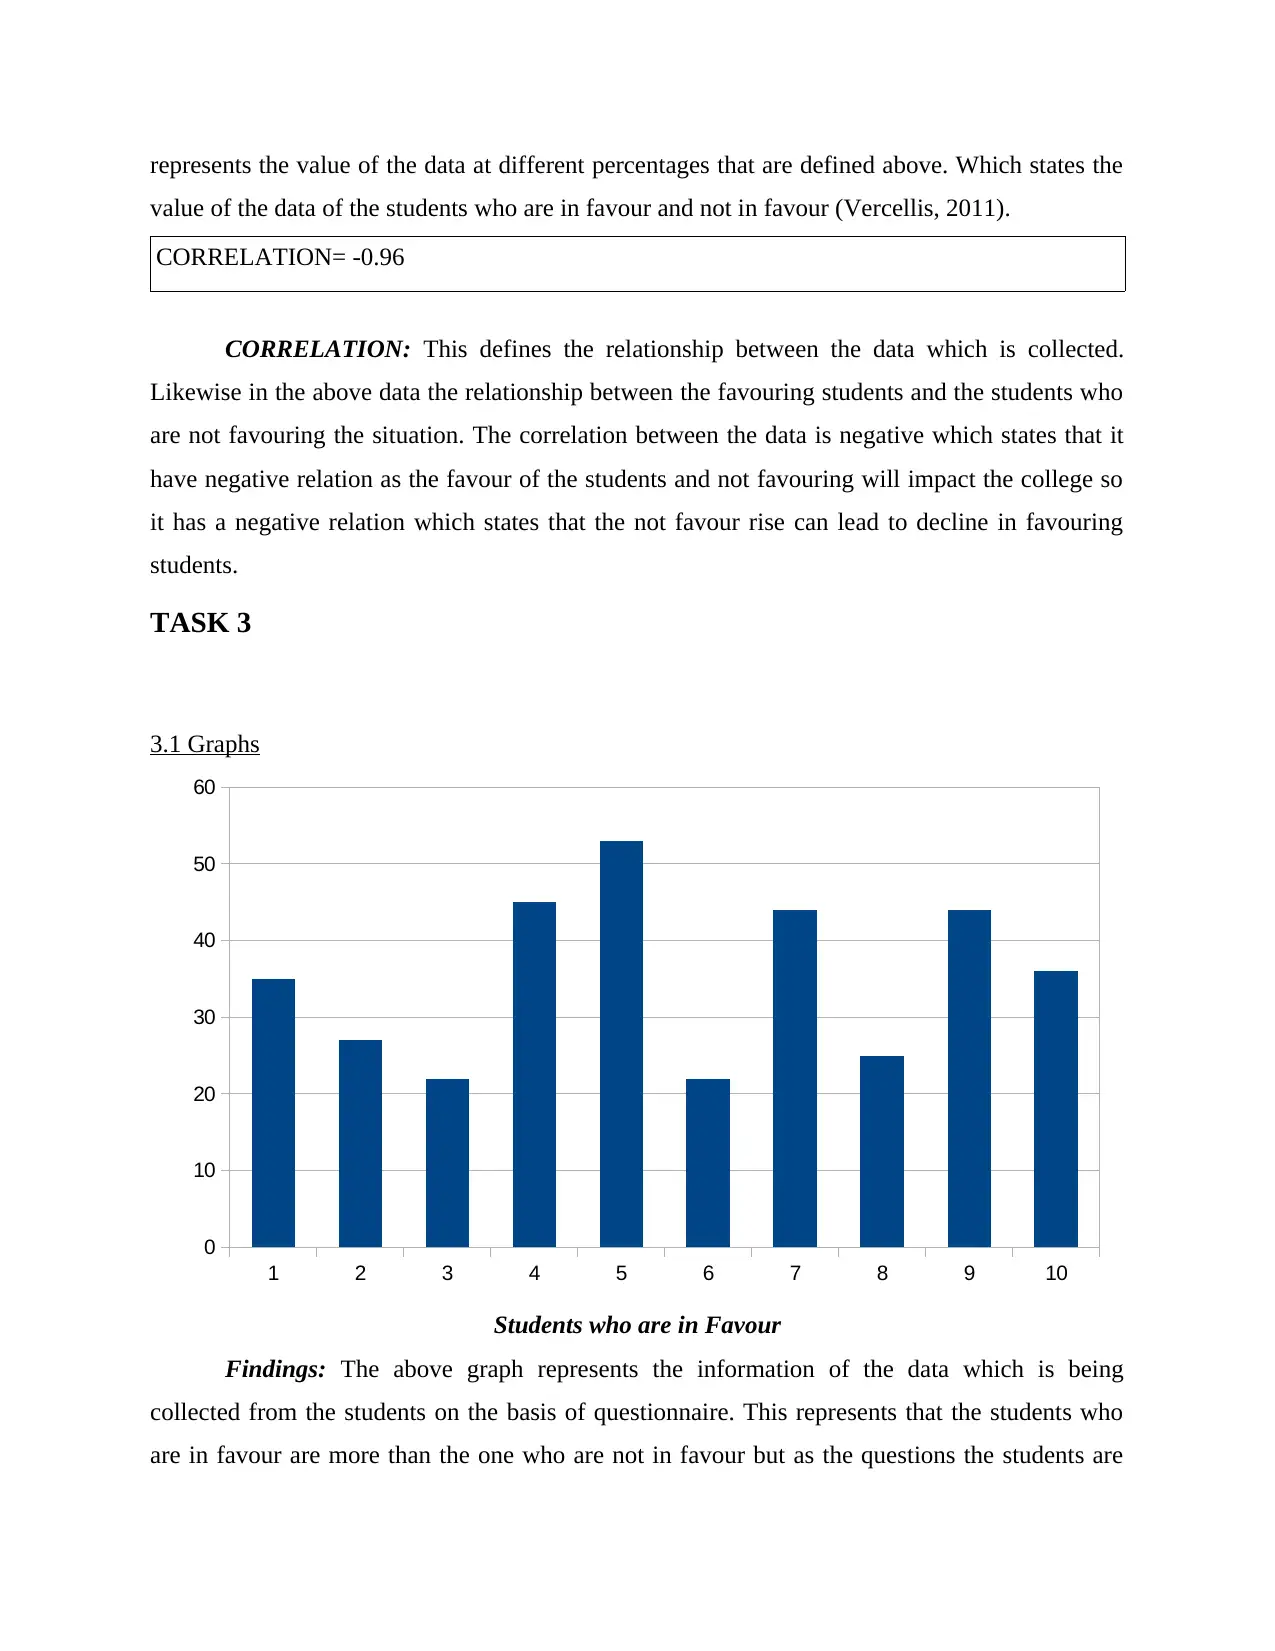
3.1 Graphs
Students who are in Favour
Findings: The above graph represents the information of the data which is being
collected from the students on the basis of questionnaire. This represents that the students who
are in favour are more than the one who are not in favour but as the questions the students are
1 2 3 4 5 6 7 8 9 10
0
10
20
30
40
50
60
value of the data of the students who are in favour and not in favour (Vercellis, 2011).
CORRELATION= -0.96
CORRELATION: This defines the relationship between the data which is collected.
Likewise in the above data the relationship between the favouring students and the students who
are not favouring the situation. The correlation between the data is negative which states that it
have negative relation as the favour of the students and not favouring will impact the college so
it has a negative relation which states that the not favour rise can lead to decline in favouring
students.
TASK 3
3.1 Graphs
Students who are in Favour
Findings: The above graph represents the information of the data which is being
collected from the students on the basis of questionnaire. This represents that the students who
are in favour are more than the one who are not in favour but as the questions the students are
1 2 3 4 5 6 7 8 9 10
0
10
20
30
40
50
60
Paraphrase This Document
Need a fresh take? Get an instant paraphrase of this document with our AI Paraphraser
very supportive in question number 5 which states that the college environment is most
appropriate according to the students. After this the major rating is given to the faculty of the
college student considers that the faculty is most appropriate in the college. Behaviour and
course completion has been given equal rating as the students thinks that they are appropriately
performed (Weygandt, 2010). The least considered in favoured student is the infrastructural
development students thinks that there is least requirement to develop that. As a conclusion from
the above graph it is being concluded that the college is operating well when it comes to opinion
of the students than most of them are in favour of the college services.
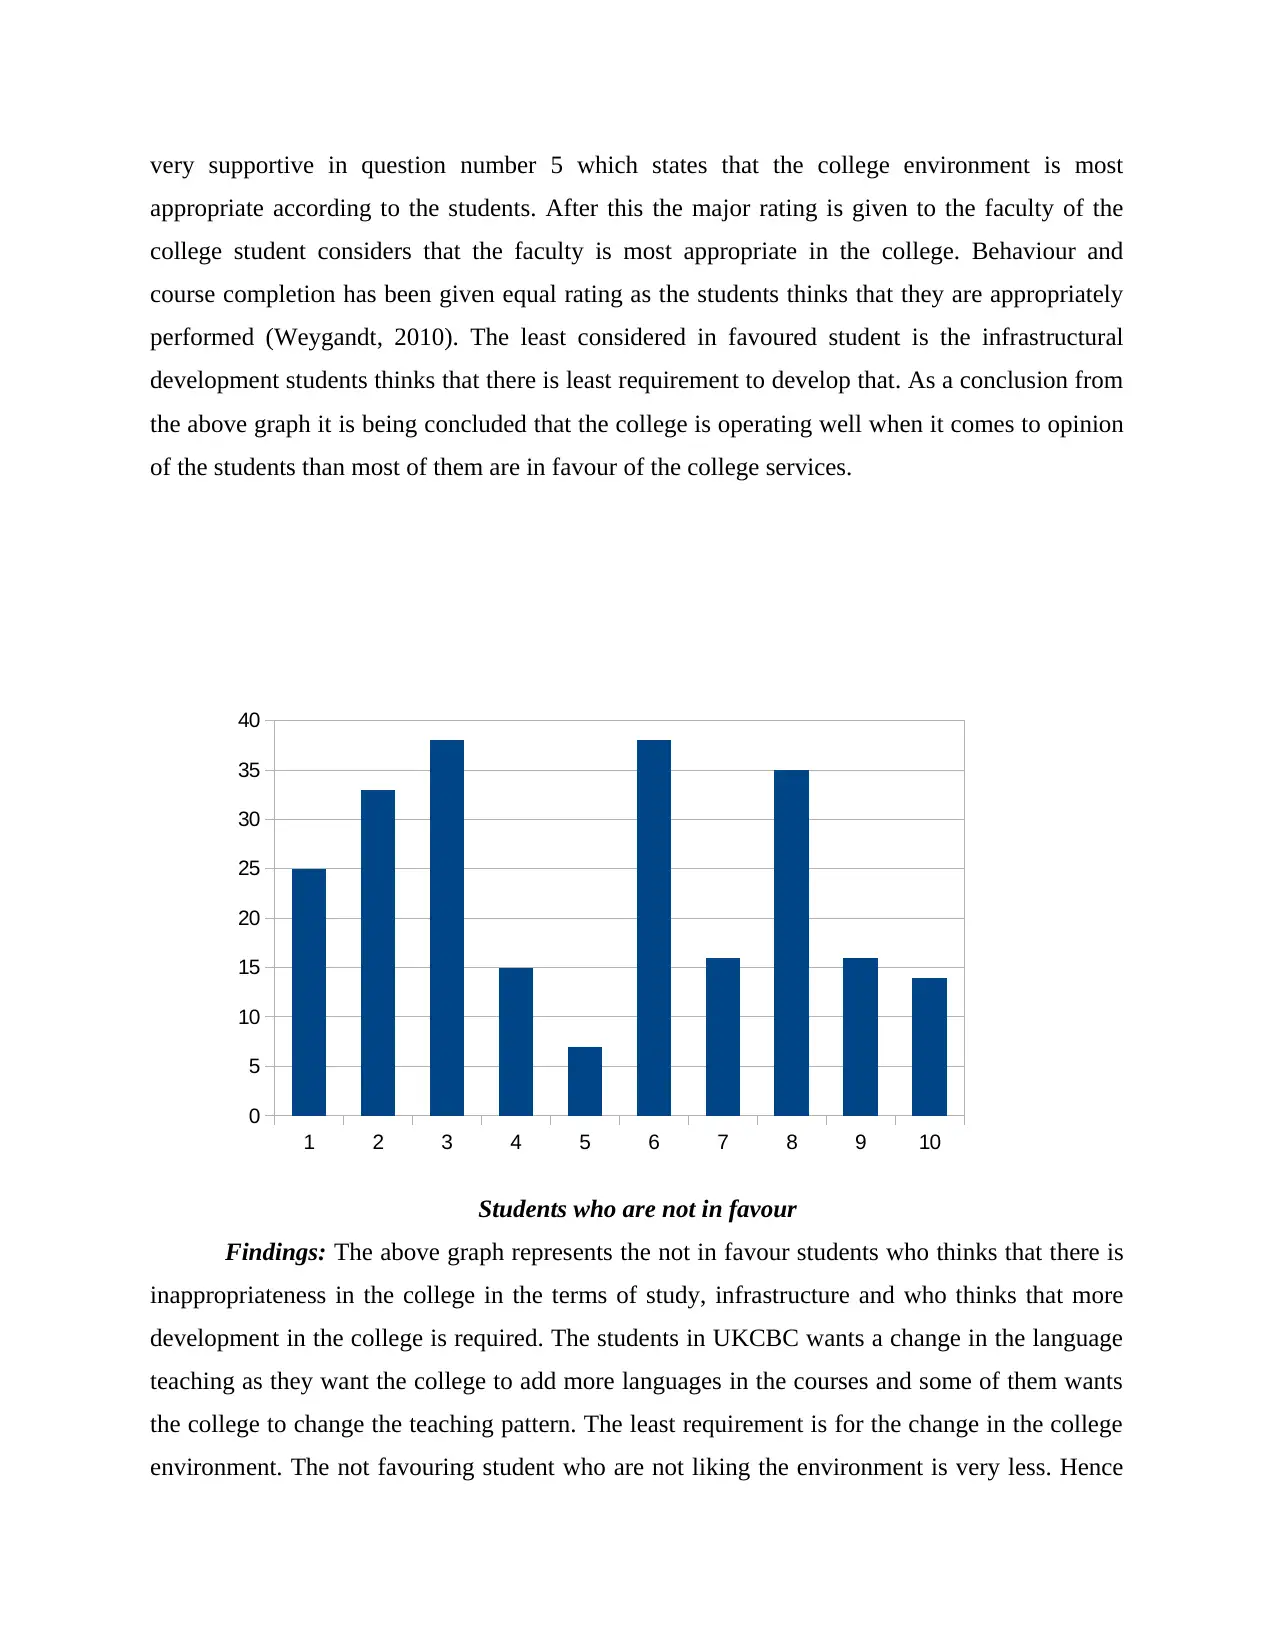
Students who are not in favour
Findings: The above graph represents the not in favour students who thinks that there is
inappropriateness in the college in the terms of study, infrastructure and who thinks that more
development in the college is required. The students in UKCBC wants a change in the language
teaching as they want the college to add more languages in the courses and some of them wants
the college to change the teaching pattern. The least requirement is for the change in the college
environment. The not favouring student who are not liking the environment is very less. Hence
1 2 3 4 5 6 7 8 9 10
0
5
10
15
20
25
30
35
40
appropriate according to the students. After this the major rating is given to the faculty of the
college student considers that the faculty is most appropriate in the college. Behaviour and
course completion has been given equal rating as the students thinks that they are appropriately
performed (Weygandt, 2010). The least considered in favoured student is the infrastructural
development students thinks that there is least requirement to develop that. As a conclusion from
the above graph it is being concluded that the college is operating well when it comes to opinion
of the students than most of them are in favour of the college services.
Students who are not in favour
Findings: The above graph represents the not in favour students who thinks that there is
inappropriateness in the college in the terms of study, infrastructure and who thinks that more
development in the college is required. The students in UKCBC wants a change in the language
teaching as they want the college to add more languages in the courses and some of them wants
the college to change the teaching pattern. The least requirement is for the change in the college
environment. The not favouring student who are not liking the environment is very less. Hence
1 2 3 4 5 6 7 8 9 10
0
5
10
15
20
25
30
35
40
the overall conclusion drawn is that the college needs to make some changes in according to
change the not favouring students into the favouring ones.
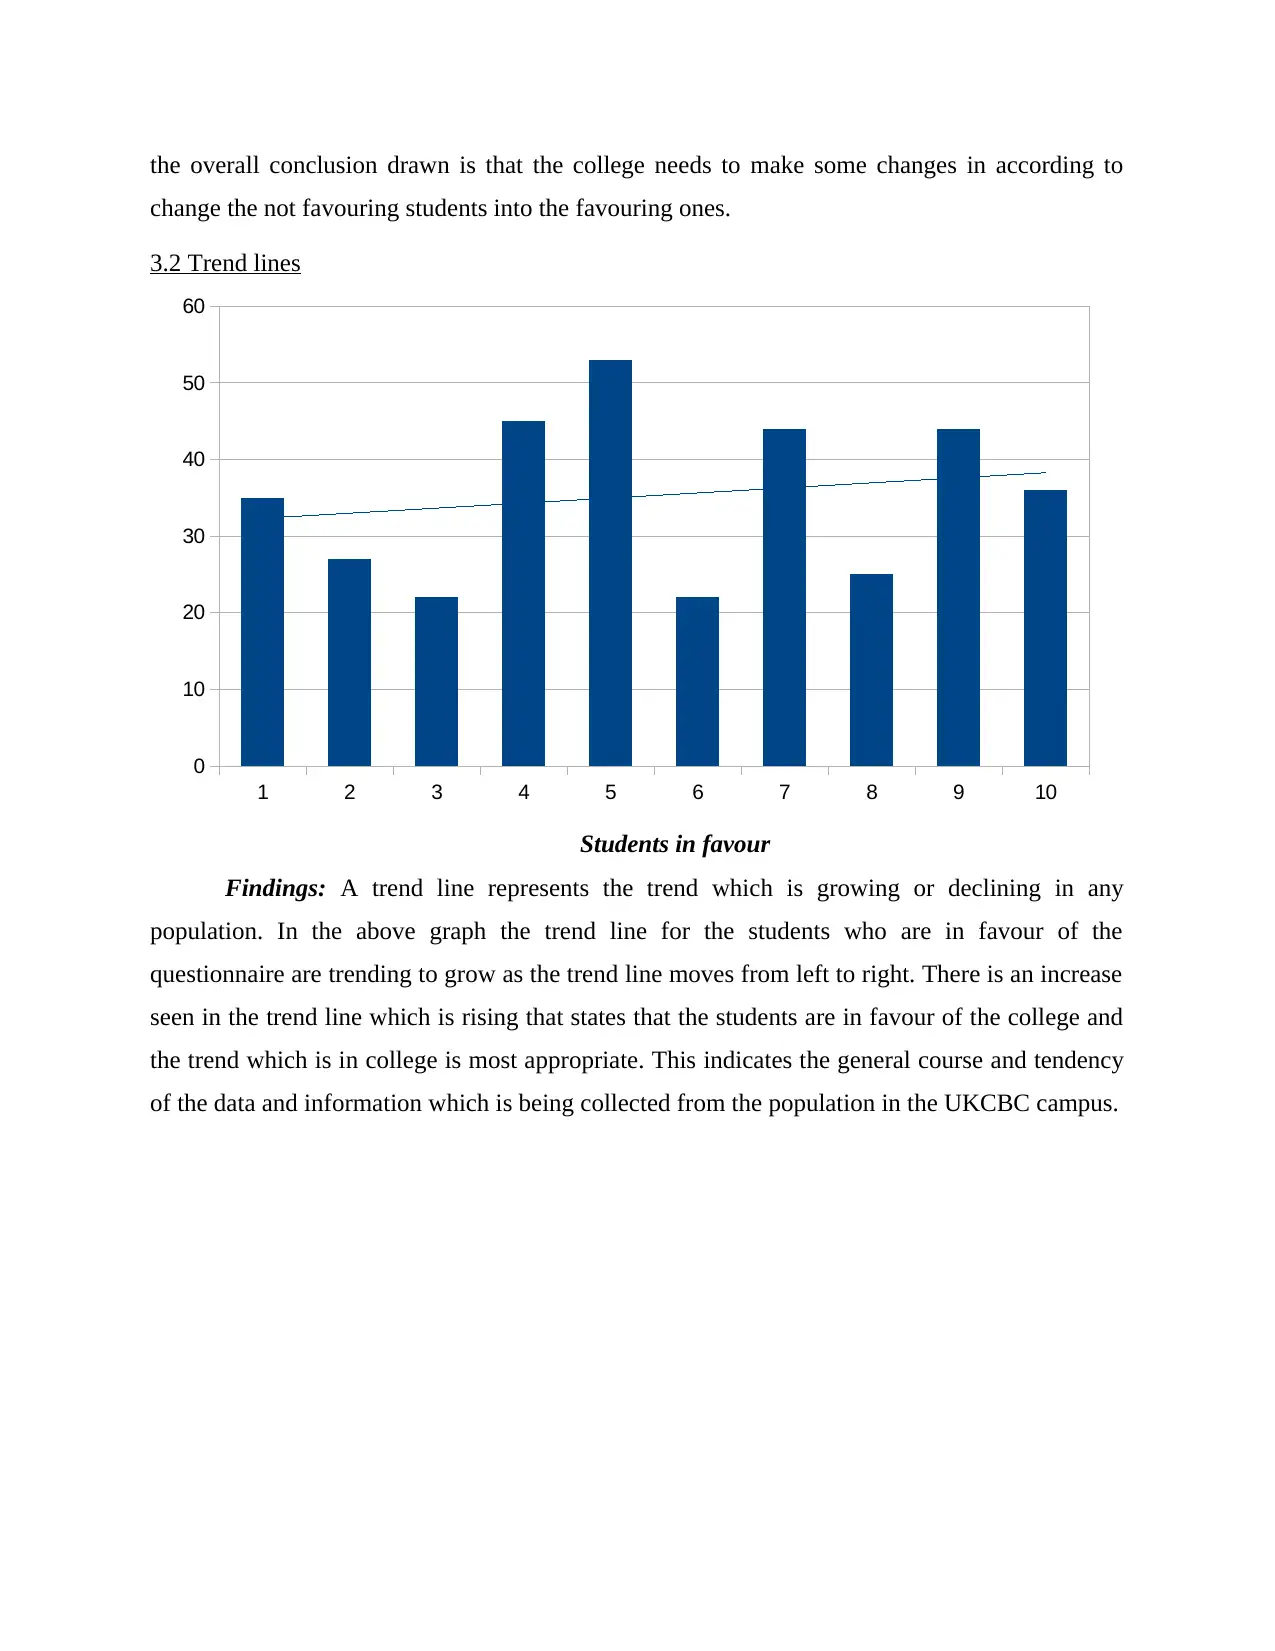
3.2 Trend lines
Students in favour
Findings: A trend line represents the trend which is growing or declining in any
population. In the above graph the trend line for the students who are in favour of the
questionnaire are trending to grow as the trend line moves from left to right. There is an increase
seen in the trend line which is rising that states that the students are in favour of the college and
the trend which is in college is most appropriate. This indicates the general course and tendency
of the data and information which is being collected from the population in the UKCBC campus.
1 2 3 4 5 6 7 8 9 10
0
10
20
30
40
50
60
change the not favouring students into the favouring ones.
3.2 Trend lines
Students in favour
Findings: A trend line represents the trend which is growing or declining in any
population. In the above graph the trend line for the students who are in favour of the
questionnaire are trending to grow as the trend line moves from left to right. There is an increase
seen in the trend line which is rising that states that the students are in favour of the college and
the trend which is in college is most appropriate. This indicates the general course and tendency
of the data and information which is being collected from the population in the UKCBC campus.
1 2 3 4 5 6 7 8 9 10
0
10
20
30
40
50
60
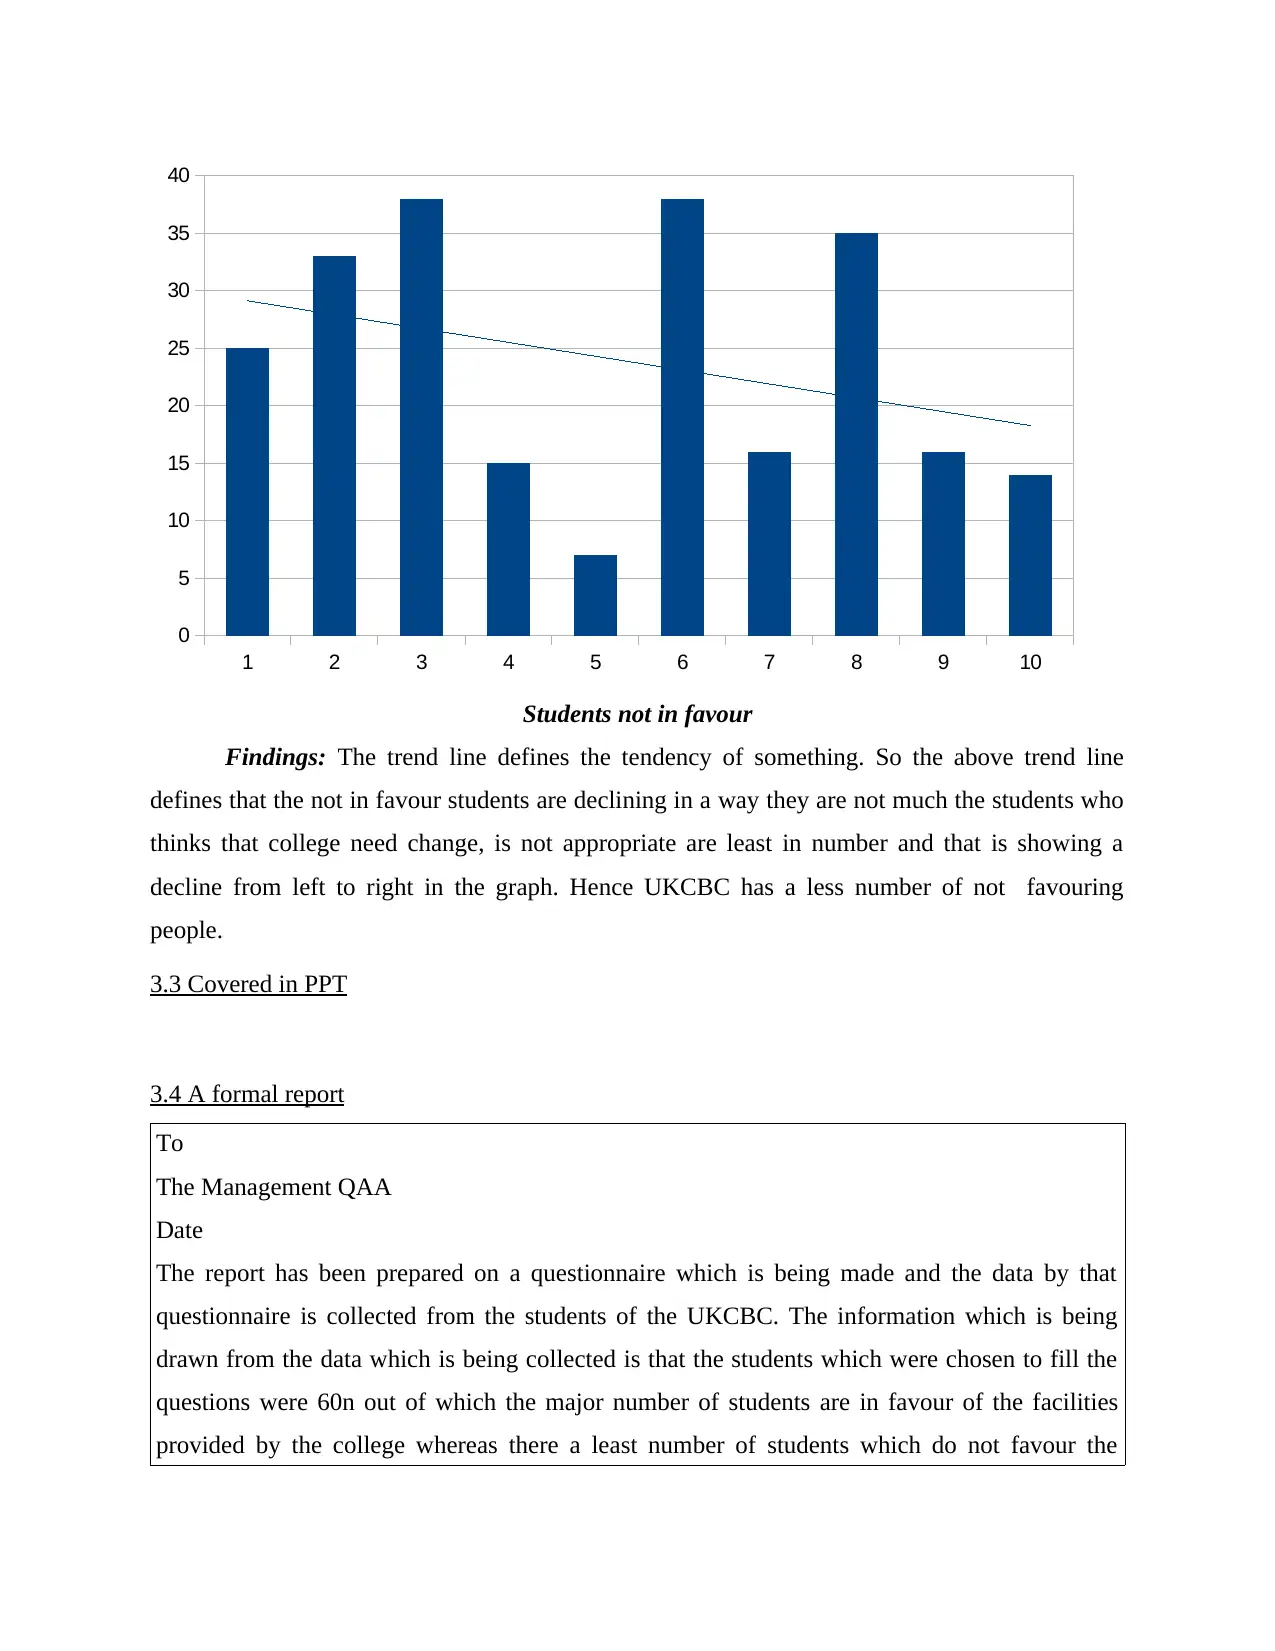
Students not in favour
Findings: The trend line defines the tendency of something. So the above trend line
defines that the not in favour students are declining in a way they are not much the students who
thinks that college need change, is not appropriate are least in number and that is showing a
decline from left to right in the graph. Hence UKCBC has a less number of not favouring
people.
3.3 Covered in PPT
3.4 A formal report
To
The Management QAA
Date
The report has been prepared on a questionnaire which is being made and the data by that
questionnaire is collected from the students of the UKCBC. The information which is being
drawn from the data which is being collected is that the students which were chosen to fill the
questions were 60n out of which the major number of students are in favour of the facilities
provided by the college whereas there a least number of students which do not favour the
1 2 3 4 5 6 7 8 9 10
0
5
10
15
20
25
30
35
40
Secure Best Marks with AI Grader
Need help grading? Try our AI Grader for instant feedback on your assignments.
facilities of the college. The data interpretation is done by using graphs, trend line, measures of
diversion and many more which states the statistical representation of the data. The college is
growing on its pace in a good way but if the consideration of the not in favour students ideas
and feedback would be done than the results which would be obtained would be tremendous
and the college will obtain a lead. The satisfactory students are also a positive way to motivate
the college's operation because it states that the college is moving in a desired direction which is
what actually needed. Hence the college can improve its performance more to have a better and
more good teaching and learning environment which could help more and more no. of students.
TASK 4
4.1 Using information processing tools
The world is trending so as and also developing. The manual calculation of the data was
used in the previous days when the technology was not there. But not using these in today's
world would be cultivation without tools. As we know that world is growing in technology and
the people across the world are using that technology because this technology makes the work
easy and possibly effective than the manual work (Ford, 2013). The accuracy of such calculation
is more reliable and efficient so at all the levels these can be use in the UKCBC college. The
usage of these tools is listed as below:
Operational level: This level of the organisation completely relates to the employees and their
working. So software to record the attendance of the employees daily, the performance rating
graphs can be made, the absenteeism of the employees can be calculated by these tools,
computer can be used to record the information which will reduce the cost of paper and the
process can proceed in a more effective and efficient manner.
Tactical level: The operations have tasks in it which are to be performed. To reduce the use of
manpower various machinery, computers and software can be used to do these tasks. For
example: Tally software, etc.
Strategical level: At the strategical level the data and information can be recorded in the
software so as to analyse and interpretate the data to make various strategies. By using the
technology the data can be recorded easily and can be calculated at as large scale as possible
which can help the organisation to make strategies.
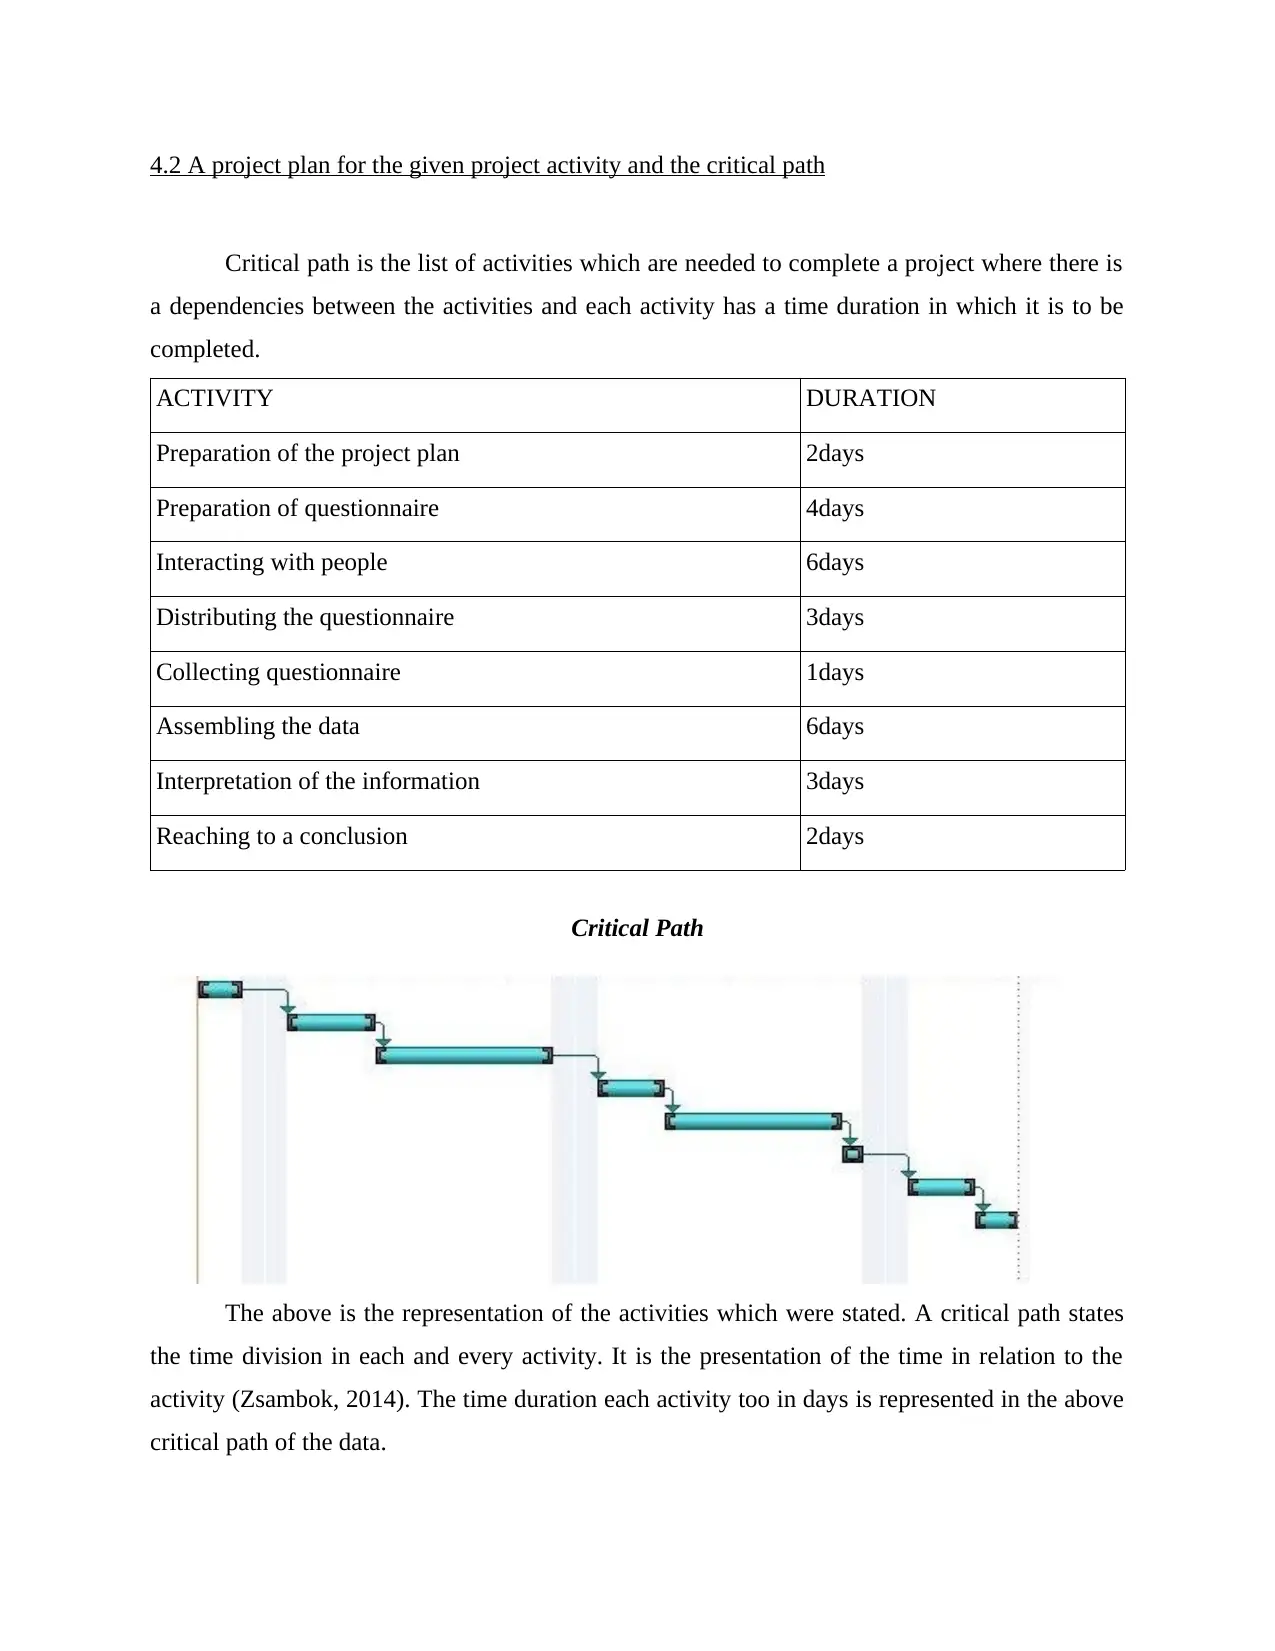
4.2 A project plan for the given project activity and the critical path
Critical path is the list of activities which are needed to complete a project where there is
a dependencies between the activities and each activity has a time duration in which it is to be
completed.
ACTIVITY DURATION
Preparation of the project plan 2days
Preparation of questionnaire 4days
Interacting with people 6days
Distributing the questionnaire 3days
Collecting questionnaire 1days
Assembling the data 6days
Interpretation of the information 3days
Reaching to a conclusion 2days
Critical Path
The above is the representation of the activities which were stated. A critical path states
the time division in each and every activity. It is the presentation of the time in relation to the
activity (Zsambok, 2014). The time duration each activity too in days is represented in the above
critical path of the data.
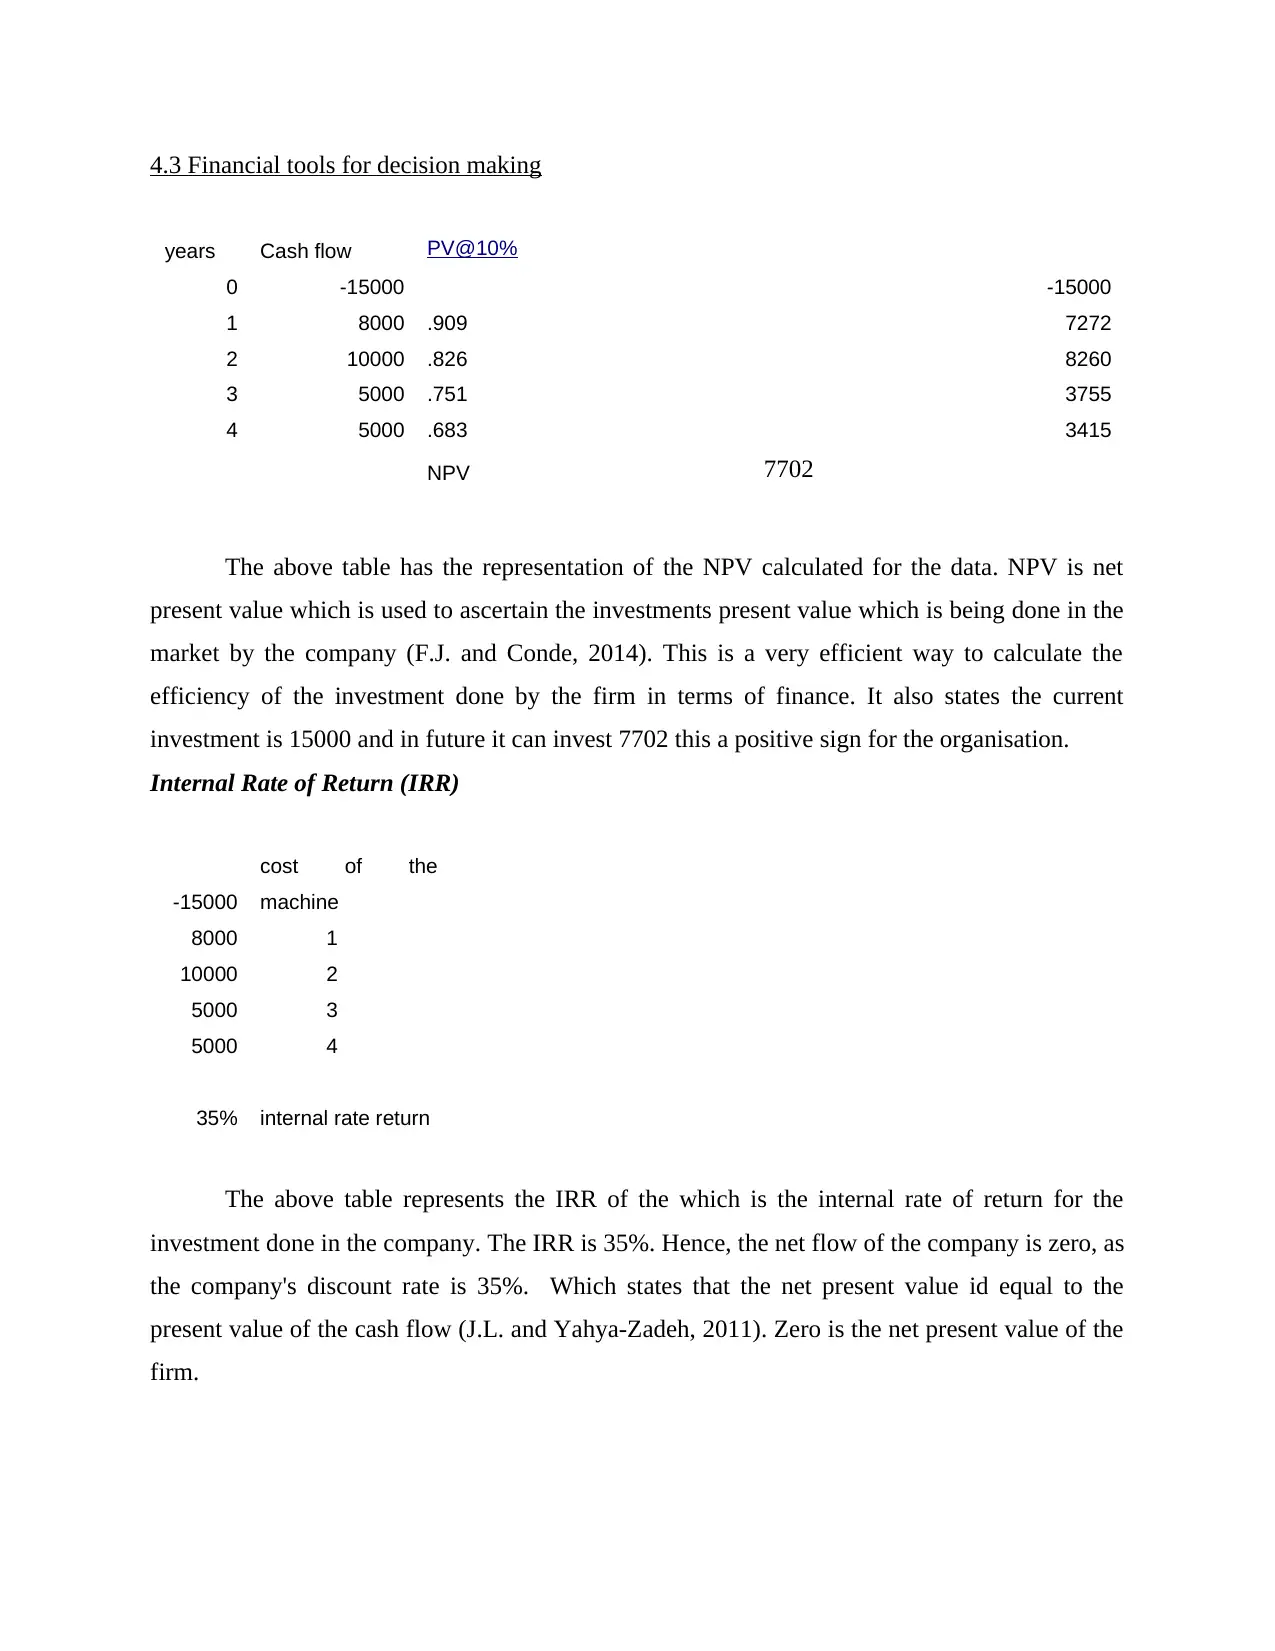
4.3 Financial tools for decision making
years Cash flow PV@10%
0 -15000 -15000
1 8000 .909 7272
2 10000 .826 8260
3 5000 .751 3755
4 5000 .683 3415
NPV 7702
The above table has the representation of the NPV calculated for the data. NPV is net
present value which is used to ascertain the investments present value which is being done in the
market by the company (F.J. and Conde, 2014). This is a very efficient way to calculate the
efficiency of the investment done by the firm in terms of finance. It also states the current
investment is 15000 and in future it can invest 7702 this a positive sign for the organisation.
Internal Rate of Return (IRR)
-15000
cost of the
machine
8000 1
10000 2
5000 3
5000 4
35% internal rate return
The above table represents the IRR of the which is the internal rate of return for the
investment done in the company. The IRR is 35%. Hence, the net flow of the company is zero, as
the company's discount rate is 35%. Which states that the net present value id equal to the
present value of the cash flow (J.L. and Yahya-Zadeh, 2011). Zero is the net present value of the
firm.
Paraphrase This Document
Need a fresh take? Get an instant paraphrase of this document with our AI Paraphraser
CONCLUSION
The above report represents state of UKCBC which is to be presented to the OAA
planning team which will help the college to improve and excel according to the analysation. All
the important measures are calculated in this report which could help a firm to have the best
statistical report. In this report IRR and NPV is also calculated so as to have the investment
details and the best possible result. It is being concluded by this report that how these elements
are important and can effect the decision making of any for or organisation to have best plans
and strategies.
1 out of 20
Related Documents


Your All-in-One AI-Powered Toolkit for Academic Success.
+13062052269
info@desklib.com
Available 24*7 on WhatsApp / Email
![[object Object]](/_next/static/media/star-bottom.7253800d.svg)
Unlock your academic potential
© 2024 | Zucol Services PVT LTD | All rights reserved.