Research Report on Analyzing Data
29 Pages4077 Words41 Views
Added on 2019-12-03
Research Report on Analyzing Data
Added on 2019-12-03
ShareRelated Documents
BUSINESS DECISION
MAKING
MAKING

TABLE OF CONTENTS
Introduction......................................................................................................................................4
Task 1...............................................................................................................................................4
1.1 Collection of primary and secondary data.............................................................................4
1.2 Survey Methodology.............................................................................................................4
1.3 Questionnaire.........................................................................................................................5
Task 2...............................................................................................................................................7
2.1 Create Information for the decision making..........................................................................7
2.2 Analyze the results...............................................................................................................12
2.3 Measures of Dispersion.......................................................................................................13
2.4 Quartiles, percentiles and Correlation.................................................................................13
Task 3.............................................................................................................................................14
3.1 Graphs through spreadsheets...............................................................................................14
3.2 Trend line through spread sheet...........................................................................................20
3.4 Formal Business Report.......................................................................................................22
Task 4.............................................................................................................................................23
4.1 Use of appropriate information processing tools.................................................................23
4.2 Preparation of project Plan..................................................................................................23
4.3 Use of financial tools...........................................................................................................25
Conclusion.....................................................................................................................................28
References......................................................................................................................................29
LIST OF TABLES
Table 1: Descriptive statistics for Sainsbury Sales..........................................................................9
Table 2: Descriptive statistics for Sainsbury’s operating profits...................................................10
Table 3: Descriptive statistics for Tesco Sales..............................................................................11
Table 4: Descriptive statistics for Tesco operating profit..............................................................11
Table 5: Computation of quartile and percentile of Sainsbury......................................................13
Table 6: Table 4: Computation of quartile and percentile of Tesco..............................................13
Table 7: Correlation Coefficient for Sales- Sainsbury..................................................................14
Table 8: Correlation Coefficient for Sales- Tesco.........................................................................14
Table 9: Frequency distribution of sales - Sainsbury....................................................................16
Table 10: Frequency distribution of operating profit Sainsbury...................................................17
Table 11: Frequency distribution table for sales Tesco.................................................................19
Table 12: Frequency distribution table for operating profit..........................................................19
Table 13: Activities of Network Diagram.....................................................................................23
Table 14: Time Schedule...............................................................................................................23
Table 15: NPV for project A.........................................................................................................26
Table 16: NPV for project B..........................................................................................................26
Table 17: IRR calculation of project A and B...............................................................................28
LIST OF FIGURES
Figure 1 Network Diagram............................................................................................................24
Figure 2: Gantt chart......................................................................................................................25
Introduction
Business decision making is a complex process. The purpose of this research report is to
understand a range of techniques for the purpose of analyzing the data effectively. It will shows
how software generated information can be used to make decisions.
Task 1
1.1 Collection of primary and secondary data
Primary Data – Primary data is the first hand information that is available for use. The
data related to Sainsbury will be collected from customers by using the approach of
questionnaire. It is fresh and raw in nature. A semi-structured questionnaire will be
prepared which will be consist of open ended and close ended questions (Aksoy, Ozturk
and Sucky, 2012). This technique is appropriate because it helps in collecting the relevant
and accurate information.
Secondary Data – It is the second hand information that is available from sources such as
books, journals, newspapers etc. For this research, secondary data will be compiled from
financial statements of Sainsbury and Tesco. All sources of information will be valid and
authentic (Freedman, Pisani and Purves, 2007).
Following research questions have been addressed:
What is the level of satisfaction amongst Sainsbury’s customers?
What has been the relationship between operating profit and sales for Sainsbury over the
last 25 years?
Series of logical steps for data collection
Preparing questionnaire
Applying sampling technique
Collecting responses
Filtering the information
Selecting the right questionnaires
Data evaluation
Quantitative data
In order to evaluate the quantitative data, sales and operating profits of the Sainsbury
have been collected (Hedgebeth, 2007). For the purpose of evaluation descriptive statistics have
been used. Measures like correlation, quartile and range have been used for quantitative analysis.
Sampling
Sampling is performed to identify the representative sample from which the primary data
can be collected. For this study, data will be collected by applying the combination of purposive
and convenience sampling (Freedman, Pisani and Purves, 2007). These are appropriate because
they help in selecting the sample on the basis of the requirements and judgment.
Population and Sample size
A sample size of 50 respondents have been kept for this research. It is appropriate
because the research is of descriptive nature.
1.2 Survey Methodology
Survey methodology defines the framework under which the research is to be carried out.
Under survey methodology, questionnaire approach will be used. A set of questionnaire will be
distributed among the customers of Sainsbury. This will help in understanding their perception
towards company’s goods and services (Jaisankar, 2009). It will consist of open ended and close
ended questions. The approach will help in collecting a large volume of data from the mass
population.
Sampling is an activity which is designed to identify the representative sample of
population from which the desired information is to be collected. The data collection task
becomes simpler and easier because of sampling. There are two types of sampling methods
which includes probability and non- probability techniques (Newbold and et. al., 2009). For this
research, respondents will be selected through random sampling outside the stores of Sainsbury.
It is appropriate for the study because it selects the sample by avoiding personal biasness.
There are some ethical issues which are to be considered while course of research. The
goals and objectives of study will be properly communicated to the participants before starting
the survey process (Hedgebeth, 2007). Their identity will not be disclosed without their prior
approval. The entire secondary data will be collected from valid and authentic sources. Complete
information will be kept in a private and confidential manner.
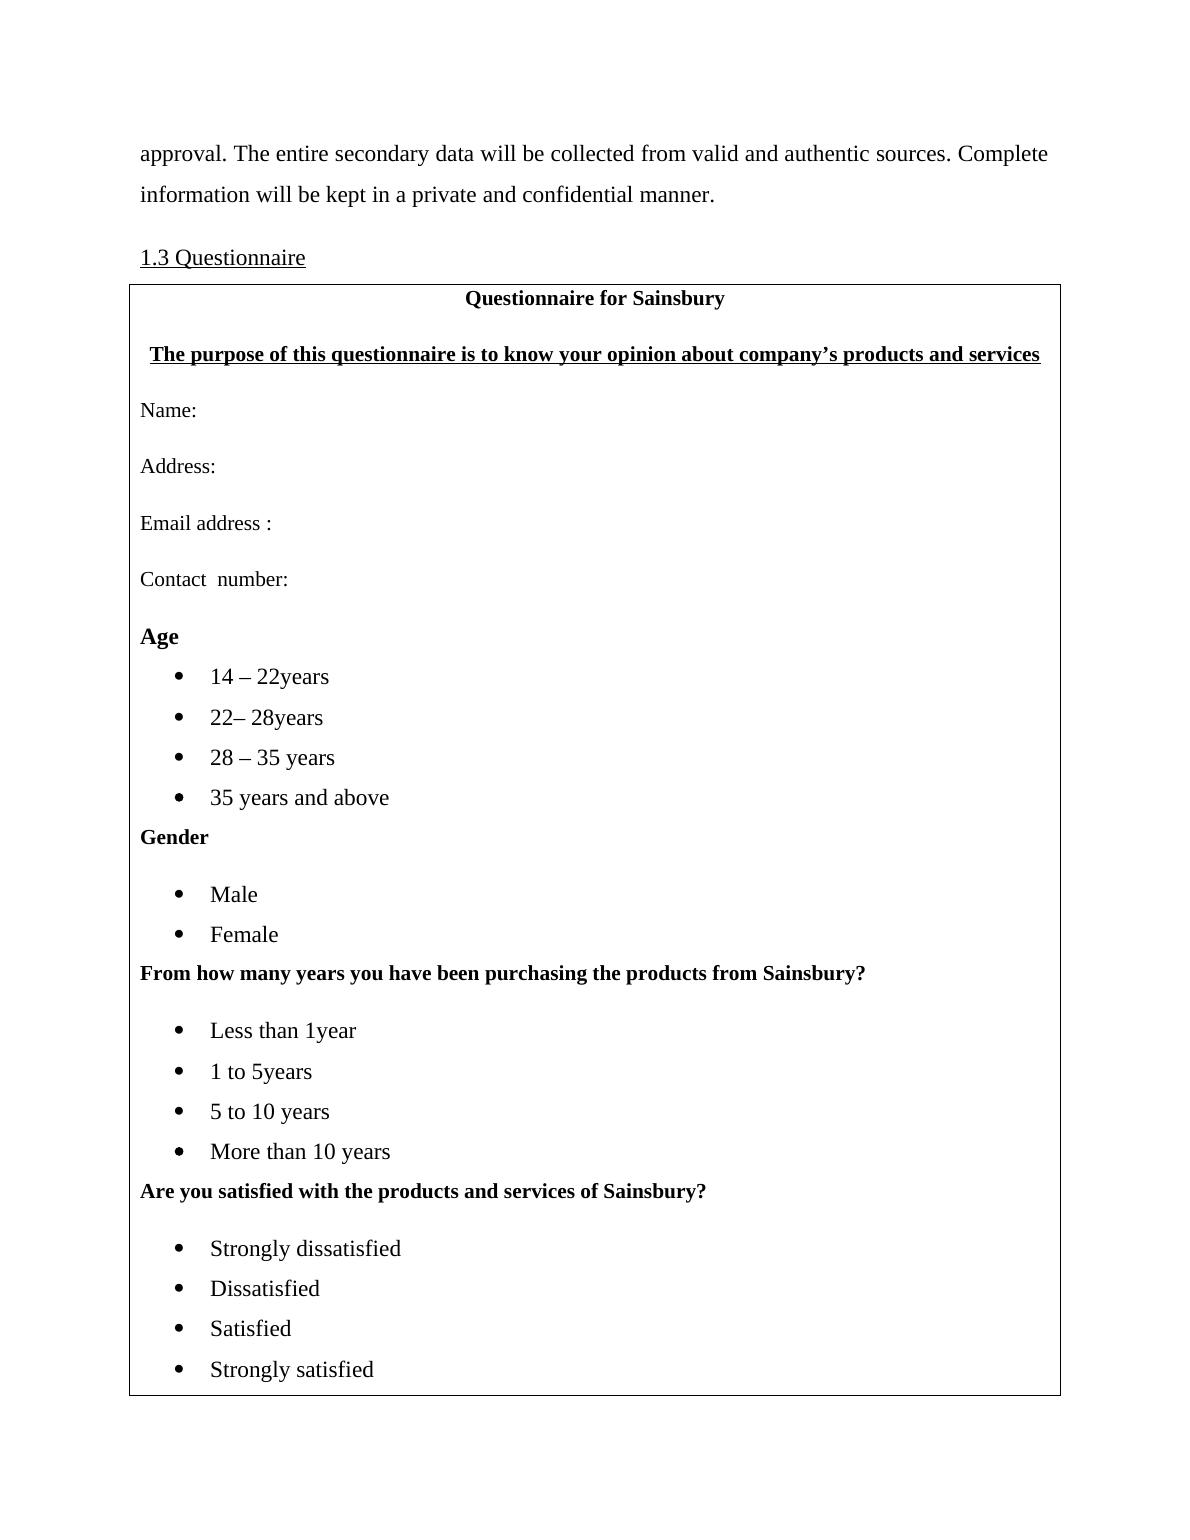
1.3 Questionnaire
Questionnaire for Sainsbury
The purpose of this questionnaire is to know your opinion about company’s products and
services
Name:
Address:
Email address :
Contact number:
Age
14 – 22years
22– 28years
28 – 35 years
35 years and above
Gender
Male
Female
From how many years you have been purchasing the products from Sainsbury?
Less than 1year
1 to 5years
5 to 10 years
More than 10 years
Are you satisfied with the products and services of Sainsbury?
Strongly dissatisfied
Dissatisfied
information will be kept in a private and confidential manner.
1.3 Questionnaire
Questionnaire for Sainsbury
The purpose of this questionnaire is to know your opinion about company’s products and
services
Name:
Address:
Email address :
Contact number:
Age
14 – 22years
22– 28years
28 – 35 years
35 years and above
Gender
Male
Female
From how many years you have been purchasing the products from Sainsbury?
Less than 1year
1 to 5years
5 to 10 years
More than 10 years
Are you satisfied with the products and services of Sainsbury?
Strongly dissatisfied
Dissatisfied
End of preview
Want to access all the pages? Upload your documents or become a member.
Related Documents
Tesco Business Decision Makinglg...
|27
|5608
|160
Statistical Tools Report - Morrisonlg...
|24
|4790
|51
Business Decision Making Assignment Solution (pdf)lg...
|21
|4946
|386
Business Decision Making - Sample Assignmentlg...
|45
|8376
|161
Business Decision Making - Tescolg...
|28
|5940
|232
Use of Primary and Secondary Sources of Data : Reportlg...
|22
|4530
|56