Tesco Business Decision Making
27 Pages5608 Words160 Views
Added on 2020-01-21
Tesco Business Decision Making
Added on 2020-01-21
ShareRelated Documents
BUSINESS DECISIONMAKING

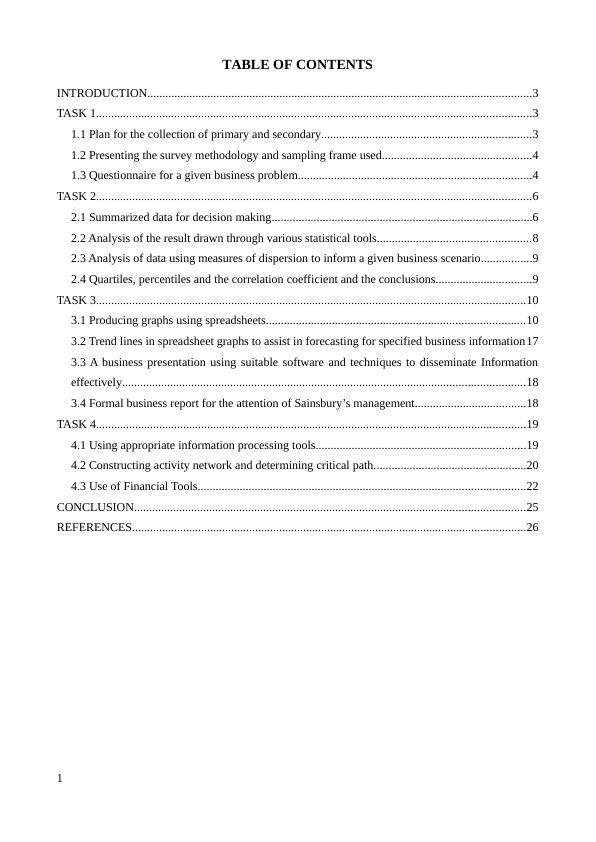
TABLE OF CONTENTSINTRODUCTION................................................................................................................................3TASK 1.................................................................................................................................................31.1 Plan for the collection of primary and secondary......................................................................31.2 Presenting the survey methodology and sampling frame used..................................................41.3 Questionnaire for a given business problem..............................................................................4TASK 2.................................................................................................................................................62.1 Summarized data for decision making.......................................................................................62.2 Analysis of the result drawn through various statistical tools...................................................82.3 Analysis of data using measures of dispersion to inform a given business scenario.................92.4 Quartiles, percentiles and the correlation coefficient and the conclusions................................9TASK 3...............................................................................................................................................103.1 Producing graphs using spreadsheets......................................................................................103.2 Trend lines in spreadsheet graphs to assist in forecasting for specified business information173.3 A business presentation using suitable software and techniques to disseminate Informationeffectively......................................................................................................................................183.4 Formal business report for the attention of Sainsbury’s management.....................................18TASK 4...............................................................................................................................................194.1 Using appropriate information processing tools......................................................................194.2 Constructing activity network and determining critical path...................................................204.3 Use of Financial Tools.............................................................................................................22CONCLUSION..................................................................................................................................25REFERENCES...................................................................................................................................261
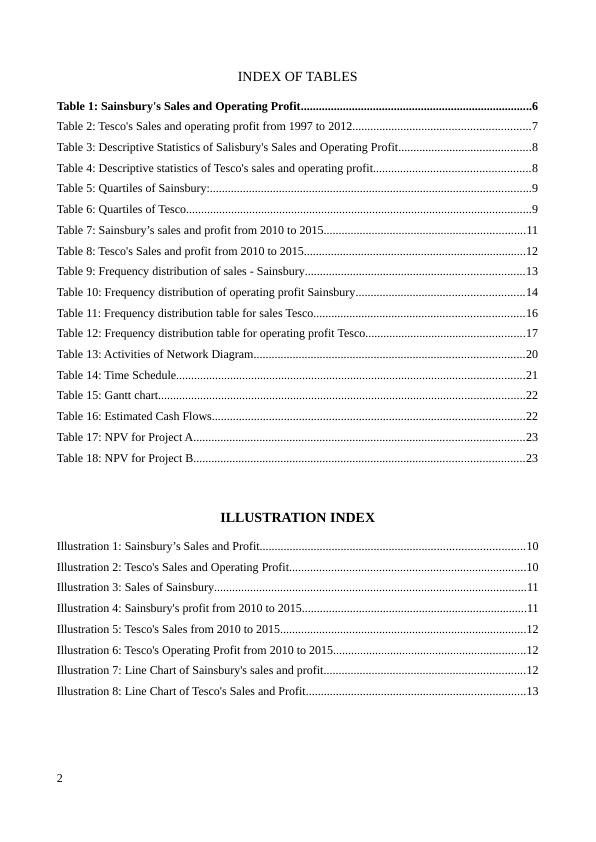
INDEX OF TABLESTable 1: Sainsbury's Sales and Operating Profit.............................................................................6Table 2: Tesco's Sales and operating profit from 1997 to 2012...........................................................7Table 3: Descriptive Statistics of Salisbury's Sales and Operating Profit............................................8Table 4: Descriptive statistics of Tesco's sales and operating profit....................................................8Table 5: Quartiles of Sainsbury:...........................................................................................................9Table 6: Quartiles of Tesco...................................................................................................................9Table 7: Sainsbury’s sales and profit from 2010 to 2015...................................................................11Table 8: Tesco's Sales and profit from 2010 to 2015..........................................................................12Table 9: Frequency distribution of sales - Sainsbury.........................................................................13Table 10: Frequency distribution of operating profit Sainsbury........................................................14Table 11: Frequency distribution table for sales Tesco......................................................................16Table 12: Frequency distribution table for operating profit Tesco.....................................................17Table 13: Activities of Network Diagram..........................................................................................20Table 14: Time Schedule....................................................................................................................21Table 15: Gantt chart..........................................................................................................................22Table 16: Estimated Cash Flows........................................................................................................22Table 17: NPV for Project A..............................................................................................................23Table 18: NPV for Project B..............................................................................................................23ILLUSTRATION INDEXIllustration 1: Sainsbury’s Sales and Profit........................................................................................10Illustration 2: Tesco's Sales and Operating Profit...............................................................................10Illustration 3: Sales of Sainsbury........................................................................................................11Illustration 4: Sainsbury's profit from 2010 to 2015...........................................................................11Illustration 5: Tesco's Sales from 2010 to 2015..................................................................................12Illustration 6: Tesco's Operating Profit from 2010 to 2015................................................................12Illustration 7: Line Chart of Sainsbury's sales and profit...................................................................12Illustration 8: Line Chart of Tesco's Sales and Profit.........................................................................132
INTRODUCTIONDecision making is the crucial component of any business enterprise. Based on the dataavailable, business analytics gain insight and drive the business planning to resolve its marketsituations. For this, an authentic and reliable data is required. The present report focuses on theperformance of the UK's largest retailers Salisbury's last 16 years performance in market andchecking reliability of the statement given by it in reference to its uphold among consumers(Kimmel, Weygandt and Kieso, 2010). It is meant to assess the performance by preparing the planfor the data collection, the surveying from customers for feedback by preparing questionnaire. Thereport also depicts its performance of last 1 and half decade’s by comparing with its closestcompetitor using some statistical tools like central means of tendency, measures of dispersion intabular form and their comparative analysis. Coefficient of correlation is also referred to check thedependency of sales and operating profit of the company.TASK 11.1 Plan for the collection of primary and secondaryResearch is a systematic investigation and the study of data to derive some important factsand conclusions (Ferrell, Fraedrich and Ferrell, 2014). An authentic data is the prerequisite for anyresearch. Data can be procured in various ways namely primary data and secondary data(Christiansen and Varnes, 2008). Data collection for J. Sainsbury plc can be done in followingways:Primary sources: Primary data is very fresh and raw in nature. For this study, data will be collectedfrom customers through using the approach of questionnaire. A semi-structured questionnaire willbe prepared consisting of open ended and close ended questions. It is suitable because it helps incollecting large volume of reliable information (Pech and Durden, 2003). However the researchermust not show any kind of biasness while the process of survey. The respondents must be allowedto express their views and thoughts with complete liberty. Secondary Sources: Data used which is collected by the other means is the secondary data (Riceand Jr, 1983). These data are not self-evident they are the reports or the documents created by someother researchers. There are many secondary sources of data collection like market reports,Company's operational performances by various Analytics, Internet. Only reliable and authenticsecondary source of information are to be used for research (Christiansen and Varnes, 2008). Following research questions have been framed:Whether customers are satisfied from the Sainsbury’s products and services or not?What is the relationship between sales and operating in case of Sainsbury?3
Series of logical steps of data collection Preparation of questionnaire Performing sampling Deriving responses Filtration of dataData evaluation (Majumdar, 2014)1.2 Presenting the survey methodology and sampling frame usedSurvey methodology is the data collection technique improve the business situation bymethods such as questionnaires prepared for customers to get the feedback (Pimentel, Kuntz andElenkov, 2010). It defines the framework under which the research is to be performed. In case ofthis study, questionnaire approach has been used. Some of set of questionnaires will be distributedamong the customers of Sainsbury. The main purpose is to derive the perception of people towardsthe company’s goods and service (Pimentel, Kuntz and Elenkov, 2010). During the survey process,the identity of the respondents must not be disclosed without their prior approval. The aim of thesurvey process must be communicated to them in clear manner before starting it. Sampling is an activity which is performed to select the population sample from which thedesired information is to be collected. The research activities becomes easier and simpler due tosampling (Woodside, 2005). There are mainly two types of sampling which includes probability andnon- probability techniques. Here the method used is Random sampling method. Respondents areselected on the basis of random approach outside the stores of Sainsbury. It is suitable because ithelps in selecting the sample by avoiding the personal biasness. Both qualitative and quantitativeapproach has been kept for this study (Pech and Durden, 2003). Descriptive analysis will be usedand methods like quartile, correlation and range will be applied. The collected information will bekept secretive and there will not be any misrepresentation of facts and figures. Population and sample size A sample size of 50 respondents have been kept for this study. It is appropriate and it isexpected that it will help in achieving the aim and objectives of the research. 1.3 Questionnaire for a given business problemQuestionnaire prepared to know the consumer's feedback and to make the necessary changesis as follows:GenderMaleFemale4
Age Groupbelow 1818- 3535-60above 60From how long you are using our products?From before 20 years10 years5 yearsless than 5 yearsRate our product as per our product satiate your needs?ExcellentgoodsatisfactoryNot satisfactoryWhat influences you more to buy our product?Qualityproduct linepriceaccessibilityHow frequently do you buy the company's products?weeklyMonthly OccasionallyHow do you rate our products in comparison to our nearest competitors?GoodfairindifferentNot satisfactoryWhat suggestion would you like to give so that we come up with better product line to satisfy youmore?________________________________________________________________5
End of preview
Want to access all the pages? Upload your documents or become a member.
Related Documents
Research Report on Analyzing Datalg...
|29
|4077
|41
Business Decision Making - Tescolg...
|28
|5940
|232
Statistical Tools Report - Morrisonlg...
|24
|4790
|51
Business Decision Making Assignment TESCOlg...
|26
|6333
|54
Business Decision Making Assignment Solution (pdf)lg...
|21
|4946
|386
Marketing Research Report - Supreme Plclg...
|28
|4409
|45