BUSINESS FINANCE 11 BUSINESS FINANCE Part 1: ASX200 AGL.AX ($A) ANZ.AX ($A) WBC.AX ($A)
VerifiedAdded on 2022/10/17
|11
|1838
|486
AI Summary
A standard deviation of 0.05 is the measure of the variance between the standard deviation ($A) and the weighted average of the weighted average of the weighted average of the weighted average of the weighted average of the weighted average of the weighted average of the weighted average of the weighted average of the weighted average of the weighted average of the weighted average of the weighted average of the weighted average of the weighted average of the weighted average of the weighted average of the weighted average of the weighted average of the weighted average
Contribute Materials
Your contribution can guide someone’s learning journey. Share your
documents today.

BUSINESS FINANCE 1
BUSINESS FINANCE
BUSINESS FINANCE
Secure Best Marks with AI Grader
Need help grading? Try our AI Grader for instant feedback on your assignments.

BUSINESS FINANCE 2
Contents
Part 1:.........................................................................................................................................3
Part a:......................................................................................................................................3
Part b:......................................................................................................................................4
Part 2:.........................................................................................................................................4
Part a:......................................................................................................................................4
Part c:......................................................................................................................................5
Part 3:.........................................................................................................................................5
Part a:......................................................................................................................................5
Part b:......................................................................................................................................5
Part 4:.........................................................................................................................................6
Part a:......................................................................................................................................6
Part b:......................................................................................................................................7
References..................................................................................................................................8
BUSINESS FINANCE 3
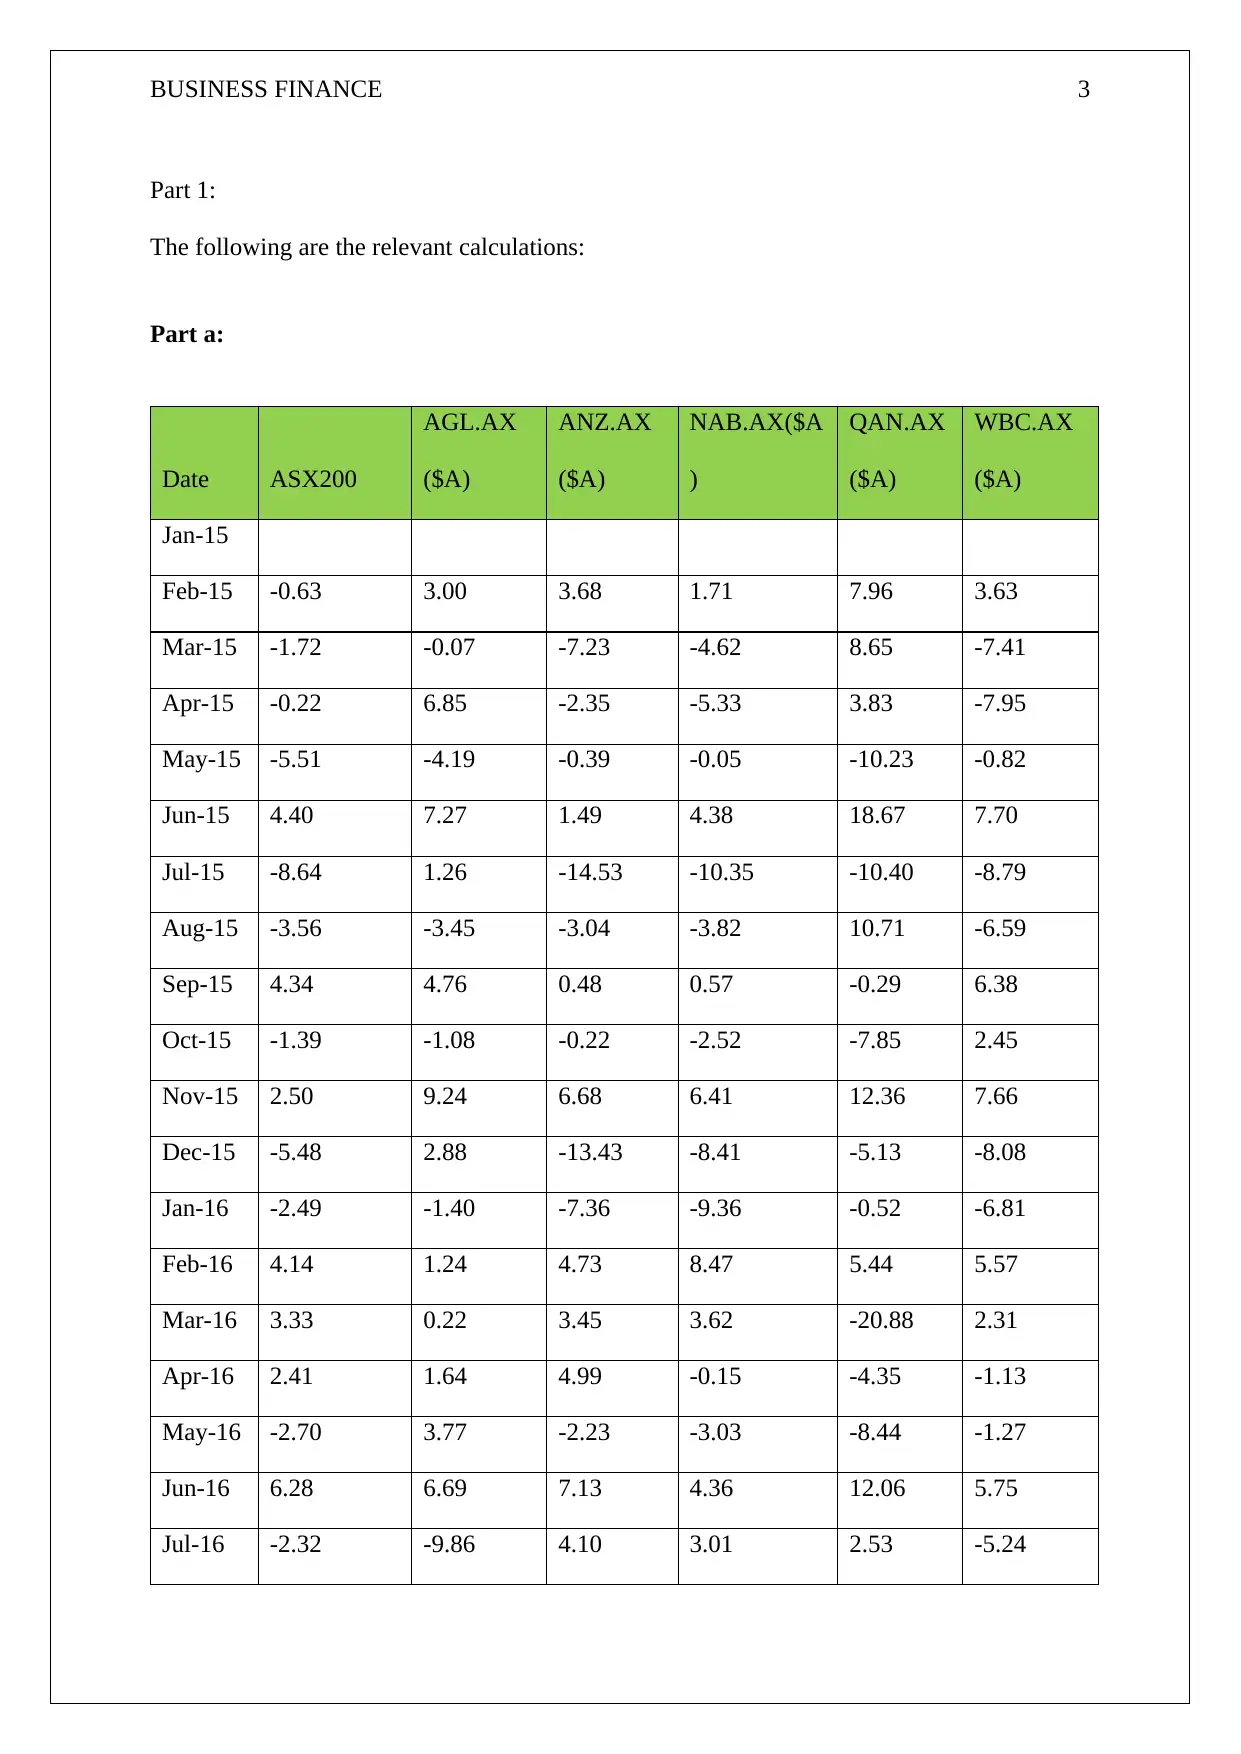
Part 1:
The following are the relevant calculations:
Part a:
Date ASX200
AGL.AX
($A)
ANZ.AX
($A)
NAB.AX($A
)
QAN.AX
($A)
WBC.AX
($A)
Jan-15
Feb-15 -0.63 3.00 3.68 1.71 7.96 3.63
Mar-15 -1.72 -0.07 -7.23 -4.62 8.65 -7.41
Apr-15 -0.22 6.85 -2.35 -5.33 3.83 -7.95
May-15 -5.51 -4.19 -0.39 -0.05 -10.23 -0.82
Jun-15 4.40 7.27 1.49 4.38 18.67 7.70
Jul-15 -8.64 1.26 -14.53 -10.35 -10.40 -8.79
Aug-15 -3.56 -3.45 -3.04 -3.82 10.71 -6.59
Sep-15 4.34 4.76 0.48 0.57 -0.29 6.38
Oct-15 -1.39 -1.08 -0.22 -2.52 -7.85 2.45
Nov-15 2.50 9.24 6.68 6.41 12.36 7.66
Dec-15 -5.48 2.88 -13.43 -8.41 -5.13 -8.08
Jan-16 -2.49 -1.40 -7.36 -9.36 -0.52 -6.81
Feb-16 4.14 1.24 4.73 8.47 5.44 5.57
Mar-16 3.33 0.22 3.45 3.62 -20.88 2.31
Apr-16 2.41 1.64 4.99 -0.15 -4.35 -1.13
May-16 -2.70 3.77 -2.23 -3.03 -8.44 -1.27
Jun-16 6.28 6.69 7.13 4.36 12.06 5.75
Jul-16 -2.32 -9.86 4.10 3.01 2.53 -5.24
BUSINESS FINANCE 4
Aug-16 0.05 4.66 2.71 1.94 -3.70 0.17
Sep-16 -2.17 0.68 0.80 0.47 0.14 3.25
Oct-16 2.31 9.38 2.01 3.32 7.84 2.63
Nov-16 4.14 5.29 10.19 6.49 0.91 6.43
Dec-16 -0.79 2.31 -3.71 2.12 2.40 -1.83
Jan-17 1.62 6.73 5.50 5.47 9.97 6.28
Feb-17 2.67 11.19 2.98 4.22 3.73 4.04
Mar-17 1.01 1.48 2.95 1.98 11.07 0.00
Apr-17 -3.37 -1.53 -14.50 -11.41 18.16 -13.01
May-17 -0.05 -3.23 5.28 1.31 14.17 3.04
Jun-17 -0.02 -5.49 3.17 1.22 -6.99 4.29
Jul-17 -0.11 -0.46 -0.78 0.83 7.52 -1.73
Aug-17 -0.58 -0.46 0.68 4.30 1.92 2.08
Sep-17 4.00 8.13 1.08 3.68 6.81 3.35
Oct-17 1.03 -1.11 -4.88 -9.40 -7.80 -4.61
Nov-17 1.59 -2.52 3.72 3.16 -11.11 2.52
Dec-17 -0.45 -3.78 -0.56 -1.49 4.56 -1.24
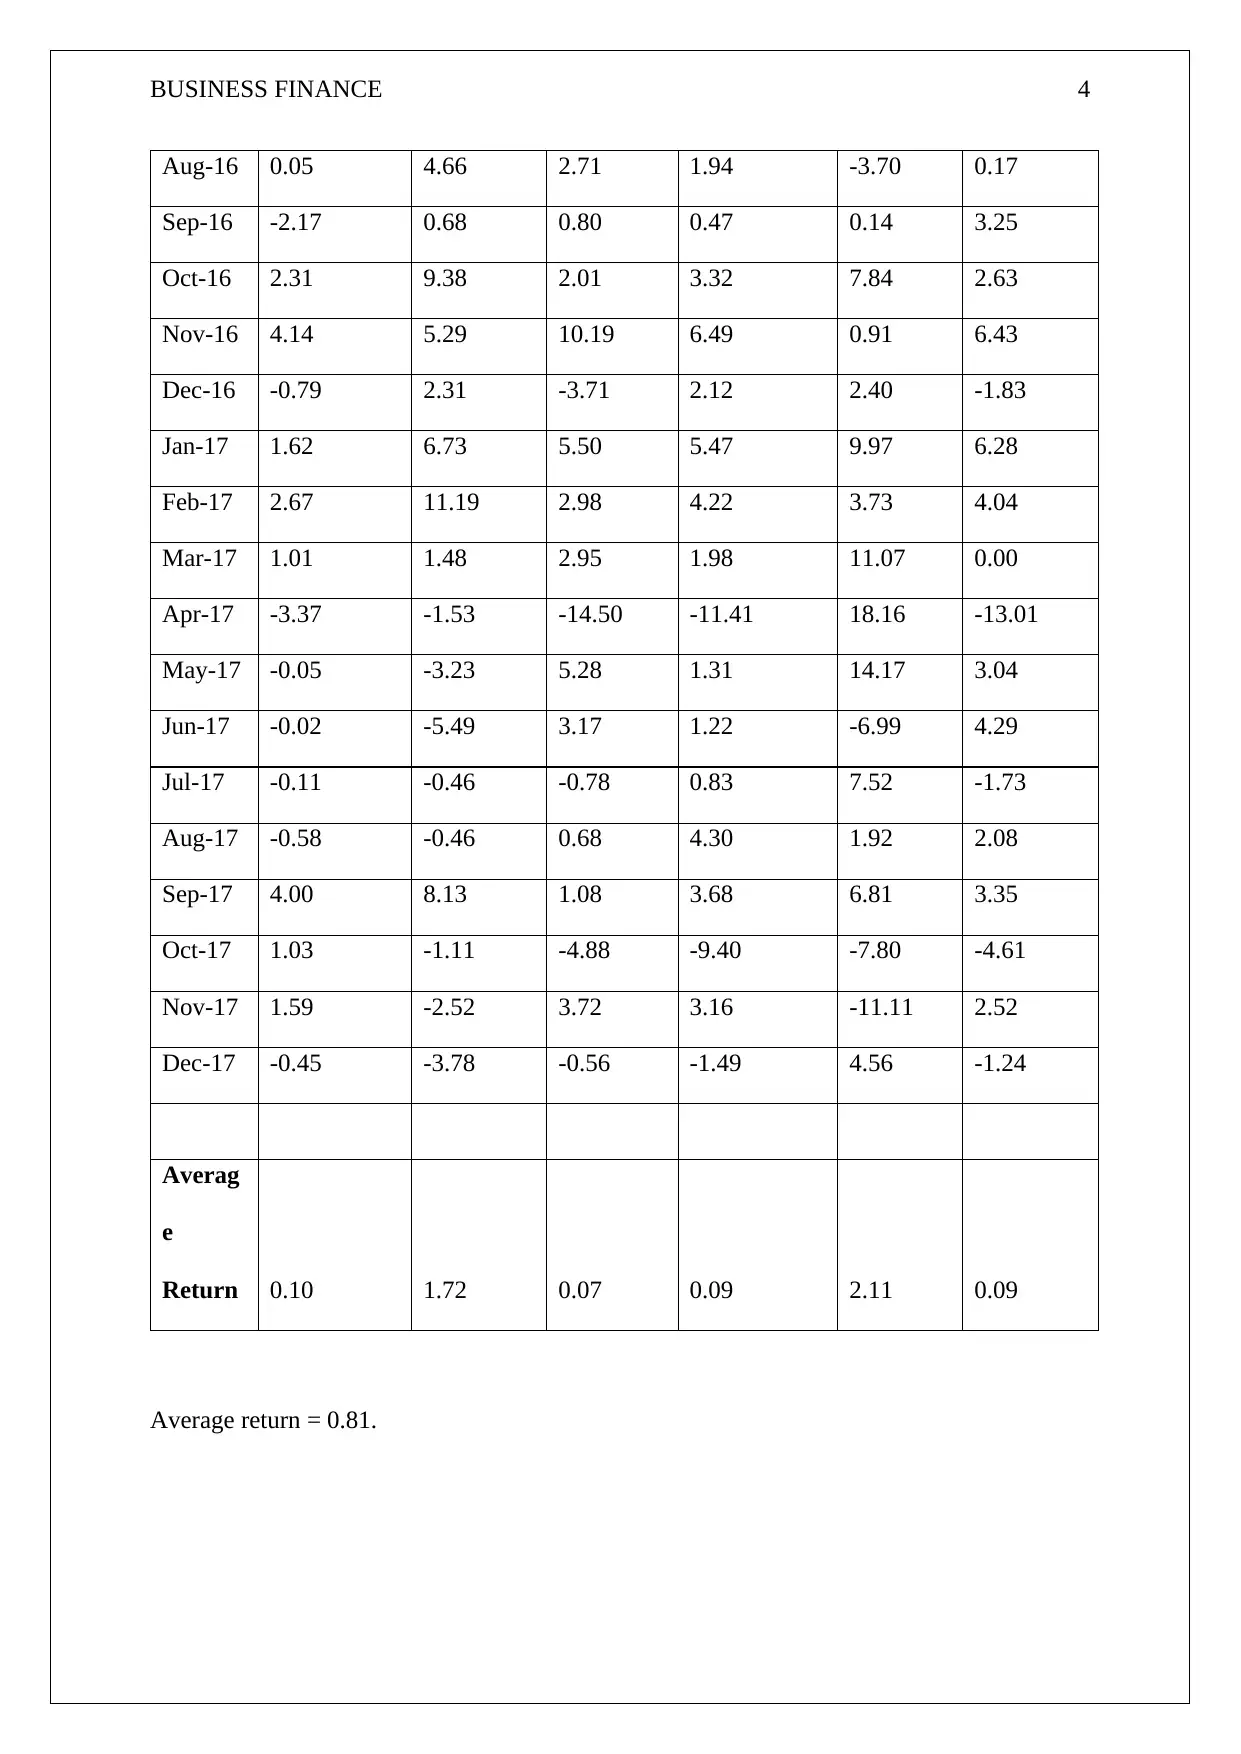
Averag
e
Return 0.10 1.72 0.07 0.09 2.11 0.09
Average return = 0.81.
Aug-16 0.05 4.66 2.71 1.94 -3.70 0.17
Sep-16 -2.17 0.68 0.80 0.47 0.14 3.25
Oct-16 2.31 9.38 2.01 3.32 7.84 2.63
Nov-16 4.14 5.29 10.19 6.49 0.91 6.43
Dec-16 -0.79 2.31 -3.71 2.12 2.40 -1.83
Jan-17 1.62 6.73 5.50 5.47 9.97 6.28
Feb-17 2.67 11.19 2.98 4.22 3.73 4.04
Mar-17 1.01 1.48 2.95 1.98 11.07 0.00
Apr-17 -3.37 -1.53 -14.50 -11.41 18.16 -13.01
May-17 -0.05 -3.23 5.28 1.31 14.17 3.04
Jun-17 -0.02 -5.49 3.17 1.22 -6.99 4.29
Jul-17 -0.11 -0.46 -0.78 0.83 7.52 -1.73
Aug-17 -0.58 -0.46 0.68 4.30 1.92 2.08
Sep-17 4.00 8.13 1.08 3.68 6.81 3.35
Oct-17 1.03 -1.11 -4.88 -9.40 -7.80 -4.61
Nov-17 1.59 -2.52 3.72 3.16 -11.11 2.52
Dec-17 -0.45 -3.78 -0.56 -1.49 4.56 -1.24
Averag
e
Return 0.10 1.72 0.07 0.09 2.11 0.09
Average return = 0.81.
Secure Best Marks with AI Grader
Need help grading? Try our AI Grader for instant feedback on your assignments.
BUSINESS FINANCE 5
Explanation: the return from the individual companies lies somewhat between the risk free
rate and of these companies. The returns from ASX 200 comes out to be 10.4% whereas for
Qan, it’s the maximum and for ANZ, it is the least.
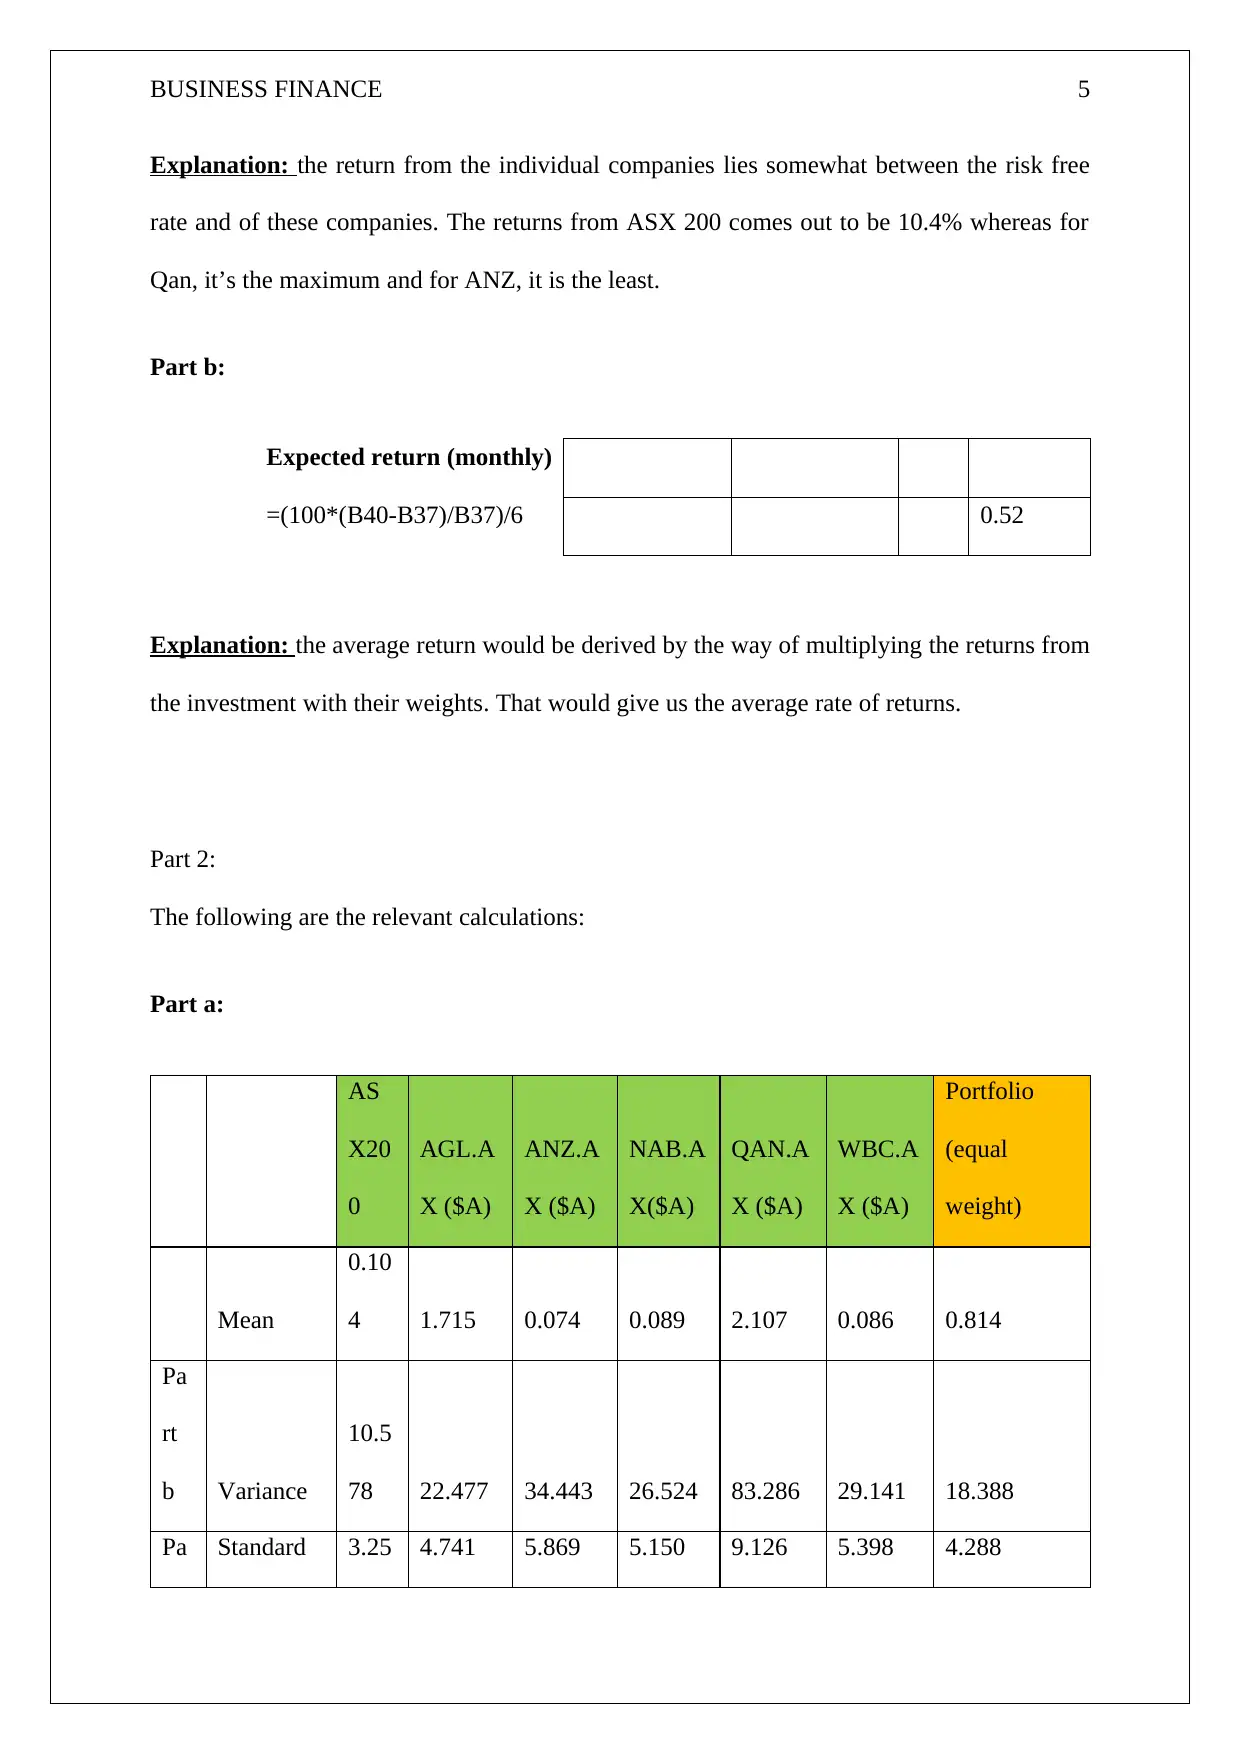
Part b:
Expected return (monthly)
=(100*(B40-B37)/B37)/6 0.52
Explanation: the average return would be derived by the way of multiplying the returns from
the investment with their weights. That would give us the average rate of returns.
Part 2:
The following are the relevant calculations:
Part a:
AS
X20
0
AGL.A
X ($A)
ANZ.A
X ($A)
NAB.A
X($A)
QAN.A
X ($A)
WBC.A
X ($A)
Portfolio
(equal
weight)
Mean
0.10
4 1.715 0.074 0.089 2.107 0.086 0.814
Pa
rt
b Variance
10.5
78 22.477 34.443 26.524 83.286 29.141 18.388
Pa Standard 3.25 4.741 5.869 5.150 9.126 5.398 4.288
Explanation: the return from the individual companies lies somewhat between the risk free
rate and of these companies. The returns from ASX 200 comes out to be 10.4% whereas for
Qan, it’s the maximum and for ANZ, it is the least.
Part b:
Expected return (monthly)
=(100*(B40-B37)/B37)/6 0.52
Explanation: the average return would be derived by the way of multiplying the returns from
the investment with their weights. That would give us the average rate of returns.
Part 2:
The following are the relevant calculations:
Part a:
AS
X20
0
AGL.A
X ($A)
ANZ.A
X ($A)
NAB.A
X($A)
QAN.A
X ($A)
WBC.A
X ($A)
Portfolio
(equal
weight)
Mean
0.10
4 1.715 0.074 0.089 2.107 0.086 0.814
Pa
rt
b Variance
10.5
78 22.477 34.443 26.524 83.286 29.141 18.388
Pa Standard 3.25 4.741 5.869 5.150 9.126 5.398 4.288
BUSINESS FINANCE 6
rt a Deviation 2
Covarianc
e
10.5
78 7.713 13.900 11.699 7.630 12.881 10.765
Beta
1.00
0 0.729 1.314 1.106 0.721 1.218 1.018
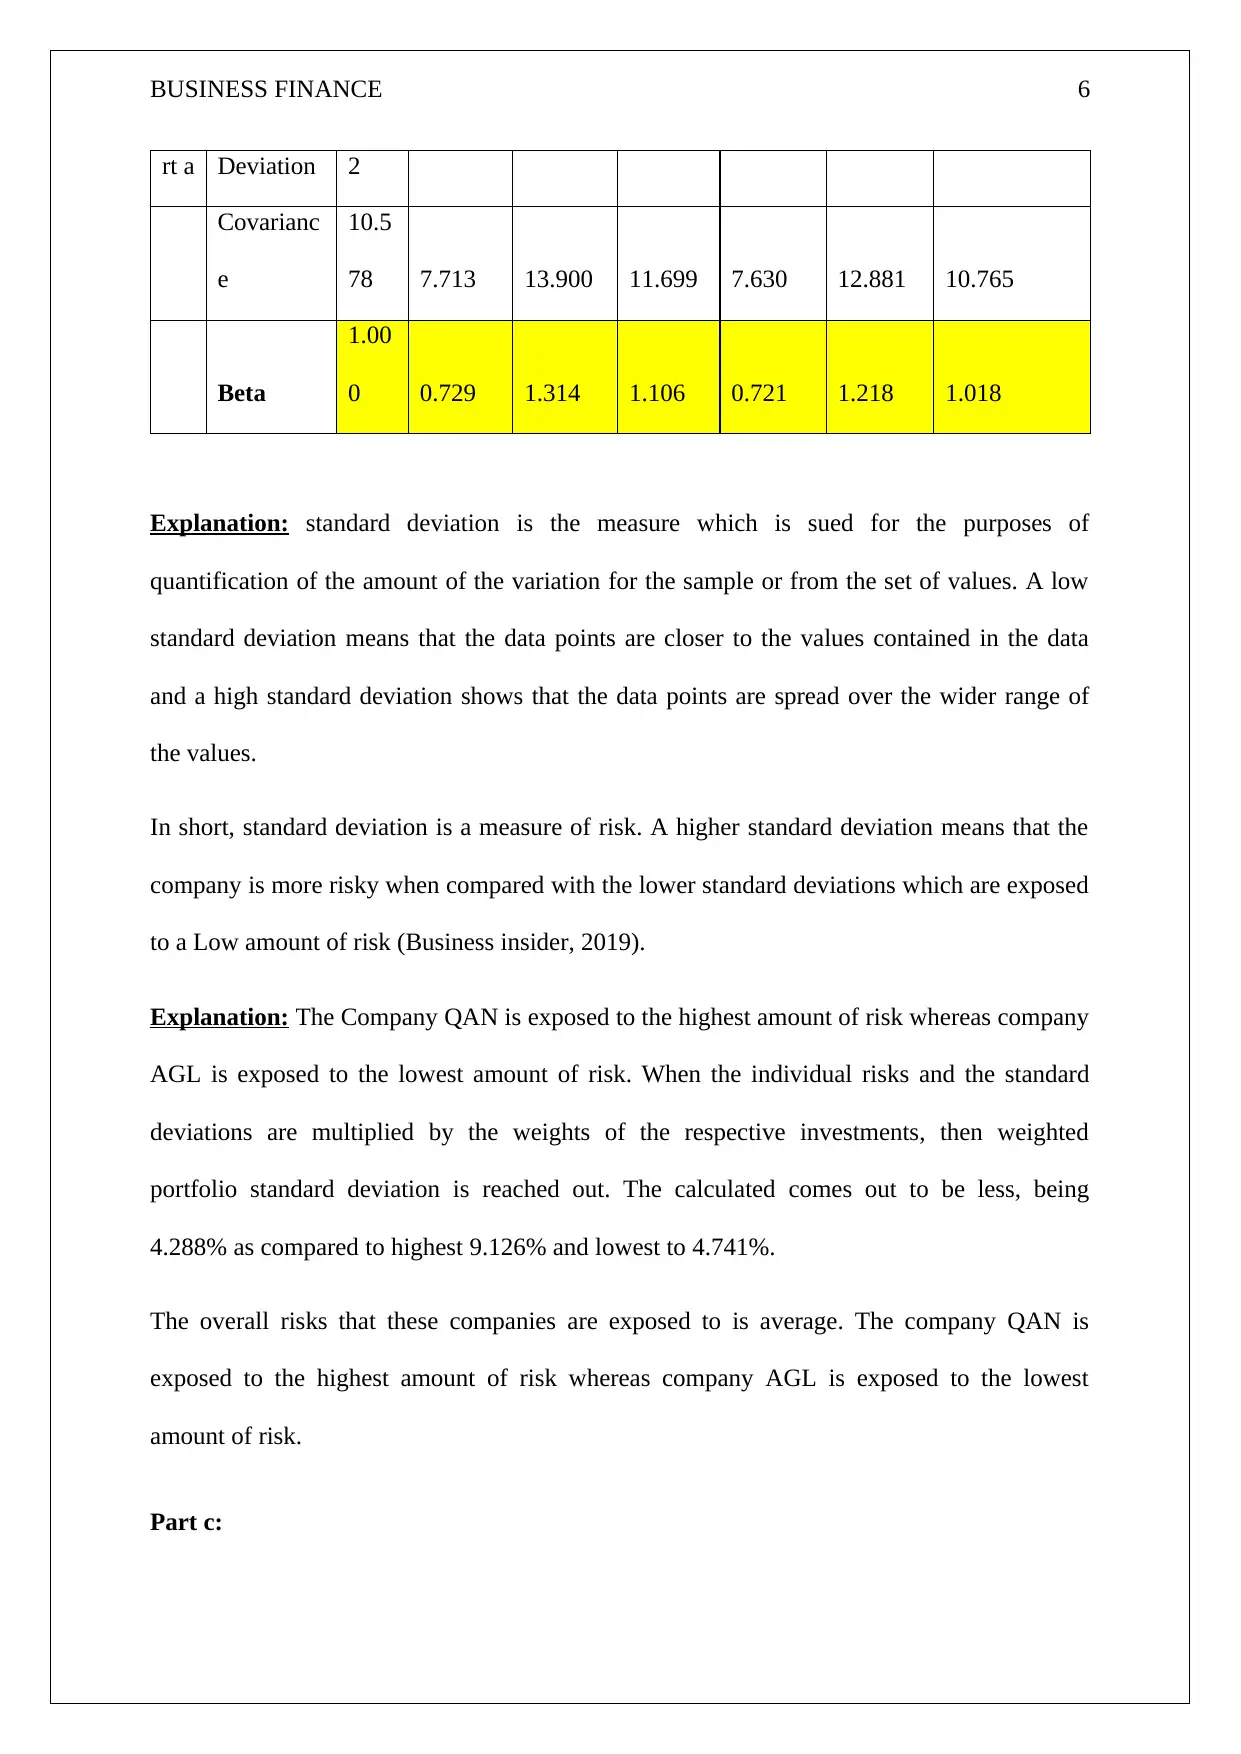
Explanation: standard deviation is the measure which is sued for the purposes of
quantification of the amount of the variation for the sample or from the set of values. A low
standard deviation means that the data points are closer to the values contained in the data
and a high standard deviation shows that the data points are spread over the wider range of
the values.
In short, standard deviation is a measure of risk. A higher standard deviation means that the
company is more risky when compared with the lower standard deviations which are exposed
to a Low amount of risk (Business insider, 2019).
Explanation: The Company QAN is exposed to the highest amount of risk whereas company
AGL is exposed to the lowest amount of risk. When the individual risks and the standard
deviations are multiplied by the weights of the respective investments, then weighted
portfolio standard deviation is reached out. The calculated comes out to be less, being
4.288% as compared to highest 9.126% and lowest to 4.741%.
The overall risks that these companies are exposed to is average. The company QAN is
exposed to the highest amount of risk whereas company AGL is exposed to the lowest
amount of risk.
Part c:
rt a Deviation 2
Covarianc
e
10.5
78 7.713 13.900 11.699 7.630 12.881 10.765
Beta
1.00
0 0.729 1.314 1.106 0.721 1.218 1.018
Explanation: standard deviation is the measure which is sued for the purposes of
quantification of the amount of the variation for the sample or from the set of values. A low
standard deviation means that the data points are closer to the values contained in the data
and a high standard deviation shows that the data points are spread over the wider range of
the values.
In short, standard deviation is a measure of risk. A higher standard deviation means that the
company is more risky when compared with the lower standard deviations which are exposed
to a Low amount of risk (Business insider, 2019).
Explanation: The Company QAN is exposed to the highest amount of risk whereas company
AGL is exposed to the lowest amount of risk. When the individual risks and the standard
deviations are multiplied by the weights of the respective investments, then weighted
portfolio standard deviation is reached out. The calculated comes out to be less, being
4.288% as compared to highest 9.126% and lowest to 4.741%.
The overall risks that these companies are exposed to is average. The company QAN is
exposed to the highest amount of risk whereas company AGL is exposed to the lowest
amount of risk.
Part c:
BUSINESS FINANCE 7
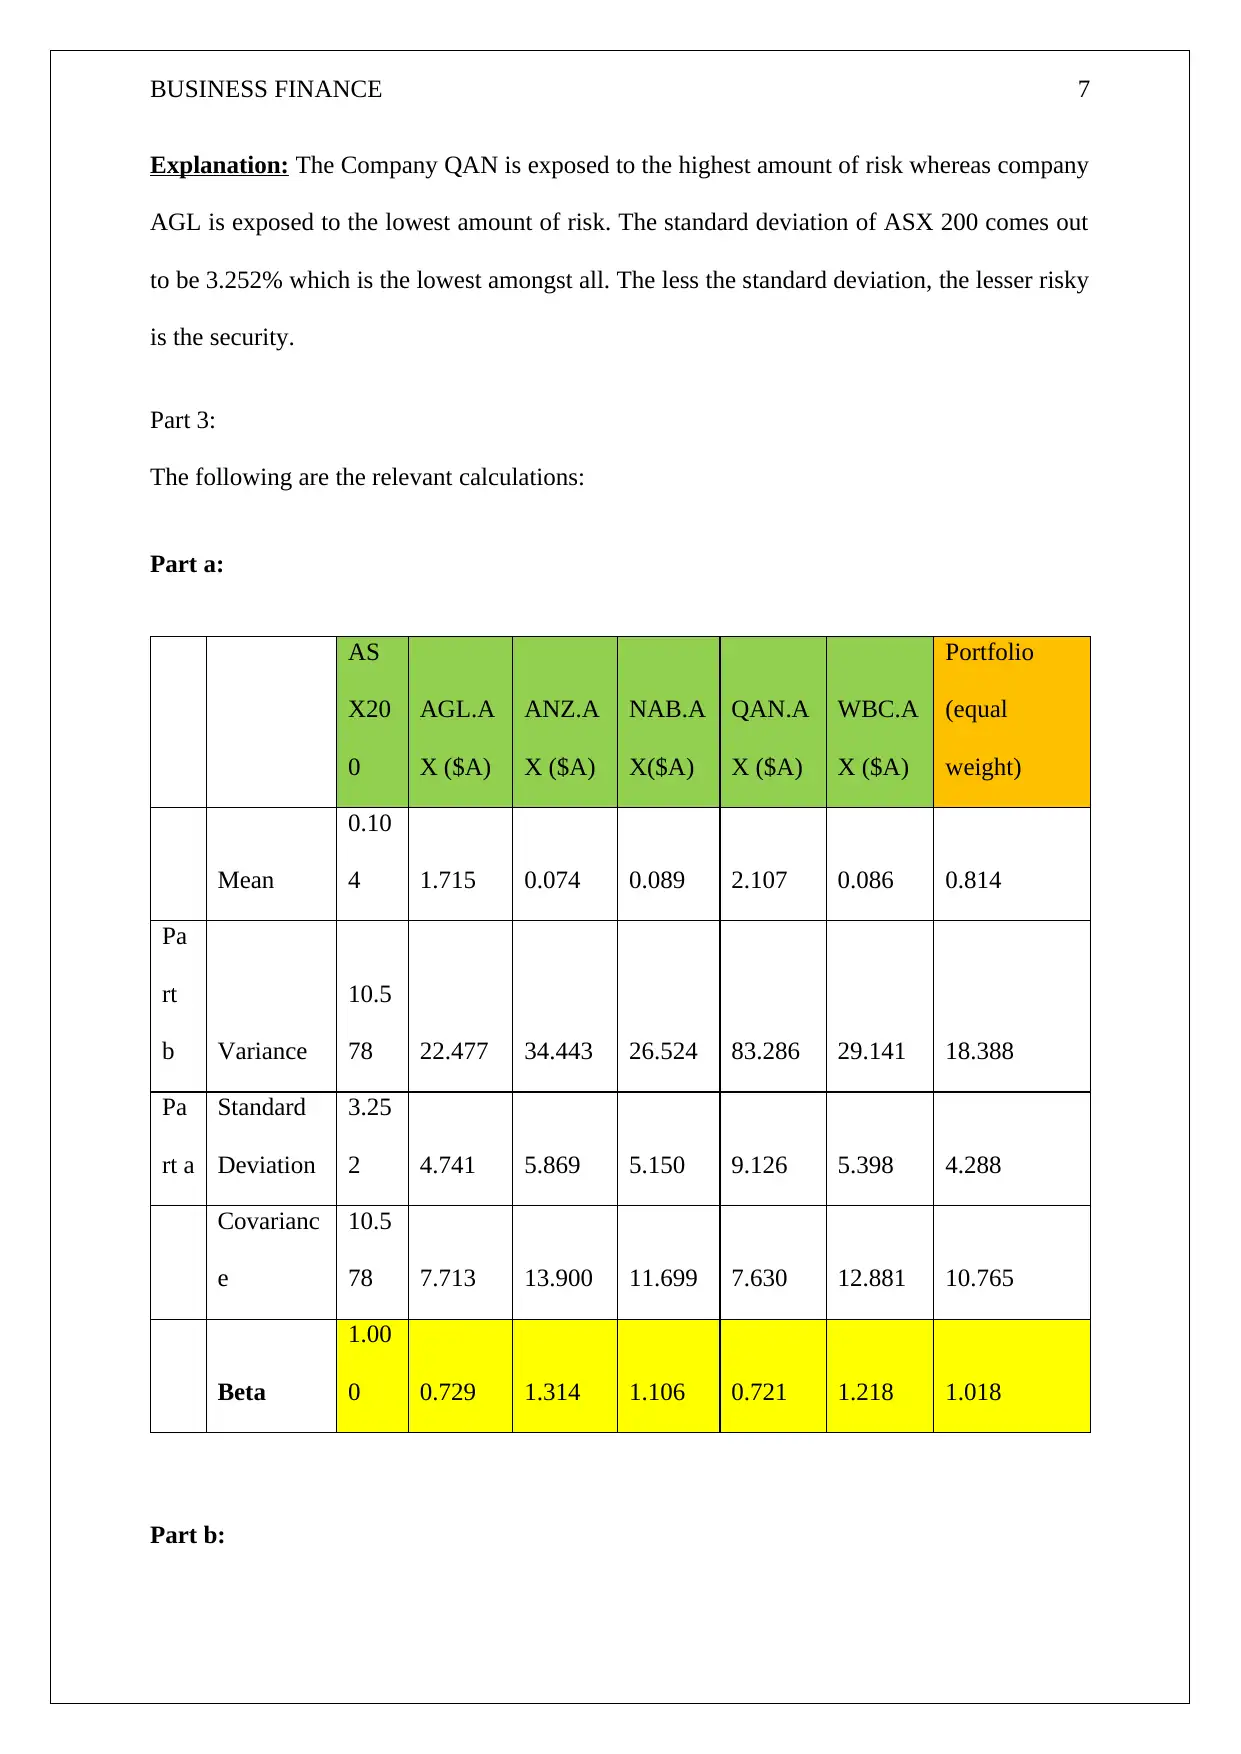
Explanation: The Company QAN is exposed to the highest amount of risk whereas company
AGL is exposed to the lowest amount of risk. The standard deviation of ASX 200 comes out
to be 3.252% which is the lowest amongst all. The less the standard deviation, the lesser risky
is the security.
Part 3:
The following are the relevant calculations:
Part a:
AS
X20
0
AGL.A
X ($A)
ANZ.A
X ($A)
NAB.A
X($A)
QAN.A
X ($A)
WBC.A
X ($A)
Portfolio
(equal
weight)
Mean
0.10
4 1.715 0.074 0.089 2.107 0.086 0.814
Pa
rt
b Variance
10.5
78 22.477 34.443 26.524 83.286 29.141 18.388
Pa
rt a
Standard
Deviation
3.25
2 4.741 5.869 5.150 9.126 5.398 4.288
Covarianc
e
10.5
78 7.713 13.900 11.699 7.630 12.881 10.765
Beta
1.00
0 0.729 1.314 1.106 0.721 1.218 1.018
Part b:
Paraphrase This Document
Need a fresh take? Get an instant paraphrase of this document with our AI Paraphraser
BUSINESS FINANCE 8
Beta is the measure of the volatility of the stock in connection with the market. By definition,
it is covered to be at 1.0 and the individual stocks are ranked as per the rate at which they
deviate from the market. The stock which has a beta of more than 1 is considered to swing
more from the market and the stock that swings less would have the beta of less than 1. The
stocks that have a higher beta which is usually more than 1 are considered to be riskier and
are supposed to provide more returns and the stocks that have a low beta would provide lower
returns.
The stock market as the whole has a beta value of one. The stock is more volatile and even
fluctuates more, then the market would have the beta of being more than 1. The stocks which
are less volatile would have a lesser number of swings when compared with the aggregate
market which has the beta value of less than 1. A low beta value means that the stock of the
company is considered to be less risky but this would also give lower rates of returns. The
higher the value of beta, the more is the risk that the investor is willing to take and the more
are the chances of giving big returns (Small business chron, 2019).
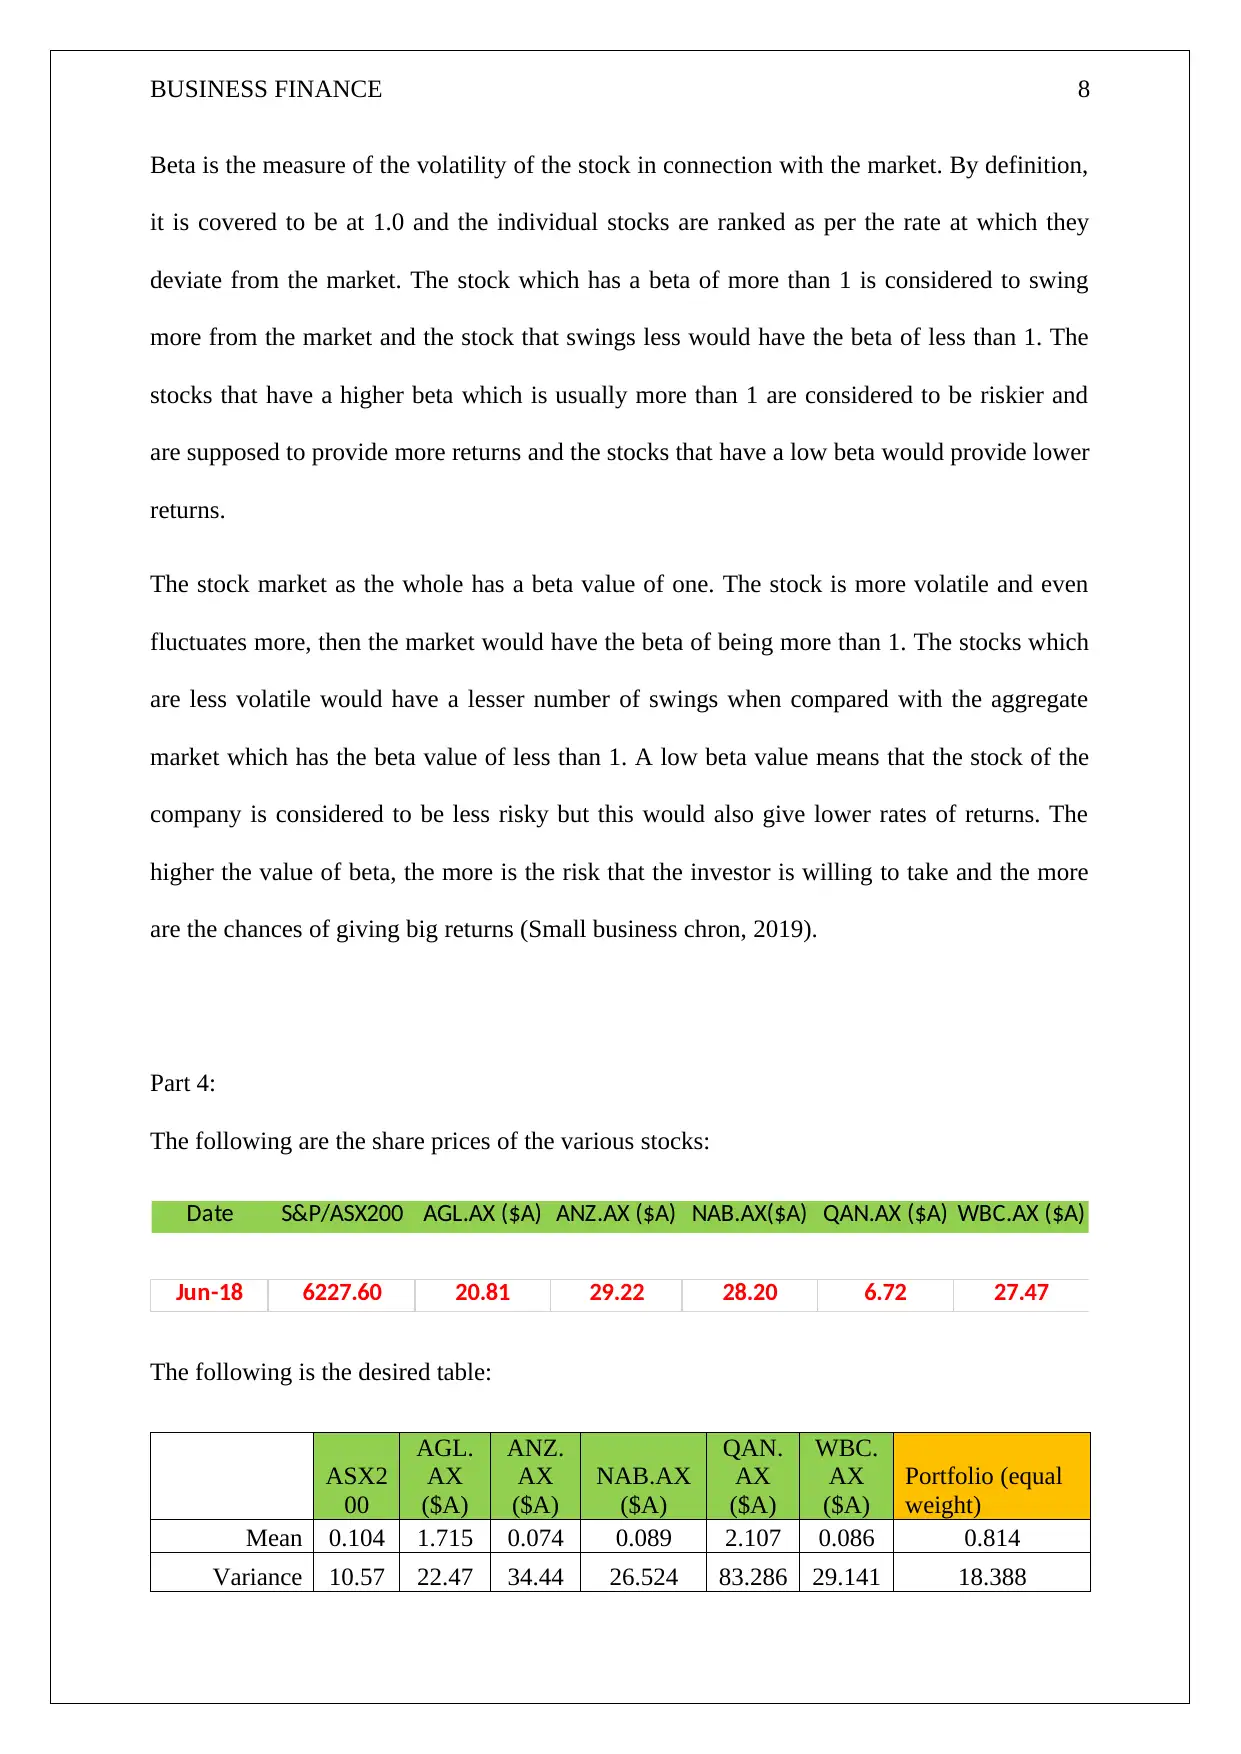
Part 4:
The following are the share prices of the various stocks:
Date S&P/ASX200 AGL.AX ($A) ANZ.AX ($A) NAB.AX($A) QAN.AX ($A) WBC.AX ($A)
Jun-18 6227.60 20.81 29.22 28.20 6.72 27.47
The following is the desired table:
ASX2
00
AGL.
AX
($A)
ANZ.
AX
($A)
NAB.AX
($A)
QAN.
AX
($A)
WBC.
AX
($A)
Portfolio (equal
weight)
Mean 0.104 1.715 0.074 0.089 2.107 0.086 0.814
Variance 10.57 22.47 34.44 26.524 83.286 29.141 18.388
Beta is the measure of the volatility of the stock in connection with the market. By definition,
it is covered to be at 1.0 and the individual stocks are ranked as per the rate at which they
deviate from the market. The stock which has a beta of more than 1 is considered to swing
more from the market and the stock that swings less would have the beta of less than 1. The
stocks that have a higher beta which is usually more than 1 are considered to be riskier and
are supposed to provide more returns and the stocks that have a low beta would provide lower
returns.
The stock market as the whole has a beta value of one. The stock is more volatile and even
fluctuates more, then the market would have the beta of being more than 1. The stocks which
are less volatile would have a lesser number of swings when compared with the aggregate
market which has the beta value of less than 1. A low beta value means that the stock of the
company is considered to be less risky but this would also give lower rates of returns. The
higher the value of beta, the more is the risk that the investor is willing to take and the more
are the chances of giving big returns (Small business chron, 2019).
Part 4:
The following are the share prices of the various stocks:
Date S&P/ASX200 AGL.AX ($A) ANZ.AX ($A) NAB.AX($A) QAN.AX ($A) WBC.AX ($A)
Jun-18 6227.60 20.81 29.22 28.20 6.72 27.47
The following is the desired table:
ASX2
00
AGL.
AX
($A)
ANZ.
AX
($A)
NAB.AX
($A)
QAN.
AX
($A)
WBC.
AX
($A)
Portfolio (equal
weight)
Mean 0.104 1.715 0.074 0.089 2.107 0.086 0.814
Variance 10.57 22.47 34.44 26.524 83.286 29.141 18.388
BUSINESS FINANCE 9
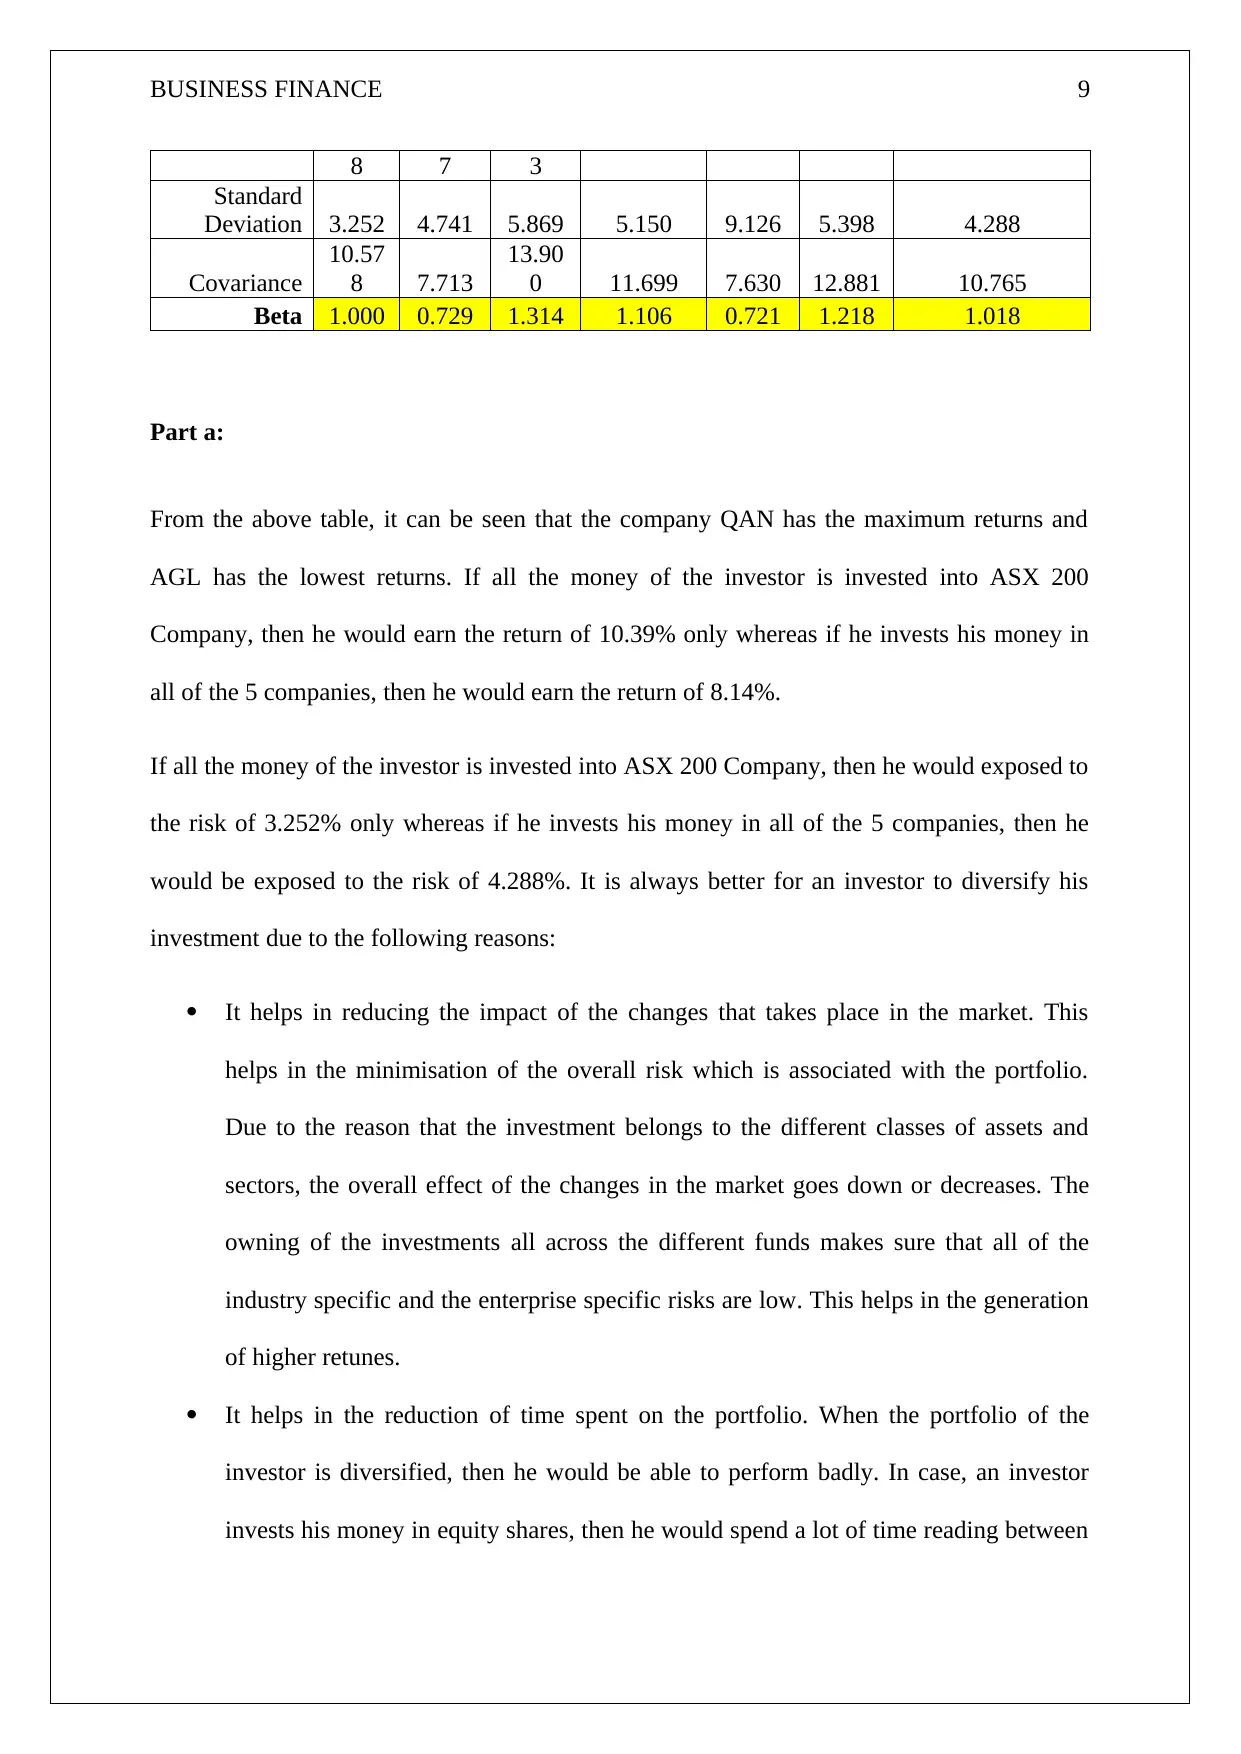
8 7 3
Standard
Deviation 3.252 4.741 5.869 5.150 9.126 5.398 4.288
Covariance
10.57
8 7.713
13.90
0 11.699 7.630 12.881 10.765
Beta 1.000 0.729 1.314 1.106 0.721 1.218 1.018
Part a:
From the above table, it can be seen that the company QAN has the maximum returns and
AGL has the lowest returns. If all the money of the investor is invested into ASX 200
Company, then he would earn the return of 10.39% only whereas if he invests his money in
all of the 5 companies, then he would earn the return of 8.14%.
If all the money of the investor is invested into ASX 200 Company, then he would exposed to
the risk of 3.252% only whereas if he invests his money in all of the 5 companies, then he
would be exposed to the risk of 4.288%. It is always better for an investor to diversify his
investment due to the following reasons:
It helps in reducing the impact of the changes that takes place in the market. This
helps in the minimisation of the overall risk which is associated with the portfolio.
Due to the reason that the investment belongs to the different classes of assets and
sectors, the overall effect of the changes in the market goes down or decreases. The
owning of the investments all across the different funds makes sure that all of the
industry specific and the enterprise specific risks are low. This helps in the generation
of higher retunes.
It helps in the reduction of time spent on the portfolio. When the portfolio of the
investor is diversified, then he would be able to perform badly. In case, an investor
invests his money in equity shares, then he would spend a lot of time reading between
BUSINESS FINANCE 10
the lines etc. in case the amount is invested in the low risk mutual funds, then there
would be increased returns.
Diversification helps in seeking and advantage of different instruments of
investments. An investor would be able to derive maximum benefit when he invests in
debt and equity together.
An investor should be able to invest his hard earned money in the high performing
sectors. In case the market volatility has a positive effect on the stocks, then the
investor would be able to have higher returns, otherwise not.
An investor would be in a able to function with a free mind when he invests in
multiple securities. This is due to the fact that even if one investment gives him a
lower rate of return, then he may be able to get a higher return on his other investment
(Angel bee, 2019).
Part b:
Due to the above stated advantages of the equally weighed returns, the company must invest
in them since that would entail more returns for the investor.
Secure Best Marks with AI Grader
Need help grading? Try our AI Grader for instant feedback on your assignments.
BUSINESS FINANCE 11
References:
Angelbee.in. (2019). What Are The Benefits Of Portfolio Diversification? - Angel Bee.
[online] Available at: https://www.angelbee.in/mutual-fund-basics/how-does-diversification-
help-you [Accessed 24 Sep. 2019].
Business Insider. (2019). Here's What Statisticians Mean By A Standard Deviation. [online]
Available at: https://www.businessinsider.in/Heres-What-Statisticians-Mean-By-A-Standard-
Deviation/articleshow/45353386.cms [Accessed 24 Sep. 2019].
Smallbusiness.chron.com. (2019). What Does Low Beta Mean for a Business?. [online]
Available at: https://smallbusiness.chron.com/low-beta-mean-business-26280.html [Accessed
24 Sep. 2019].
1 out of 11
Related Documents


Your All-in-One AI-Powered Toolkit for Academic Success.
+13062052269
info@desklib.com
Available 24*7 on WhatsApp / Email
![[object Object]](/_next/static/media/star-bottom.7253800d.svg)
Unlock your academic potential
© 2024 | Zucol Services PVT LTD | All rights reserved.