MA514 Business Finance Report: Economic, Investment & Finance Analysis
VerifiedAdded on 2023/06/11
|15
|3183
|473
Report
AI Summary
This report provides a comprehensive financial analysis, including property price projections, income growth assessments, and savings calculations, to aid a client in achieving her 'Australian dream.' It evaluates the affordability of property in Melbourne by analyzing historical price data, inflation rates, and income trends. The report calculates the client's potential savings, considering salary, expenses, and tax implications, and determines the maximum property value achievable with and without insurance premiums, assessing loan-to-value ratios. Furthermore, it projects future property prices and income, demonstrating the client's ability to purchase property with different upfront payment scenarios. The analysis incorporates stamp duty and insurance premium costs to provide a realistic financial outlook, concluding with a projection of the client's savings over time and their ability to meet financial goals. This student-contributed document is available on Desklib, offering valuable insights for finance students and professionals.
Running head: BUSINESS FINANCE
Business Finance
Name of the Student:
Name of the University:
Authors Note:
Business Finance
Name of the Student:
Name of the University:
Authors Note:
Paraphrase This Document
Need a fresh take? Get an instant paraphrase of this document with our AI Paraphraser
BUSINESS FINANCE
1
Table of Contents
Answer to question 1:.................................................................................................................2
Answer to question 2:.................................................................................................................3
Answer to question 3:.................................................................................................................5
Answer to question 4:.................................................................................................................6
Answer to question 5:.................................................................................................................8
Answer to question 6:...............................................................................................................11
Answer to question 7:...............................................................................................................11
Reference and Bibliography:....................................................................................................13
BUSINESS FINANCE
2
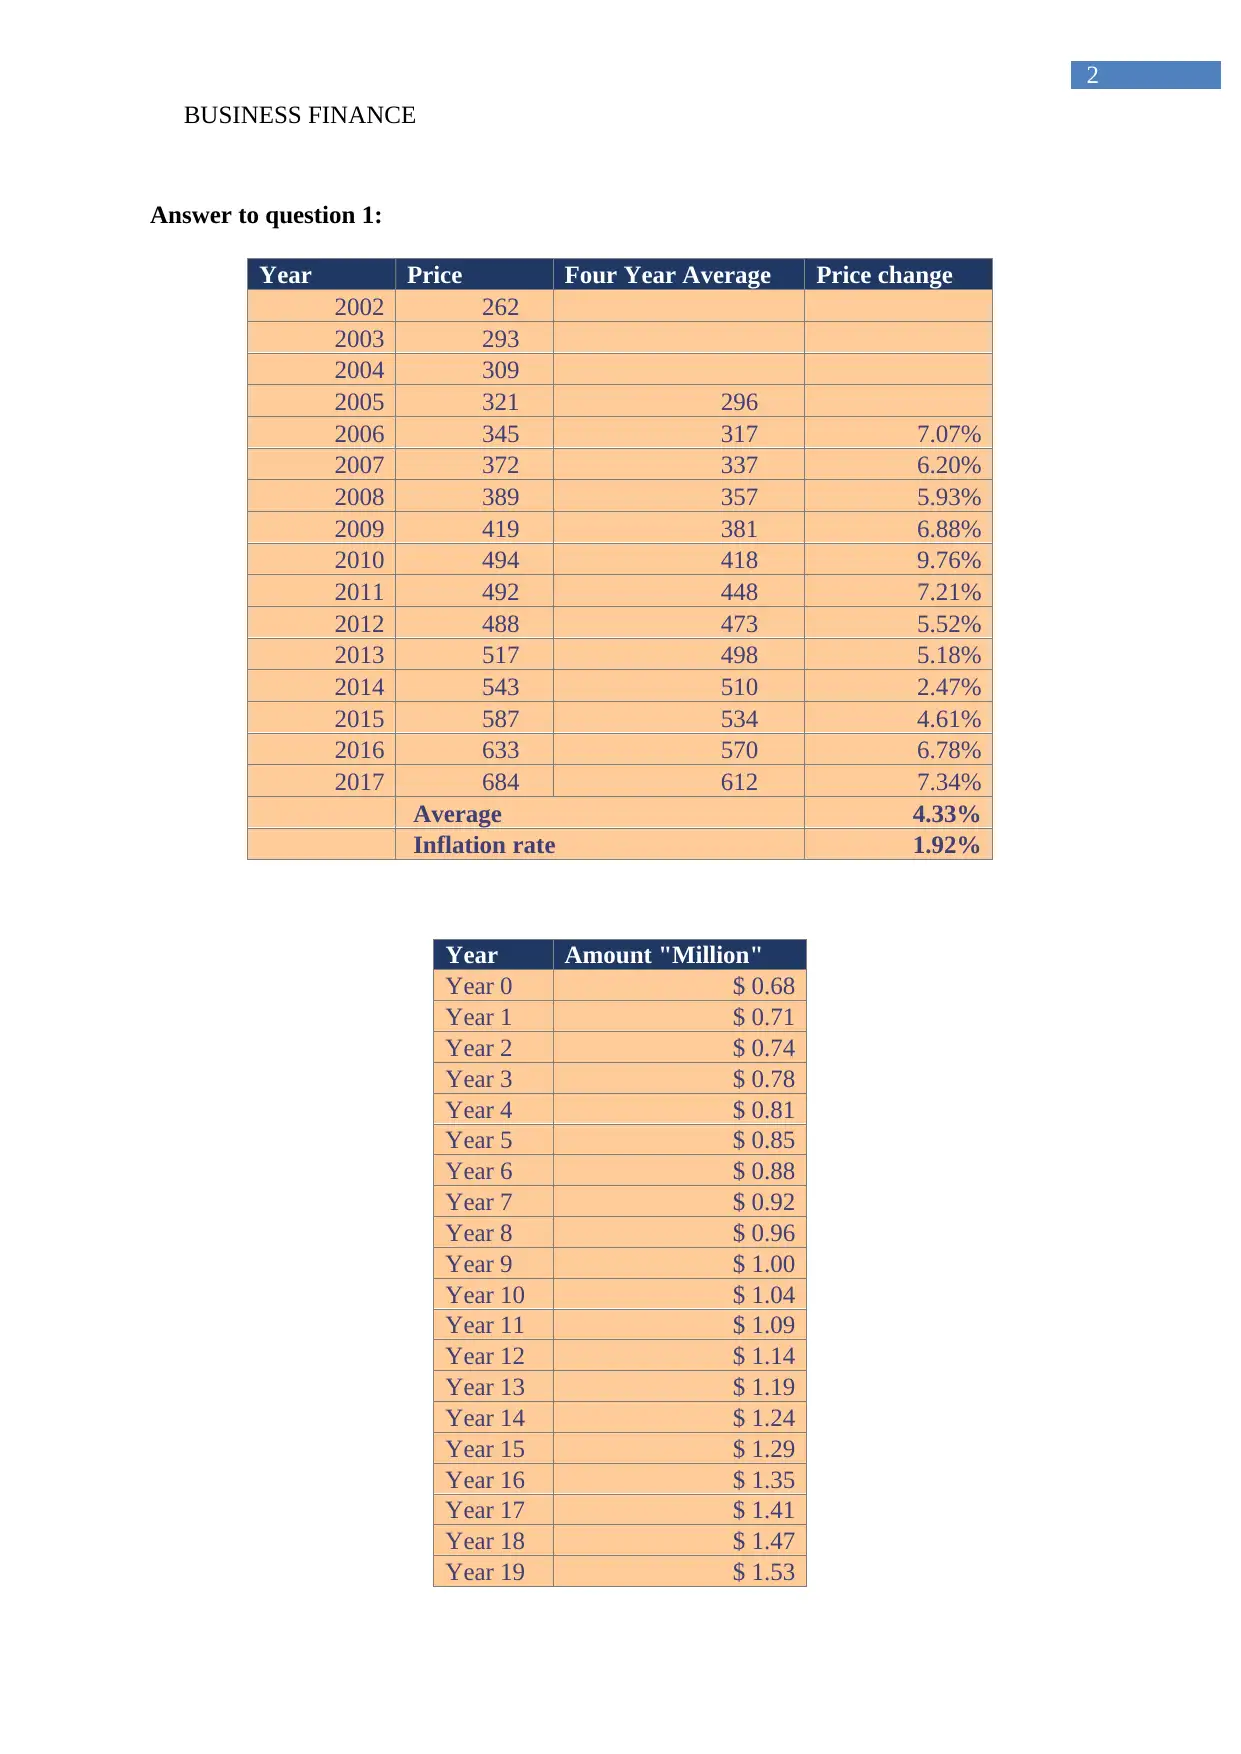
Answer to question 1:
Year Price Four Year Average Price change
2002 262
2003 293
2004 309
2005 321 296
2006 345 317 7.07%
2007 372 337 6.20%
2008 389 357 5.93%
2009 419 381 6.88%
2010 494 418 9.76%
2011 492 448 7.21%
2012 488 473 5.52%
2013 517 498 5.18%
2014 543 510 2.47%
2015 587 534 4.61%
2016 633 570 6.78%
2017 684 612 7.34%
Average 4.33%
Inflation rate 1.92%
Year Amount "Million"
Year 0 $ 0.68
Year 1 $ 0.71
Year 2 $ 0.74
Year 3 $ 0.78
Year 4 $ 0.81
Year 5 $ 0.85
Year 6 $ 0.88
Year 7 $ 0.92
Year 8 $ 0.96
Year 9 $ 1.00
Year 10 $ 1.04
Year 11 $ 1.09
Year 12 $ 1.14
Year 13 $ 1.19
Year 14 $ 1.24
Year 15 $ 1.29
Year 16 $ 1.35
Year 17 $ 1.41
Year 18 $ 1.47
Year 19 $ 1.53
2
Answer to question 1:
Year Price Four Year Average Price change
2002 262
2003 293
2004 309
2005 321 296
2006 345 317 7.07%
2007 372 337 6.20%
2008 389 357 5.93%
2009 419 381 6.88%
2010 494 418 9.76%
2011 492 448 7.21%
2012 488 473 5.52%
2013 517 498 5.18%
2014 543 510 2.47%
2015 587 534 4.61%
2016 633 570 6.78%
2017 684 612 7.34%
Average 4.33%
Inflation rate 1.92%
Year Amount "Million"
Year 0 $ 0.68
Year 1 $ 0.71
Year 2 $ 0.74
Year 3 $ 0.78
Year 4 $ 0.81
Year 5 $ 0.85
Year 6 $ 0.88
Year 7 $ 0.92
Year 8 $ 0.96
Year 9 $ 1.00
Year 10 $ 1.04
Year 11 $ 1.09
Year 12 $ 1.14
Year 13 $ 1.19
Year 14 $ 1.24
Year 15 $ 1.29
Year 16 $ 1.35
Year 17 $ 1.41
Year 18 $ 1.47
Year 19 $ 1.53
⊘ This is a preview!⊘
Do you want full access?
Subscribe today to unlock all pages.
Trusted by 1+ million students worldwide
BUSINESS FINANCE
3
Year 20 $ 1.60
Year
0
Year
1
Year
2
Year
3
Year
4
Year
5
Year
6
Year
7
Year
8
Year
9
Year
10
Year
11
Year
12
Year
13
Year
14
Year
15
Year
16
Year
17
Year
18
Year
19
Year
20
$0.68$0.71$0.74$0.78$0.81$0.85$0.88$0.92$0.96$1.00$1.04$1.09$1.14$1.19$1.24$1.29$1.35$1.41$1.47$1.53$1.60
Property price for next 20 years "In Million"
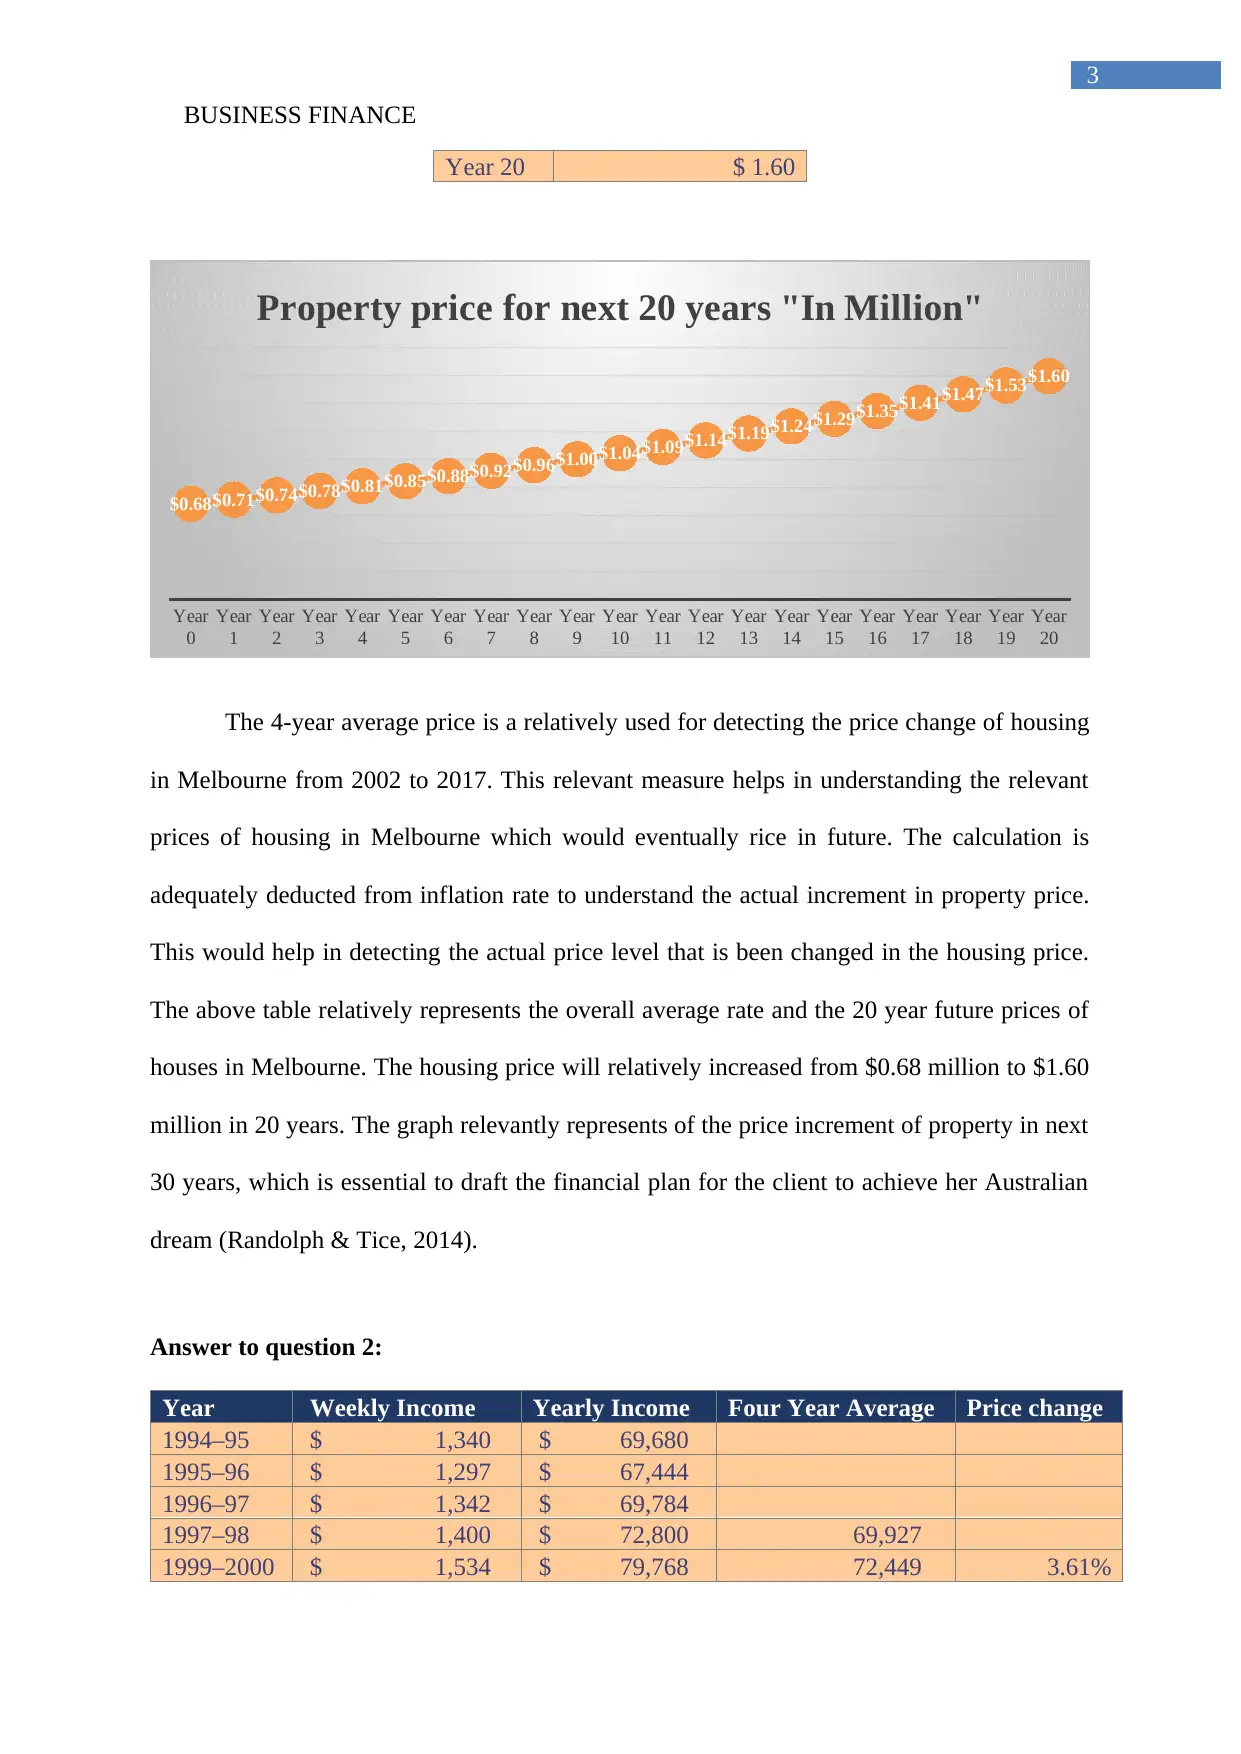
The 4-year average price is a relatively used for detecting the price change of housing
in Melbourne from 2002 to 2017. This relevant measure helps in understanding the relevant
prices of housing in Melbourne which would eventually rice in future. The calculation is
adequately deducted from inflation rate to understand the actual increment in property price.
This would help in detecting the actual price level that is been changed in the housing price.
The above table relatively represents the overall average rate and the 20 year future prices of
houses in Melbourne. The housing price will relatively increased from $0.68 million to $1.60
million in 20 years. The graph relevantly represents of the price increment of property in next
30 years, which is essential to draft the financial plan for the client to achieve her Australian
dream (Randolph & Tice, 2014).
Answer to question 2:
Year Weekly Income Yearly Income Four Year Average Price change
1994–95 $ 1,340 $ 69,680
1995–96 $ 1,297 $ 67,444
1996–97 $ 1,342 $ 69,784
1997–98 $ 1,400 $ 72,800 69,927
1999–2000 $ 1,534 $ 79,768 72,449 3.61%
3
Year 20 $ 1.60
Year
0
Year
1
Year
2
Year
3
Year
4
Year
5
Year
6
Year
7
Year
8
Year
9
Year
10
Year
11
Year
12
Year
13
Year
14
Year
15
Year
16
Year
17
Year
18
Year
19
Year
20
$0.68$0.71$0.74$0.78$0.81$0.85$0.88$0.92$0.96$1.00$1.04$1.09$1.14$1.19$1.24$1.29$1.35$1.41$1.47$1.53$1.60
Property price for next 20 years "In Million"
The 4-year average price is a relatively used for detecting the price change of housing
in Melbourne from 2002 to 2017. This relevant measure helps in understanding the relevant
prices of housing in Melbourne which would eventually rice in future. The calculation is
adequately deducted from inflation rate to understand the actual increment in property price.
This would help in detecting the actual price level that is been changed in the housing price.
The above table relatively represents the overall average rate and the 20 year future prices of
houses in Melbourne. The housing price will relatively increased from $0.68 million to $1.60
million in 20 years. The graph relevantly represents of the price increment of property in next
30 years, which is essential to draft the financial plan for the client to achieve her Australian
dream (Randolph & Tice, 2014).
Answer to question 2:
Year Weekly Income Yearly Income Four Year Average Price change
1994–95 $ 1,340 $ 69,680
1995–96 $ 1,297 $ 67,444
1996–97 $ 1,342 $ 69,784
1997–98 $ 1,400 $ 72,800 69,927
1999–2000 $ 1,534 $ 79,768 72,449 3.61%
Paraphrase This Document
Need a fresh take? Get an instant paraphrase of this document with our AI Paraphraser
BUSINESS FINANCE
4
2000–01 $ 1,475 $ 76,700 74,763 3.19%
2002–03 $ 1,525 $ 79,300 77,142 3.18%
2003–04(a) $ 1,582 $ 82,264 79,508 3.07%
2005–06(a) $ 1,681 $ 87,412 81,419 2.40%
2007–08(a) $ 1,967 $ 102,284 87,815 7.86%
2009–10(a) $ 1,870 $ 97,240 92,300 5.11%
2011–12(a) $ 1,914 $ 99,528 96,616 4.68%
2013–14(a) $ 2,016 $ 104,832 100,971 4.51%
2015–16(a) $ 2,055 $ 106,860 102,115 1.13%
Average 3.87%
Growth in Income 3.87%
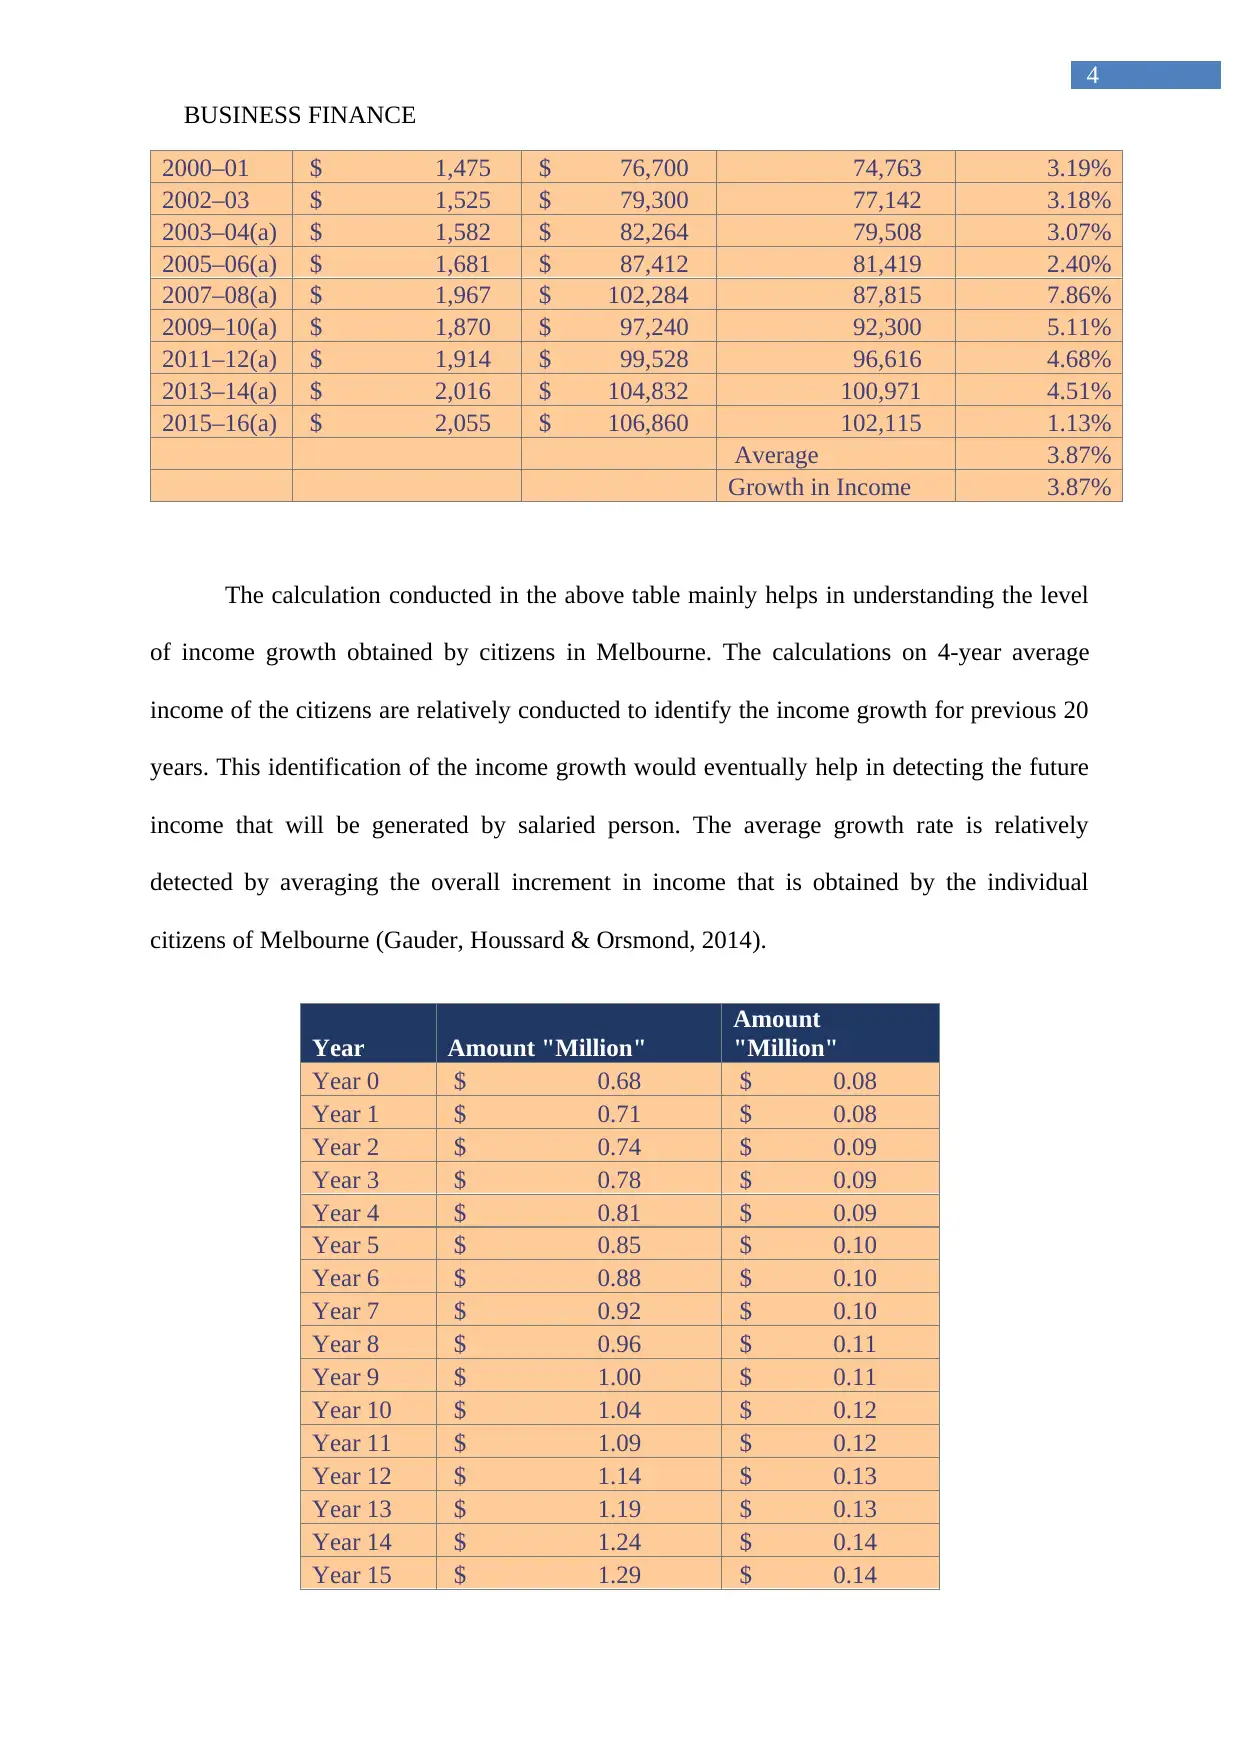
The calculation conducted in the above table mainly helps in understanding the level
of income growth obtained by citizens in Melbourne. The calculations on 4-year average
income of the citizens are relatively conducted to identify the income growth for previous 20
years. This identification of the income growth would eventually help in detecting the future
income that will be generated by salaried person. The average growth rate is relatively
detected by averaging the overall increment in income that is obtained by the individual
citizens of Melbourne (Gauder, Houssard & Orsmond, 2014).
Year Amount "Million"
Amount
"Million"
Year 0 $ 0.68 $ 0.08
Year 1 $ 0.71 $ 0.08
Year 2 $ 0.74 $ 0.09
Year 3 $ 0.78 $ 0.09
Year 4 $ 0.81 $ 0.09
Year 5 $ 0.85 $ 0.10
Year 6 $ 0.88 $ 0.10
Year 7 $ 0.92 $ 0.10
Year 8 $ 0.96 $ 0.11
Year 9 $ 1.00 $ 0.11
Year 10 $ 1.04 $ 0.12
Year 11 $ 1.09 $ 0.12
Year 12 $ 1.14 $ 0.13
Year 13 $ 1.19 $ 0.13
Year 14 $ 1.24 $ 0.14
Year 15 $ 1.29 $ 0.14
4
2000–01 $ 1,475 $ 76,700 74,763 3.19%
2002–03 $ 1,525 $ 79,300 77,142 3.18%
2003–04(a) $ 1,582 $ 82,264 79,508 3.07%
2005–06(a) $ 1,681 $ 87,412 81,419 2.40%
2007–08(a) $ 1,967 $ 102,284 87,815 7.86%
2009–10(a) $ 1,870 $ 97,240 92,300 5.11%
2011–12(a) $ 1,914 $ 99,528 96,616 4.68%
2013–14(a) $ 2,016 $ 104,832 100,971 4.51%
2015–16(a) $ 2,055 $ 106,860 102,115 1.13%
Average 3.87%
Growth in Income 3.87%
The calculation conducted in the above table mainly helps in understanding the level
of income growth obtained by citizens in Melbourne. The calculations on 4-year average
income of the citizens are relatively conducted to identify the income growth for previous 20
years. This identification of the income growth would eventually help in detecting the future
income that will be generated by salaried person. The average growth rate is relatively
detected by averaging the overall increment in income that is obtained by the individual
citizens of Melbourne (Gauder, Houssard & Orsmond, 2014).
Year Amount "Million"
Amount
"Million"
Year 0 $ 0.68 $ 0.08
Year 1 $ 0.71 $ 0.08
Year 2 $ 0.74 $ 0.09
Year 3 $ 0.78 $ 0.09
Year 4 $ 0.81 $ 0.09
Year 5 $ 0.85 $ 0.10
Year 6 $ 0.88 $ 0.10
Year 7 $ 0.92 $ 0.10
Year 8 $ 0.96 $ 0.11
Year 9 $ 1.00 $ 0.11
Year 10 $ 1.04 $ 0.12
Year 11 $ 1.09 $ 0.12
Year 12 $ 1.14 $ 0.13
Year 13 $ 1.19 $ 0.13
Year 14 $ 1.24 $ 0.14
Year 15 $ 1.29 $ 0.14
BUSINESS FINANCE
5
Year 16 $ 1.35 $ 0.15
Year 17 $ 1.41 $ 0.15
Year 18 $ 1.47 $ 0.16
Year 19 $ 1.53 $ 0.16
Year 20 $ 1.60 $ 0.17
Year
0
Year
1
Year
2
Year
3
Year
4
Year
5
Year
6
Year
7
Year
8
Year
9
Year
10
Year
11
Year
12
Year
13
Year
14
Year
15
Year
16
Year
17
Year
18
Year
19
Year
20
$0.08$0.08$0.09$0.09$0.09$0.10$0.10$0.10$0.11$0.11$0.12$0.12$0.13$0.13$0.14$0.14$0.15$0.15$0.16$0.16$0.17
Clinet income in 20 years "In Million"
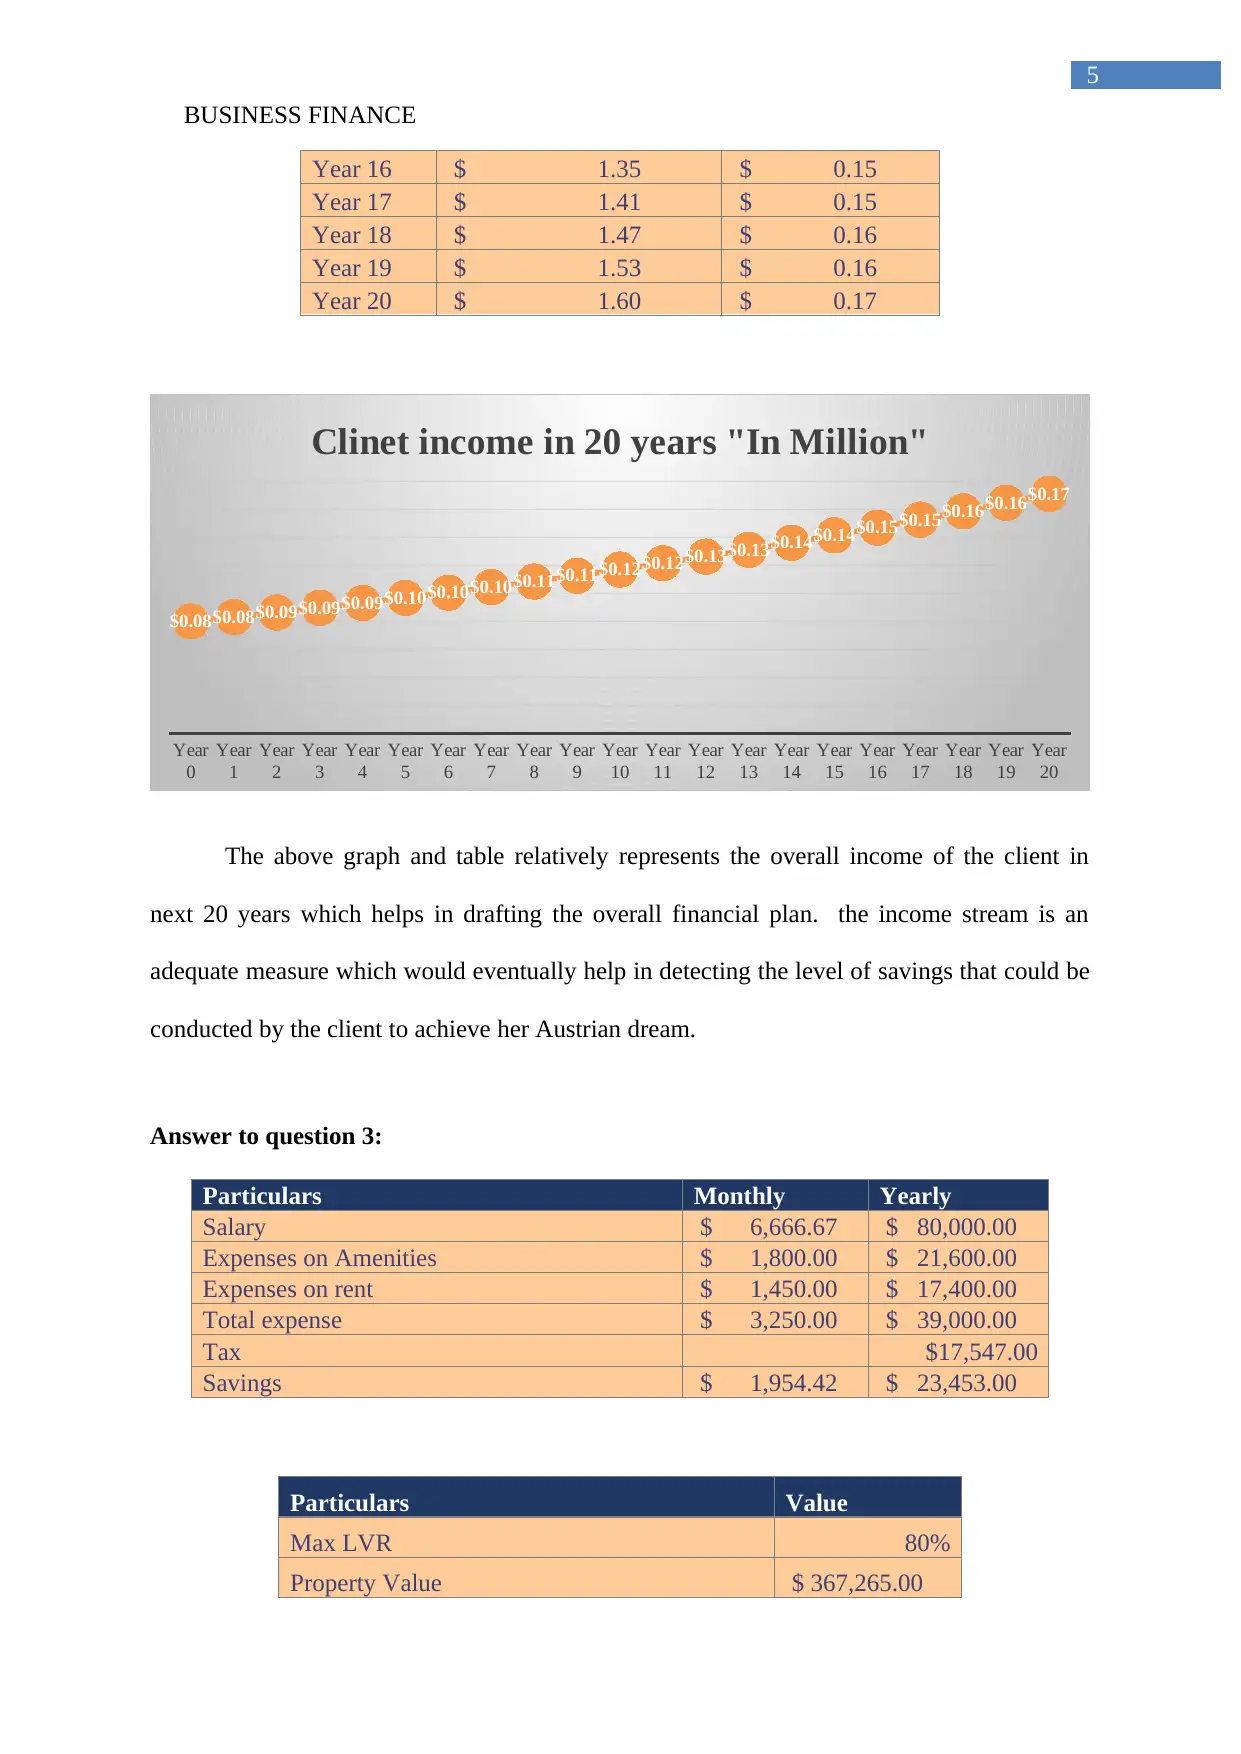
The above graph and table relatively represents the overall income of the client in
next 20 years which helps in drafting the overall financial plan. the income stream is an
adequate measure which would eventually help in detecting the level of savings that could be
conducted by the client to achieve her Austrian dream.
Answer to question 3:
Particulars Monthly Yearly
Salary $ 6,666.67 $ 80,000.00
Expenses on Amenities $ 1,800.00 $ 21,600.00
Expenses on rent $ 1,450.00 $ 17,400.00
Total expense $ 3,250.00 $ 39,000.00
Tax $17,547.00
Savings $ 1,954.42 $ 23,453.00
Particulars Value
Max LVR 80%
Property Value $ 367,265.00
5
Year 16 $ 1.35 $ 0.15
Year 17 $ 1.41 $ 0.15
Year 18 $ 1.47 $ 0.16
Year 19 $ 1.53 $ 0.16
Year 20 $ 1.60 $ 0.17
Year
0
Year
1
Year
2
Year
3
Year
4
Year
5
Year
6
Year
7
Year
8
Year
9
Year
10
Year
11
Year
12
Year
13
Year
14
Year
15
Year
16
Year
17
Year
18
Year
19
Year
20
$0.08$0.08$0.09$0.09$0.09$0.10$0.10$0.10$0.11$0.11$0.12$0.12$0.13$0.13$0.14$0.14$0.15$0.15$0.16$0.16$0.17
Clinet income in 20 years "In Million"
The above graph and table relatively represents the overall income of the client in
next 20 years which helps in drafting the overall financial plan. the income stream is an
adequate measure which would eventually help in detecting the level of savings that could be
conducted by the client to achieve her Austrian dream.
Answer to question 3:
Particulars Monthly Yearly
Salary $ 6,666.67 $ 80,000.00
Expenses on Amenities $ 1,800.00 $ 21,600.00
Expenses on rent $ 1,450.00 $ 17,400.00
Total expense $ 3,250.00 $ 39,000.00
Tax $17,547.00
Savings $ 1,954.42 $ 23,453.00
Particulars Value
Max LVR 80%
Property Value $ 367,265.00
⊘ This is a preview!⊘
Do you want full access?
Subscribe today to unlock all pages.
Trusted by 1+ million students worldwide
BUSINESS FINANCE
6
Loan From Bank $ 293,812.00
Deposit to bank $ 73,453.00
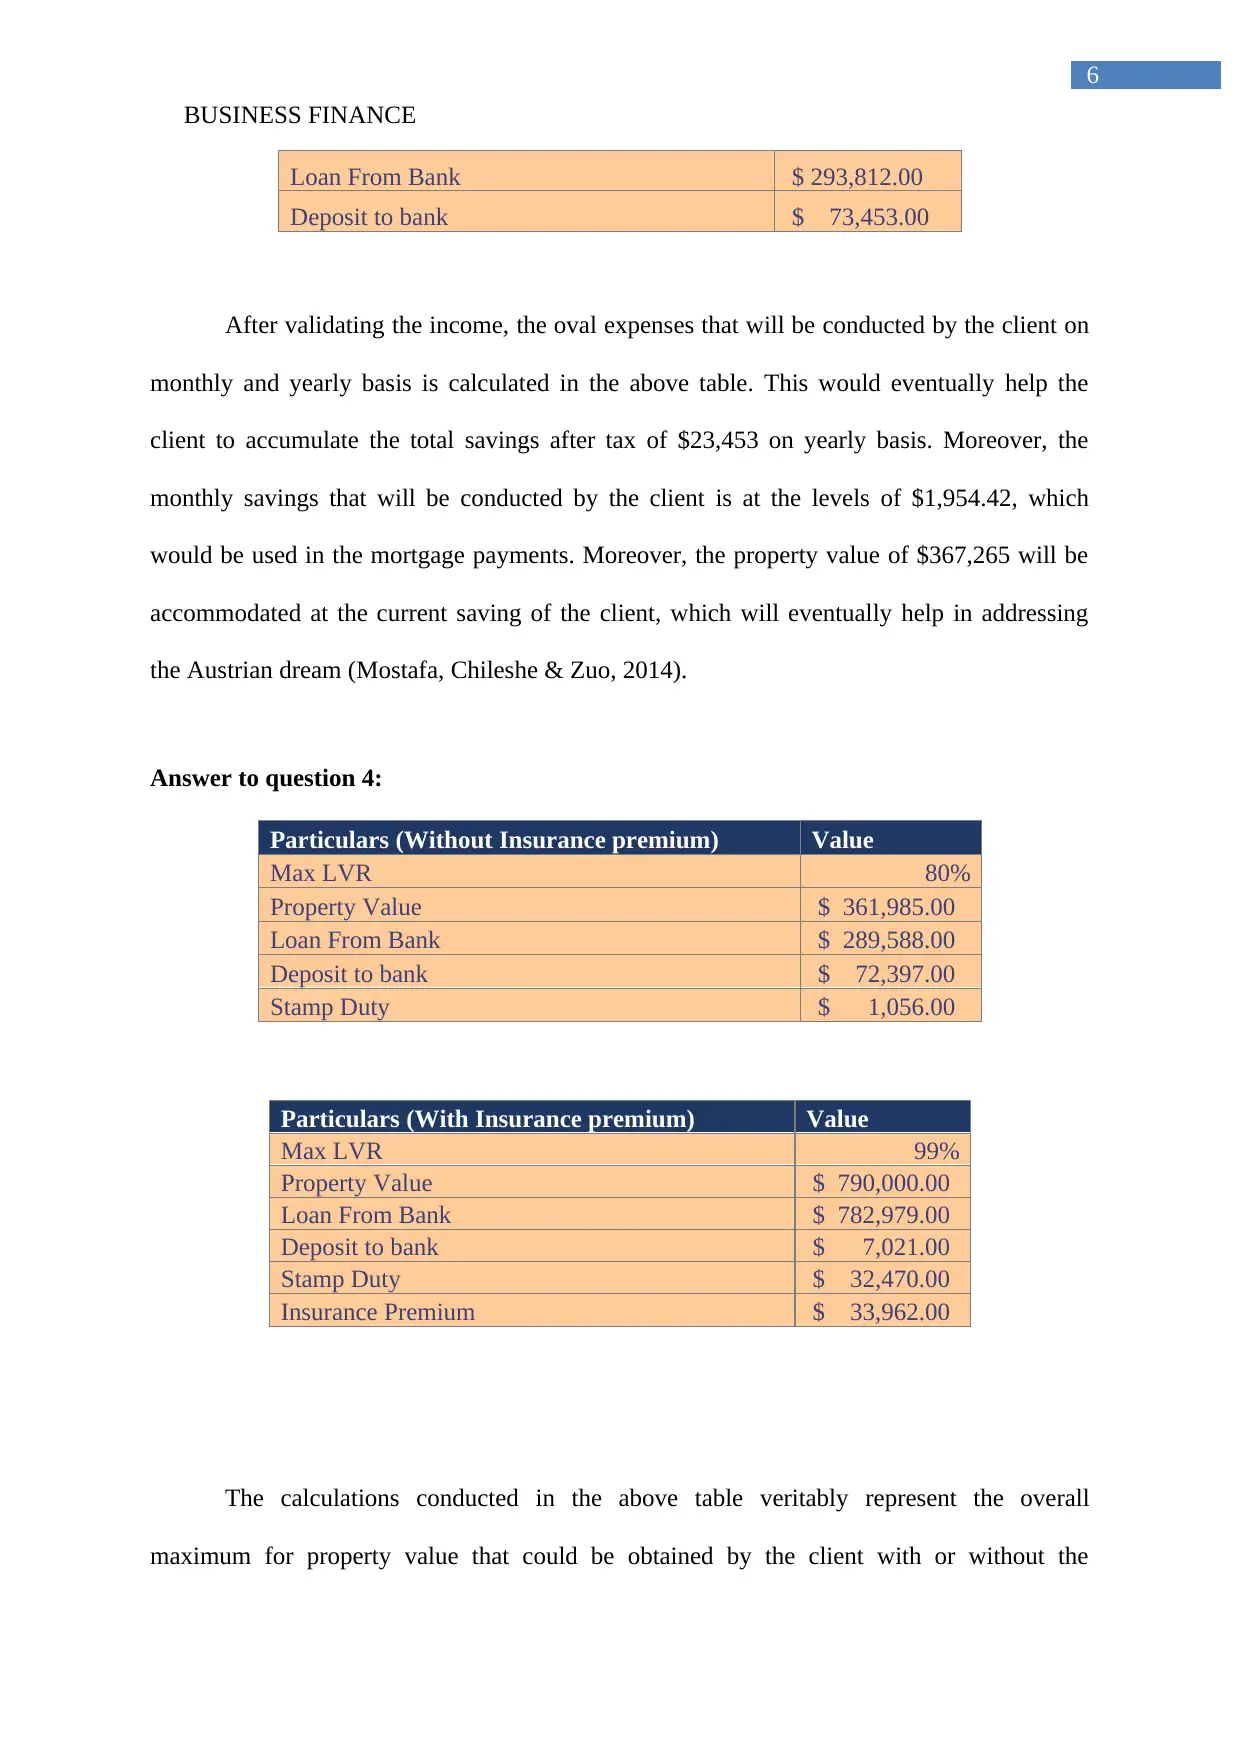
After validating the income, the oval expenses that will be conducted by the client on
monthly and yearly basis is calculated in the above table. This would eventually help the
client to accumulate the total savings after tax of $23,453 on yearly basis. Moreover, the
monthly savings that will be conducted by the client is at the levels of $1,954.42, which
would be used in the mortgage payments. Moreover, the property value of $367,265 will be
accommodated at the current saving of the client, which will eventually help in addressing
the Austrian dream (Mostafa, Chileshe & Zuo, 2014).
Answer to question 4:
Particulars (Without Insurance premium) Value
Max LVR 80%
Property Value $ 361,985.00
Loan From Bank $ 289,588.00
Deposit to bank $ 72,397.00
Stamp Duty $ 1,056.00
Particulars (With Insurance premium) Value
Max LVR 99%
Property Value $ 790,000.00
Loan From Bank $ 782,979.00
Deposit to bank $ 7,021.00
Stamp Duty $ 32,470.00
Insurance Premium $ 33,962.00
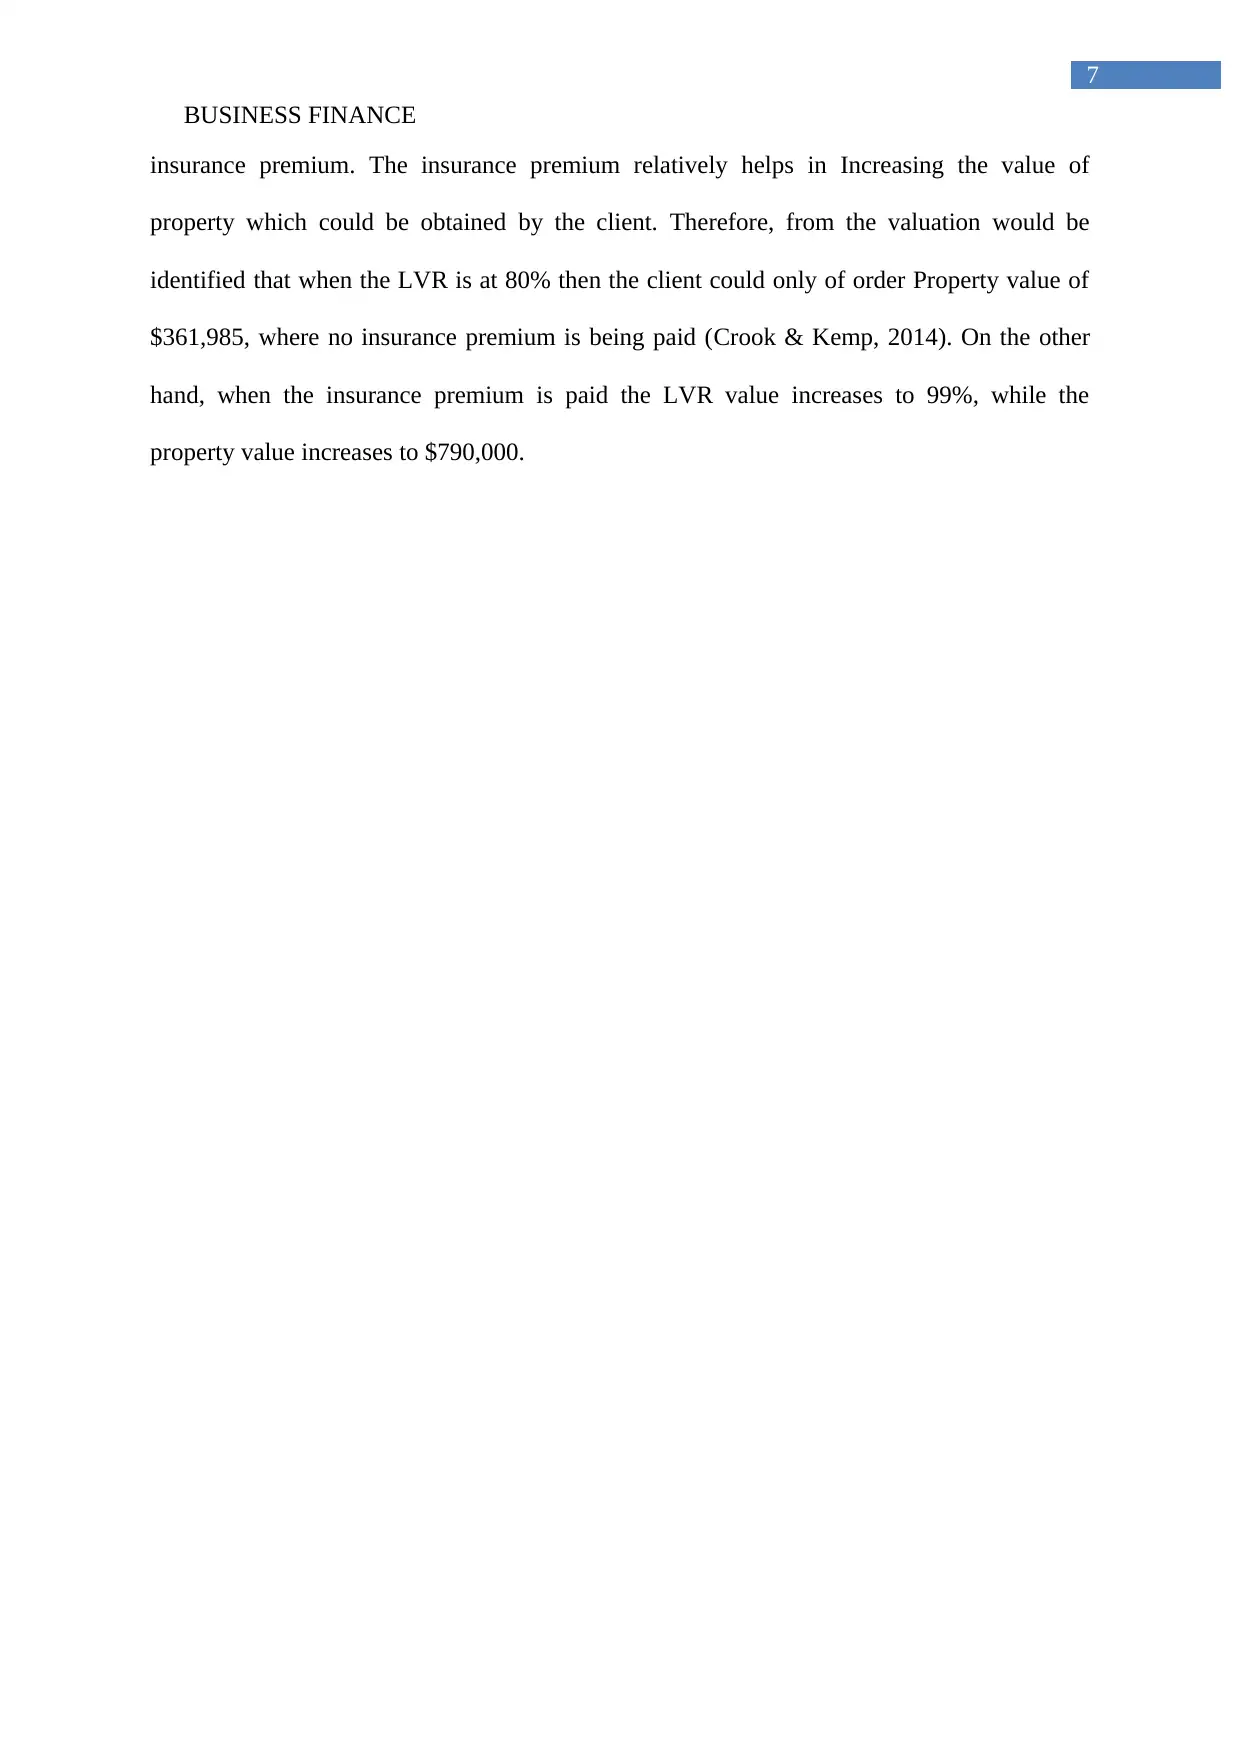
The calculations conducted in the above table veritably represent the overall
maximum for property value that could be obtained by the client with or without the
6
Loan From Bank $ 293,812.00
Deposit to bank $ 73,453.00
After validating the income, the oval expenses that will be conducted by the client on
monthly and yearly basis is calculated in the above table. This would eventually help the
client to accumulate the total savings after tax of $23,453 on yearly basis. Moreover, the
monthly savings that will be conducted by the client is at the levels of $1,954.42, which
would be used in the mortgage payments. Moreover, the property value of $367,265 will be
accommodated at the current saving of the client, which will eventually help in addressing
the Austrian dream (Mostafa, Chileshe & Zuo, 2014).
Answer to question 4:
Particulars (Without Insurance premium) Value
Max LVR 80%
Property Value $ 361,985.00
Loan From Bank $ 289,588.00
Deposit to bank $ 72,397.00
Stamp Duty $ 1,056.00
Particulars (With Insurance premium) Value
Max LVR 99%
Property Value $ 790,000.00
Loan From Bank $ 782,979.00
Deposit to bank $ 7,021.00
Stamp Duty $ 32,470.00
Insurance Premium $ 33,962.00
The calculations conducted in the above table veritably represent the overall
maximum for property value that could be obtained by the client with or without the
Paraphrase This Document
Need a fresh take? Get an instant paraphrase of this document with our AI Paraphraser
BUSINESS FINANCE
7
insurance premium. The insurance premium relatively helps in Increasing the value of
property which could be obtained by the client. Therefore, from the valuation would be
identified that when the LVR is at 80% then the client could only of order Property value of
$361,985, where no insurance premium is being paid (Crook & Kemp, 2014). On the other
hand, when the insurance premium is paid the LVR value increases to 99%, while the
property value increases to $790,000.

8
BUSINESS FINANCE
Answer to question 5:
Yea
r
Property
price Income
Expens
e Tax Saved
Savings
Target Income 20% upfront Stamp duty Difference
0
$
684,000
$
80,000
$
39,000
$
17,547
$
50,000
$
73,453
$
23,453
$
136,800
$
31,868
$
(95,215)
1
$
713,599
$
83,099
$
39,913
$
18,554
$
73,453
$
98,086
$
24,632
$
142,720
$
12,986
$
(57,621)
2
$
744,479
$
86,317
$
40,847
$
19,600
$
98,086
$
123,957
$
25,871
$
148,896
$
13,981
$
(38,920)
3
$
776,694
$
89,661
$
41,802
$
20,806
$
123,957
$
151,009
$
27,052
$
155,339
$
15,019
$
(19,349)
4
$
810,304
$
93,133
$
42,781
$
22,091
$
151,009
$
179,271
$
28,262
$
162,061
$
16,102
$
1,108
5
$
845,369
$
96,741
$
43,782
$
23,426
$
179,271
$
208,804
$
29,533
$
169,074
$
17,231
$
22,499
6
$
881,951
$
100,488
$
44,806
$
24,812
$
208,804
$
239,674
$
30,870
$
176,390
$
18,409
$
44,874
7
$
920,115
$
104,380
$
45,855
$
26,252
$
239,674
$
271,947
$
32,273
$
184,023
$
19,639
$
68,285
8
$
959,932
$
108,423
$
46,928
$
27,748
$
271,947
$
305,694
$
33,747
$
191,986
$
20,921
$
92,786
9
$
1,001,471
$
112,622
$
48,026
$
29,302
$
305,694
$
340,989
$
35,295
$
200,294
$
22,259
$
118,435
10
$
1,044,808
$
116,985
$
49,149
$
30,916
$
340,989
$
377,908
$
36,919
$
208,962
$
23,655
$
145,291
11
$
1,090,020
$
121,516
$
50,300
$
32,592
$
377,908
$
416,532
$
38,624
$
218,004
$
25,112
$
173,416
12
$
1,137,189
$
126,222
$
51,477
$
34,334
$
416,532
$
456,944
$
40,412
$
227,438
$
26,631
$
202,875
⊘ This is a preview!⊘
Do you want full access?
Subscribe today to unlock all pages.
Trusted by 1+ million students worldwide
9
BUSINESS FINANCE
13
$
1,186,398
$
131,111
$
52,681
$
36,143
$
456,944
$
499,231
$
42,287
$
237,280
$
28,216
$
233,735
14
$
1,237,737
$
136,190
$
53,914
$
38,022
$
499,231
$
543,485
$
44,254
$
247,547
$
29,870
$
266,067
15
$
1,291,298
$
141,465
$
55,175
$
39,974
$
543,485
$
589,801
$
46,316
$
258,260
$
31,595
$
299,946
16
$
1,347,177
$
146,944
$
56,467
$
42,001
$
589,801
$
638,277
$
48,477
$
269,435
$
33,395
$
335,446
17
$
1,405,473
$
152,635
$
57,788
$
44,107
$
638,277
$
689,018
$
50,741
$
281,095
$
35,273
$
372,650
18
$
1,466,293
$
158,547
$
59,140
$
46,294
$
689,018
$
742,131
$
53,113
$
293,259
$
37,232
$
411,640
19
$
1,529,744
$
164,688
$
60,524
$
48,566
$
742,131
$
797,729
$
55,598
$
305,949
$
39,276
$
452,504
20
$
1,595,941
$
171,067
$
61,940
$
50,927
$
797,729
$
855,930
$
58,201
$
319,188
$
41,408
$
495,333
Ye
ar
Property
price Income
Expen
se Tax Saved
Savings
Target
5%
upfront
Insurance
premium
Stamp
duty
Total
payment Amount
0
$
684,000
$
80,000
$
39,000
$
17,547
$
50,000
$
73,453
$
34,200
$
20,222
$
31,868
$
86,290
$
(12,837)
1
$
713,599
$
83,099
$
39,913
$
18,554
$
73,453
$
98,086
$
35,680
$
21,097
$
12,986
$
69,763
$
28,322
2
$
744,479
$
86,317
$
40,847
$
19,600
$
98,086
$
123,957
$
37,224
$
22,010
$
13,981
$
73,215
$
50,741
3
$
776,694
$
89,661
$
41,802
$
20,806
$
123,957
$
151,009
$
38,835
$
22,962
$
15,019
$
76,816
$
74,193
4
$
810,304
$
93,133
$
42,781
$
22,091
$
151,009
$
179,271
$
40,515
$
23,956
$
16,102
$
80,573
$
98,698
5 $ $ $ $ $ $ $ $ $ $ $
Paraphrase This Document
Need a fresh take? Get an instant paraphrase of this document with our AI Paraphraser

10
BUSINESS FINANCE
845,369 96,741 43,782 23,426 179,271 208,804 42,268 24,993 17,231 84,492 124,312
6
$
881,951
$
100,48
8
$
44,806
$
24,812
$
208,804
$
239,674
$
44,098
$
26,074
$
18,409
$
88,581
$
151,092
7
$
920,115
$
104,38
0
$
45,855
$
26,252
$
239,674
$
271,947
$
46,006
$
27,203
$
19,639
$
92,847
$
179,100
8
$
959,932
$
108,42
3
$
46,928
$
27,748
$
271,947
$
305,694
$
47,997
$
28,380
$
20,921
$
97,298
$
208,396
9
$
1,001,471
$
112,62
2
$
48,026
$
29,302
$
305,694
$
340,989
$
50,074
$
29,608
$
22,259
$
101,941
$
239,048
10
$
1,044,808
$
116,98
5
$
49,149
$
30,916
$
340,989
$
377,908
$
52,240
$
30,889
$
23,655
$
106,785
$
271,123
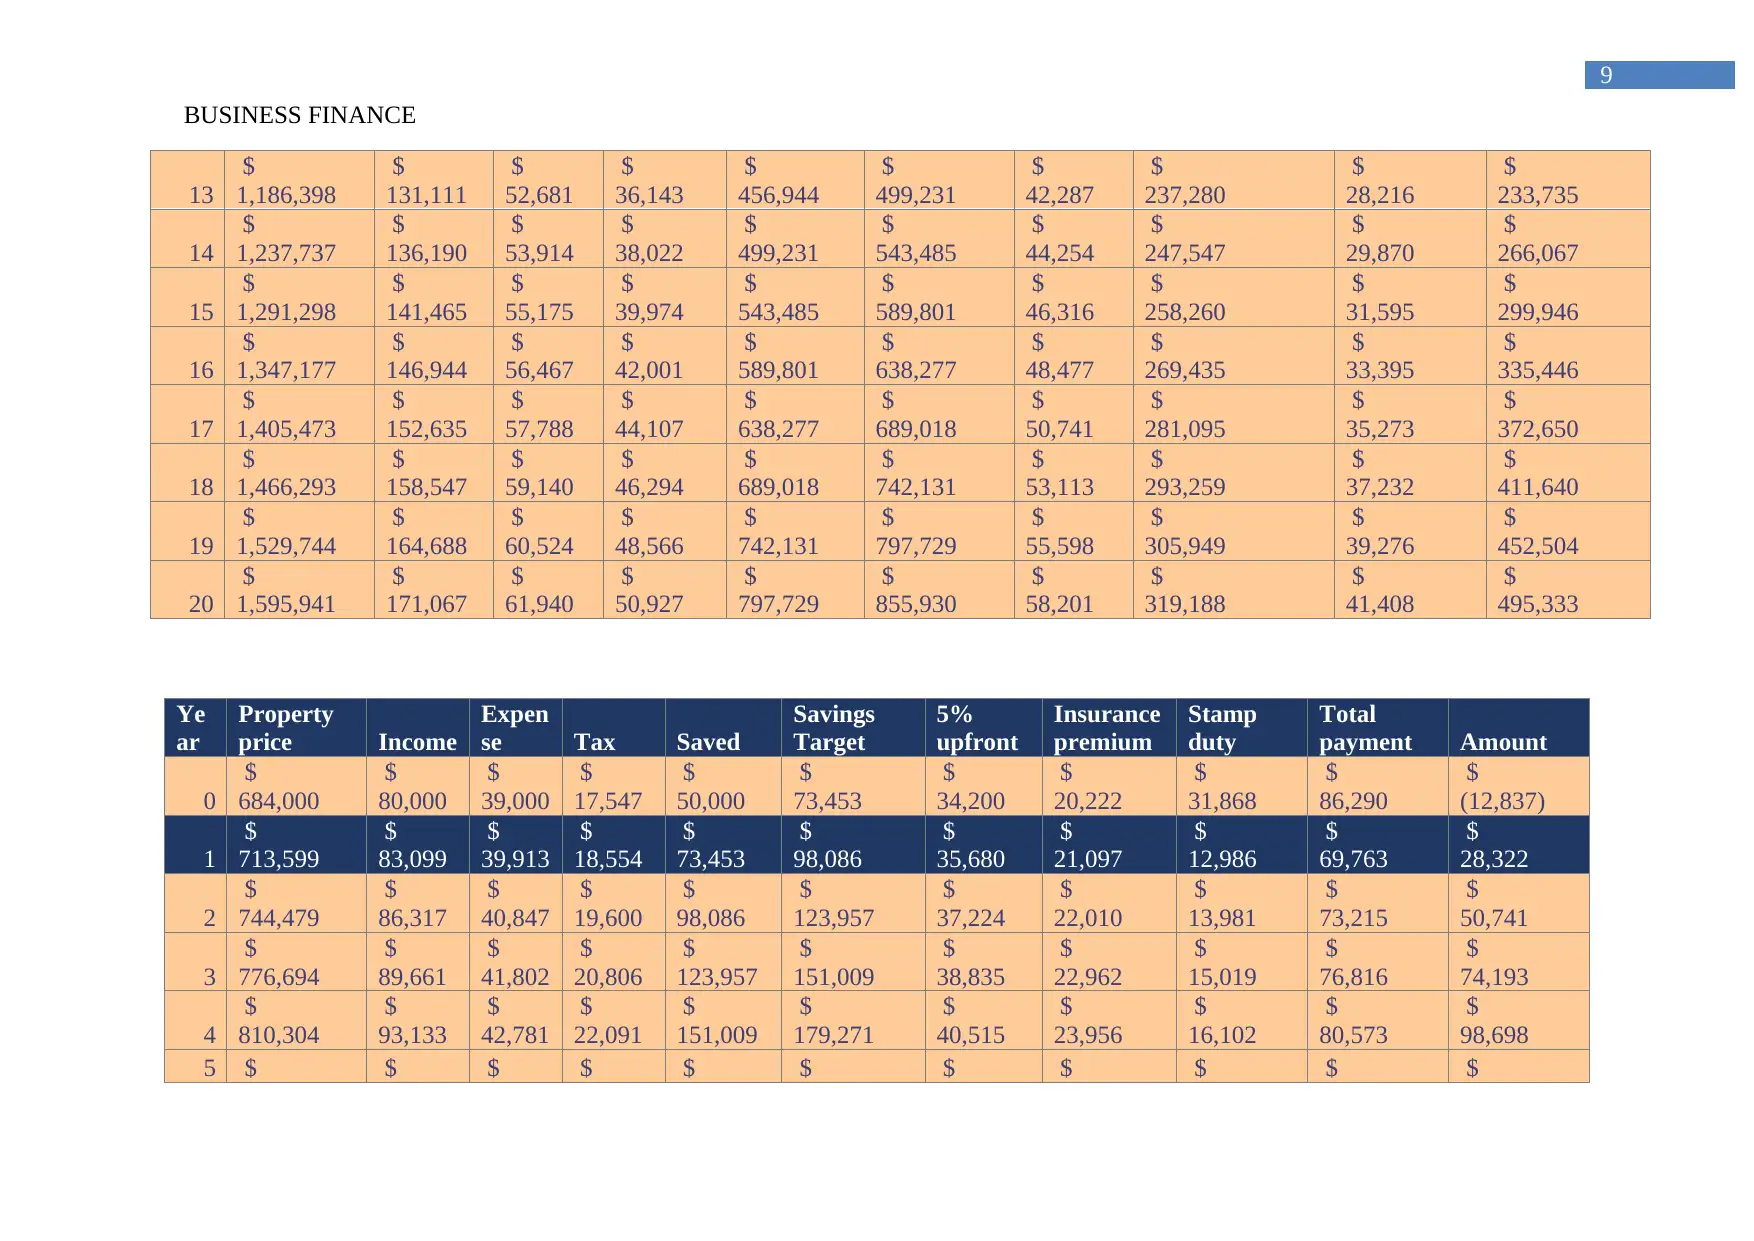
The calculations conducted in the above table relatively represents the ability of the client to purchase the property when the upfront
payment is at the levels of 5% and 20%. from the evaluation it is detected that within a friend payment of 20% the client could purchase house
in year 4, while within a friend payment of 5% the property can be purchased in year 1.
BUSINESS FINANCE
845,369 96,741 43,782 23,426 179,271 208,804 42,268 24,993 17,231 84,492 124,312
6
$
881,951
$
100,48
8
$
44,806
$
24,812
$
208,804
$
239,674
$
44,098
$
26,074
$
18,409
$
88,581
$
151,092
7
$
920,115
$
104,38
0
$
45,855
$
26,252
$
239,674
$
271,947
$
46,006
$
27,203
$
19,639
$
92,847
$
179,100
8
$
959,932
$
108,42
3
$
46,928
$
27,748
$
271,947
$
305,694
$
47,997
$
28,380
$
20,921
$
97,298
$
208,396
9
$
1,001,471
$
112,62
2
$
48,026
$
29,302
$
305,694
$
340,989
$
50,074
$
29,608
$
22,259
$
101,941
$
239,048
10
$
1,044,808
$
116,98
5
$
49,149
$
30,916
$
340,989
$
377,908
$
52,240
$
30,889
$
23,655
$
106,785
$
271,123
The calculations conducted in the above table relatively represents the ability of the client to purchase the property when the upfront
payment is at the levels of 5% and 20%. from the evaluation it is detected that within a friend payment of 20% the client could purchase house
in year 4, while within a friend payment of 5% the property can be purchased in year 1.
BUSINESS FINANCE
11
Answer to question 6:
Property value $ 713,599
Loan amount $ 677,919
Year Interest rate Mortgage Payment Saved Savings
2 3.39% $22,981 $ 72,417 $ 49,435
3 3.39% $22,981 $ 95,138 $72,157
4 3.39% $22,981 $ 119,505 $96,524
5 7.00% $47,454 $ 145,590 $98,136
Year Income Expense Tax Net Income
0 $ 80,000 $ 21,600 $ 17,547 $ 40,853
1 $ 83,099 $ 22,105 $ 18,554 $ 42,439
2 $ 86,317 $ 22,623 $ 19,600 $ 44,095
3 $ 89,661 $ 23,152 $ 20,806 $ 45,702
4 $ 93,133 $ 23,694 $ 22,091 $ 47,349
5 $ 96,741 $ 24,248 $ 23,426 $ 49,067
6 $ 100,488 $ 24,816 $ 24,812 $ 50,860
7 $ 104,380 $ 25,396 $ 26,252 $ 52,731
8 $ 108,423 $ 25,991 $ 27,748 $ 54,684
9 $ 112,622 $ 26,599 $ 29,302 $ 56,722
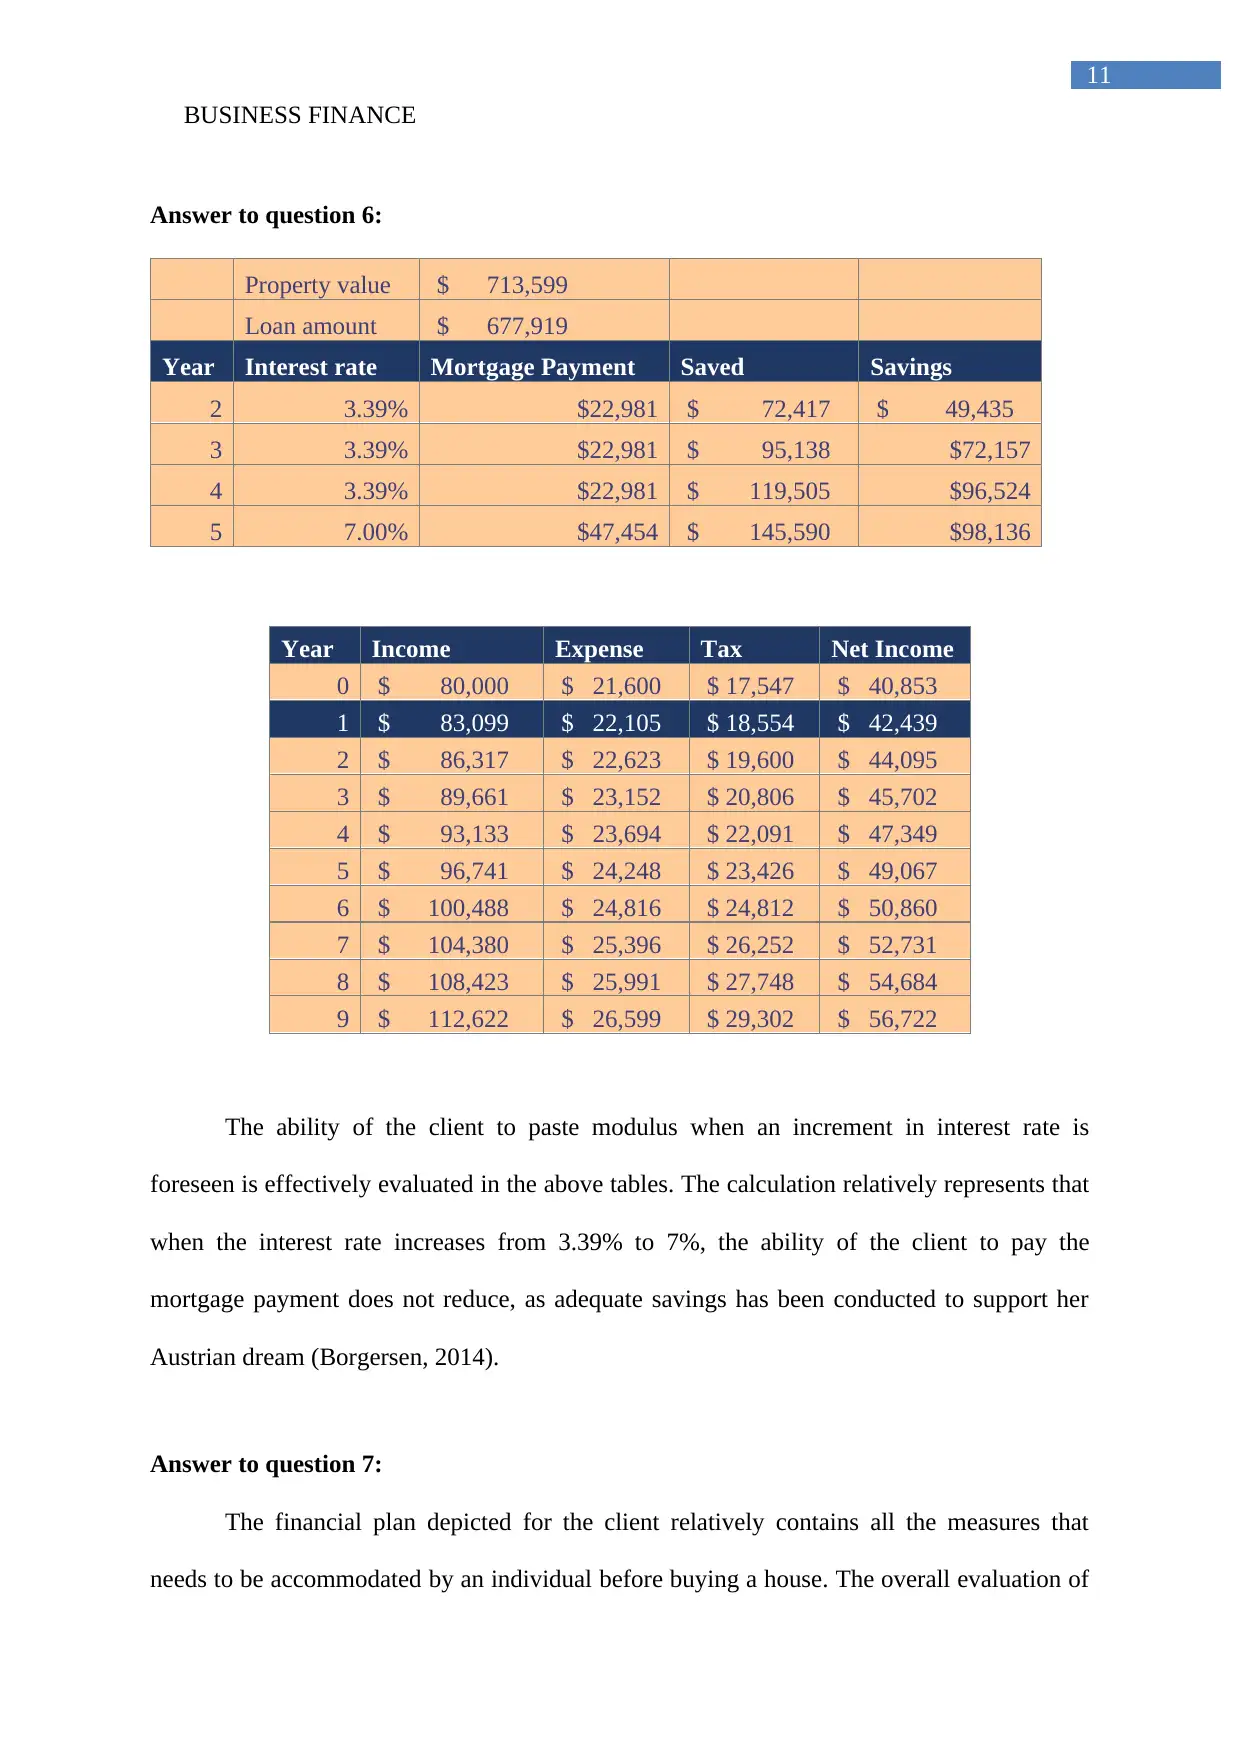
The ability of the client to paste modulus when an increment in interest rate is
foreseen is effectively evaluated in the above tables. The calculation relatively represents that
when the interest rate increases from 3.39% to 7%, the ability of the client to pay the
mortgage payment does not reduce, as adequate savings has been conducted to support her
Austrian dream (Borgersen, 2014).
Answer to question 7:
The financial plan depicted for the client relatively contains all the measures that
needs to be accommodated by an individual before buying a house. The overall evaluation of
11
Answer to question 6:
Property value $ 713,599
Loan amount $ 677,919
Year Interest rate Mortgage Payment Saved Savings
2 3.39% $22,981 $ 72,417 $ 49,435
3 3.39% $22,981 $ 95,138 $72,157
4 3.39% $22,981 $ 119,505 $96,524
5 7.00% $47,454 $ 145,590 $98,136
Year Income Expense Tax Net Income
0 $ 80,000 $ 21,600 $ 17,547 $ 40,853
1 $ 83,099 $ 22,105 $ 18,554 $ 42,439
2 $ 86,317 $ 22,623 $ 19,600 $ 44,095
3 $ 89,661 $ 23,152 $ 20,806 $ 45,702
4 $ 93,133 $ 23,694 $ 22,091 $ 47,349
5 $ 96,741 $ 24,248 $ 23,426 $ 49,067
6 $ 100,488 $ 24,816 $ 24,812 $ 50,860
7 $ 104,380 $ 25,396 $ 26,252 $ 52,731
8 $ 108,423 $ 25,991 $ 27,748 $ 54,684
9 $ 112,622 $ 26,599 $ 29,302 $ 56,722
The ability of the client to paste modulus when an increment in interest rate is
foreseen is effectively evaluated in the above tables. The calculation relatively represents that
when the interest rate increases from 3.39% to 7%, the ability of the client to pay the
mortgage payment does not reduce, as adequate savings has been conducted to support her
Austrian dream (Borgersen, 2014).
Answer to question 7:
The financial plan depicted for the client relatively contains all the measures that
needs to be accommodated by an individual before buying a house. The overall evaluation of
⊘ This is a preview!⊘
Do you want full access?
Subscribe today to unlock all pages.
Trusted by 1+ million students worldwide
1 out of 15

Your All-in-One AI-Powered Toolkit for Academic Success.
+13062052269
info@desklib.com
Available 24*7 on WhatsApp / Email
![[object Object]](/_next/static/media/star-bottom.7253800d.svg)
Unlock your academic potential
Copyright © 2020–2026 A2Z Services. All Rights Reserved. Developed and managed by ZUCOL.