Business Intelligence and Smart Connected Products
VerifiedAdded on 2023/06/13
|16
|2307
|315
AI Summary
This report discusses the role of smart, connected products in business analytics and how they help transform companies with the use of business intelligence. It also explores the relationship between smart, connected products and business analytics.
Contribute Materials
Your contribution can guide someone’s learning journey. Share your
documents today.

Running head: BUSINESS INTELLIGENCE
Business Intelligence
Assessment item 1 – Assignment 1
Student Name:
University Name:
Business Intelligence
Assessment item 1 – Assignment 1
Student Name:
University Name:
Secure Best Marks with AI Grader
Need help grading? Try our AI Grader for instant feedback on your assignments.
1BUSINESS INTELLIGENCE
Table of Contents
Part – A............................................................................................................................................2
Question 1....................................................................................................................................2
Result analysis.........................................................................................................................3
Question 2....................................................................................................................................3
Result analysis.........................................................................................................................5
Question 3....................................................................................................................................5
Result analysis.........................................................................................................................7
Part – B............................................................................................................................................8
Demonstration 1...........................................................................................................................8
First dashboard.........................................................................................................................8
Second dashboard....................................................................................................................8
Answer to questions.................................................................................................................9
Demonstration 2...........................................................................................................................9
First dashboard.........................................................................................................................9
Second dashboard..................................................................................................................10
Answer to questions...............................................................................................................10
Part C – Analysis of Case Study....................................................................................................11
Bibliography..................................................................................................................................15
2BUSINESS INTELLIGENCE
Part – A
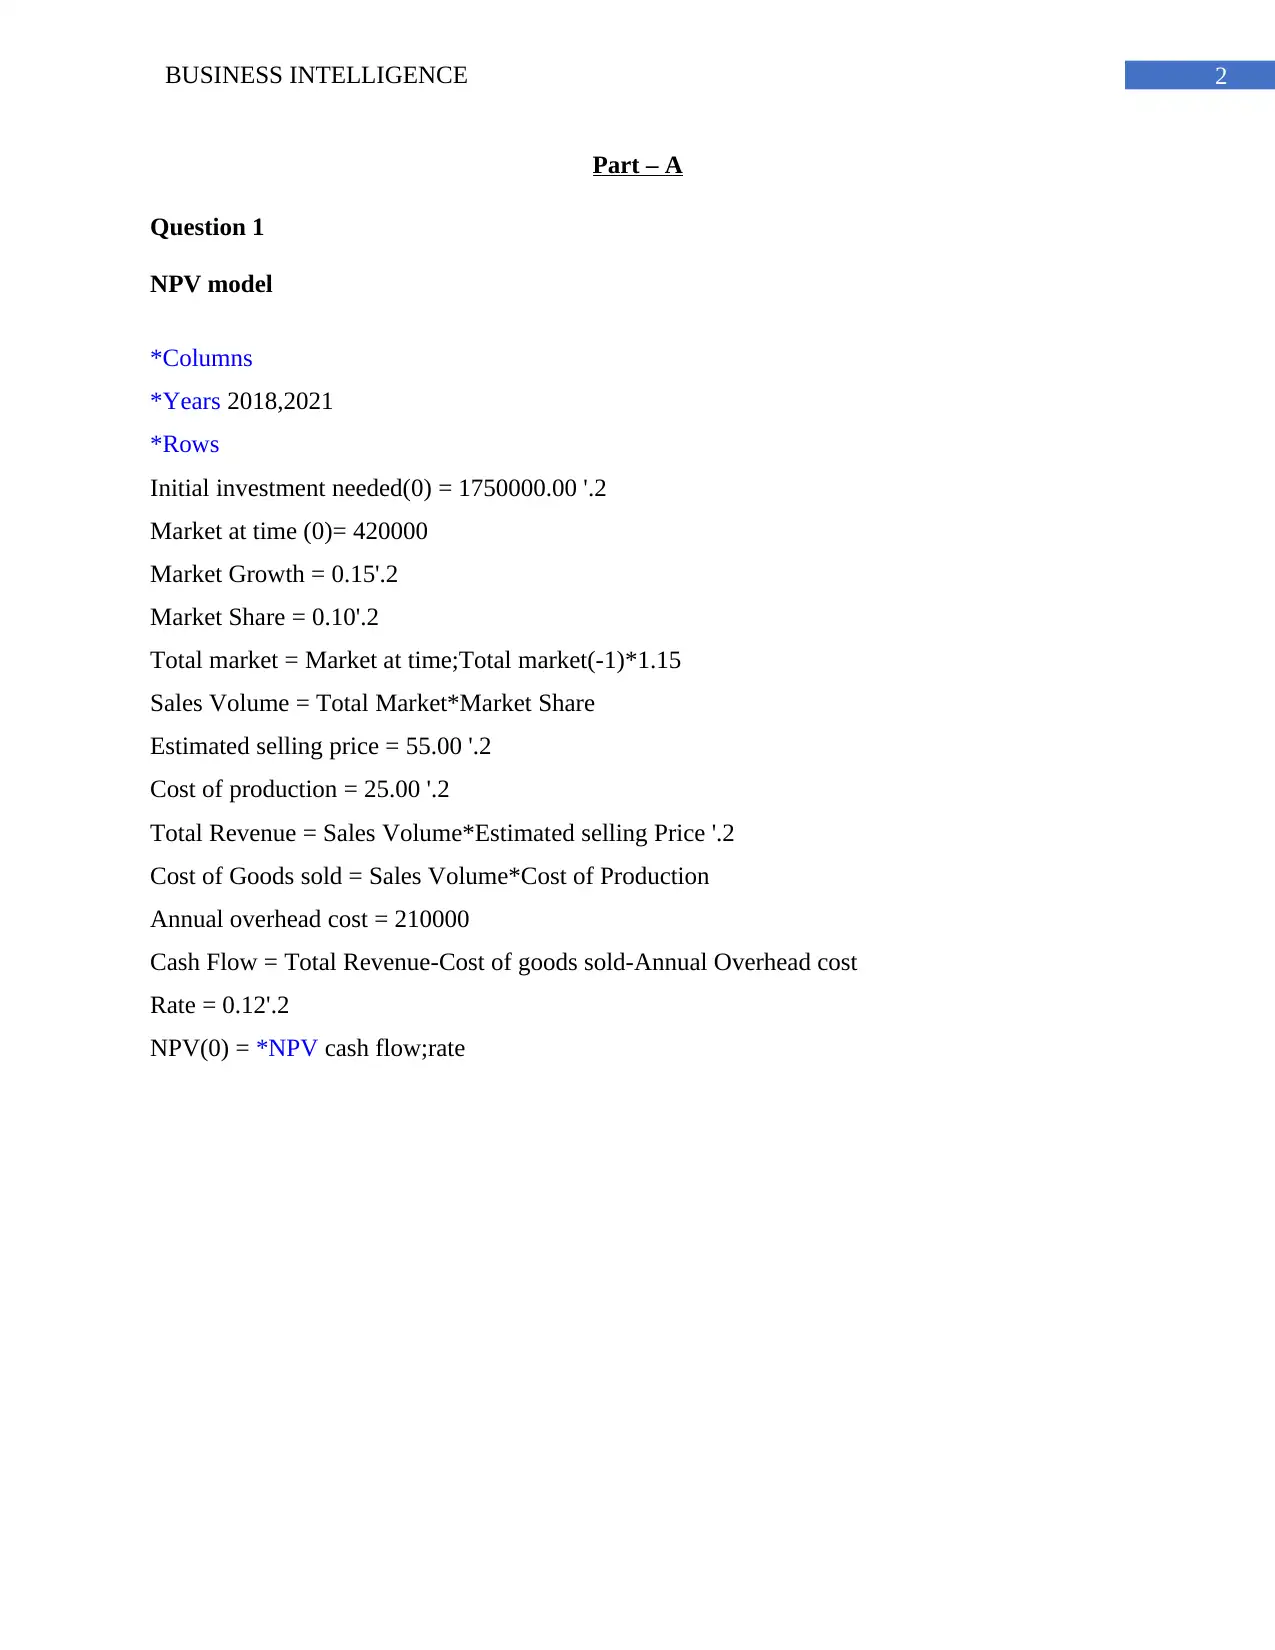
Question 1
NPV model
*Columns
*Years 2018,2021
*Rows
Initial investment needed(0) = 1750000.00 '.2
Market at time (0)= 420000
Market Growth = 0.15'.2
Market Share = 0.10'.2
Total market = Market at time;Total market(-1)*1.15
Sales Volume = Total Market*Market Share
Estimated selling price = 55.00 '.2
Cost of production = 25.00 '.2
Total Revenue = Sales Volume*Estimated selling Price '.2
Cost of Goods sold = Sales Volume*Cost of Production
Annual overhead cost = 210000
Cash Flow = Total Revenue-Cost of goods sold-Annual Overhead cost
Rate = 0.12'.2
NPV(0) = *NPV cash flow;rate
Part – A
Question 1
NPV model
*Columns
*Years 2018,2021
*Rows
Initial investment needed(0) = 1750000.00 '.2
Market at time (0)= 420000
Market Growth = 0.15'.2
Market Share = 0.10'.2
Total market = Market at time;Total market(-1)*1.15
Sales Volume = Total Market*Market Share
Estimated selling price = 55.00 '.2
Cost of production = 25.00 '.2
Total Revenue = Sales Volume*Estimated selling Price '.2
Cost of Goods sold = Sales Volume*Cost of Production
Annual overhead cost = 210000
Cash Flow = Total Revenue-Cost of goods sold-Annual Overhead cost
Rate = 0.12'.2
NPV(0) = *NPV cash flow;rate
3BUSINESS INTELLIGENCE
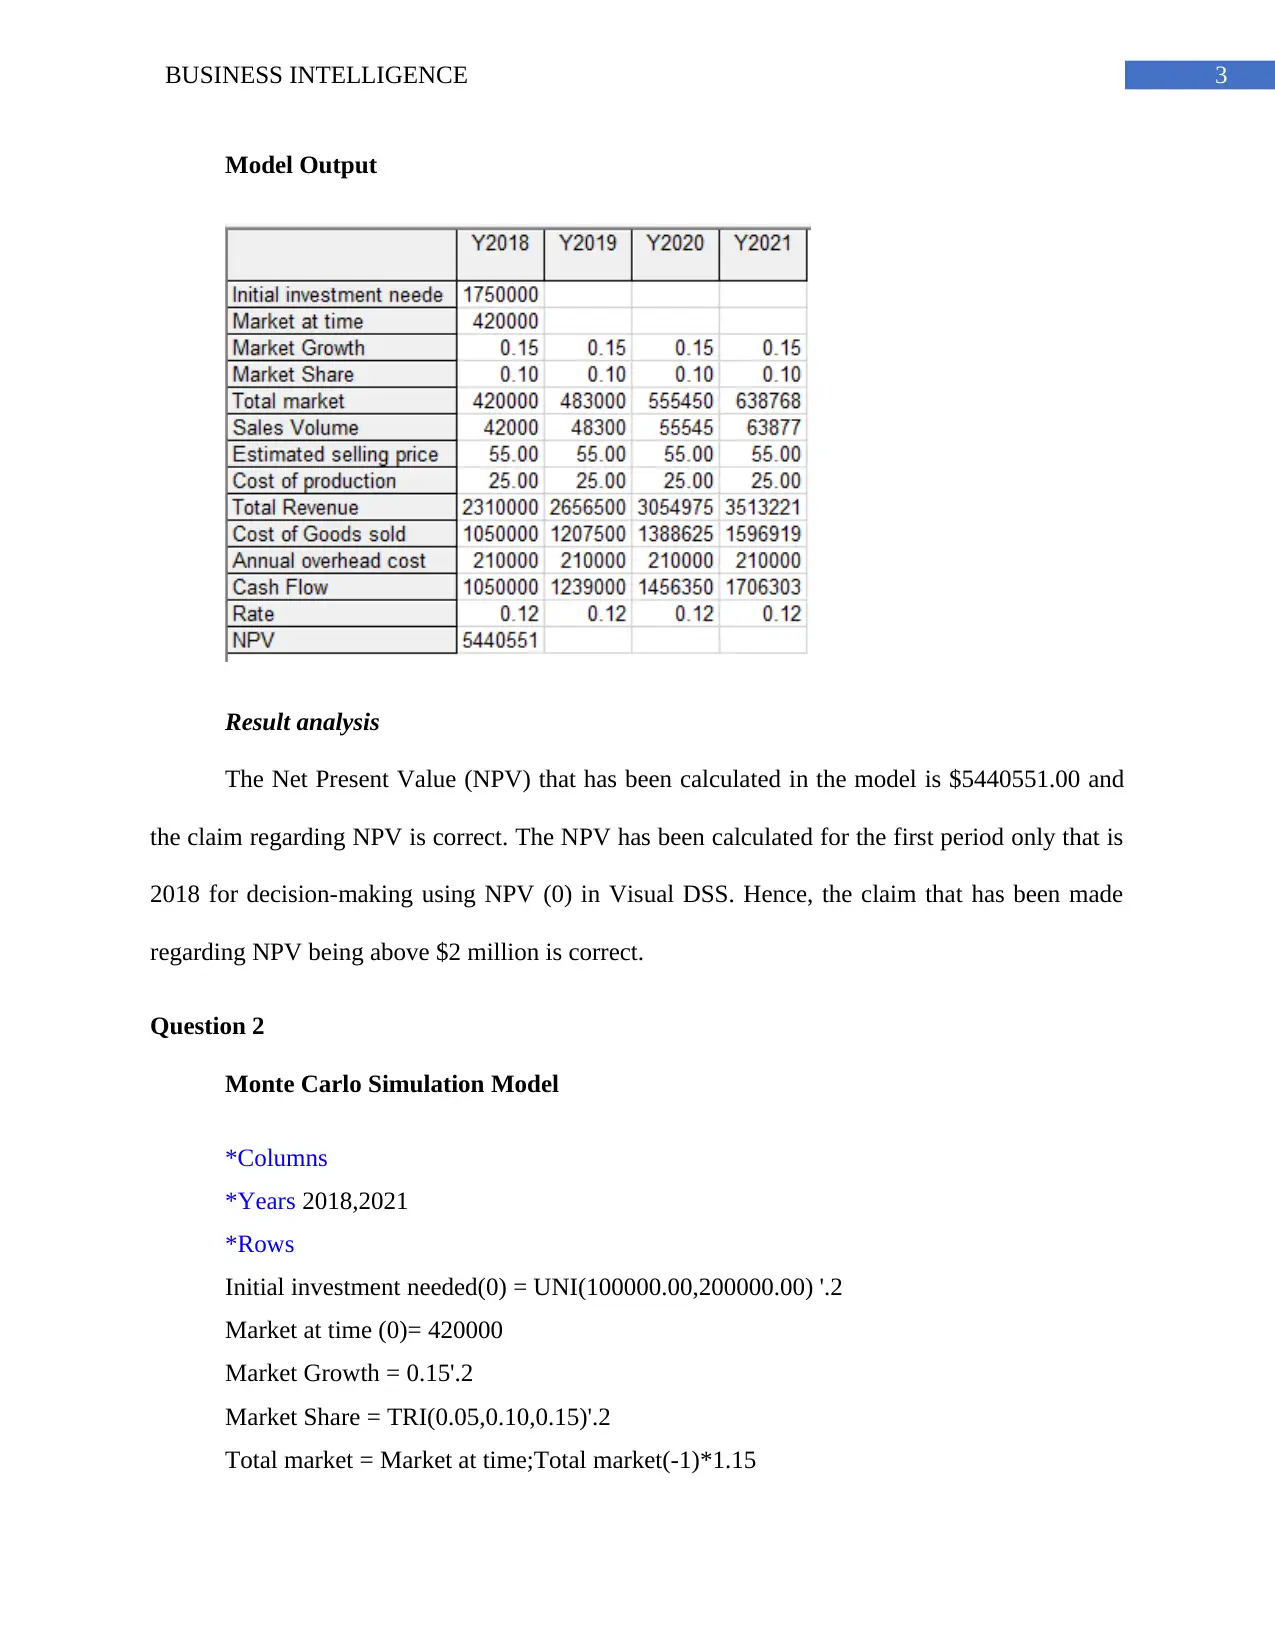
Model Output
Result analysis
The Net Present Value (NPV) that has been calculated in the model is $5440551.00 and
the claim regarding NPV is correct. The NPV has been calculated for the first period only that is
2018 for decision-making using NPV (0) in Visual DSS. Hence, the claim that has been made
regarding NPV being above $2 million is correct.
Question 2
Monte Carlo Simulation Model
*Columns
*Years 2018,2021
*Rows
Initial investment needed(0) = UNI(100000.00,200000.00) '.2
Market at time (0)= 420000
Market Growth = 0.15'.2
Market Share = TRI(0.05,0.10,0.15)'.2
Total market = Market at time;Total market(-1)*1.15
Secure Best Marks with AI Grader
Need help grading? Try our AI Grader for instant feedback on your assignments.
4BUSINESS INTELLIGENCE
Sales Volume = Total Market*Market Share
Estimated selling price = 55.00 '.2
Cost of production = NOR(30.00,12.00) '.2
Total Revenue = Sales Volume*Estimated selling Price '.2
Cost of Goods sold = Sales Volume*Cost of Production
Annual overhead cost = TRI(150000,215000,350000)
Cash Flow = Total Revenue-Cost of goods sold-Annual Overhead cost
Rate = 0.12'.2
NPV(0) = *NPV cash flow;rate
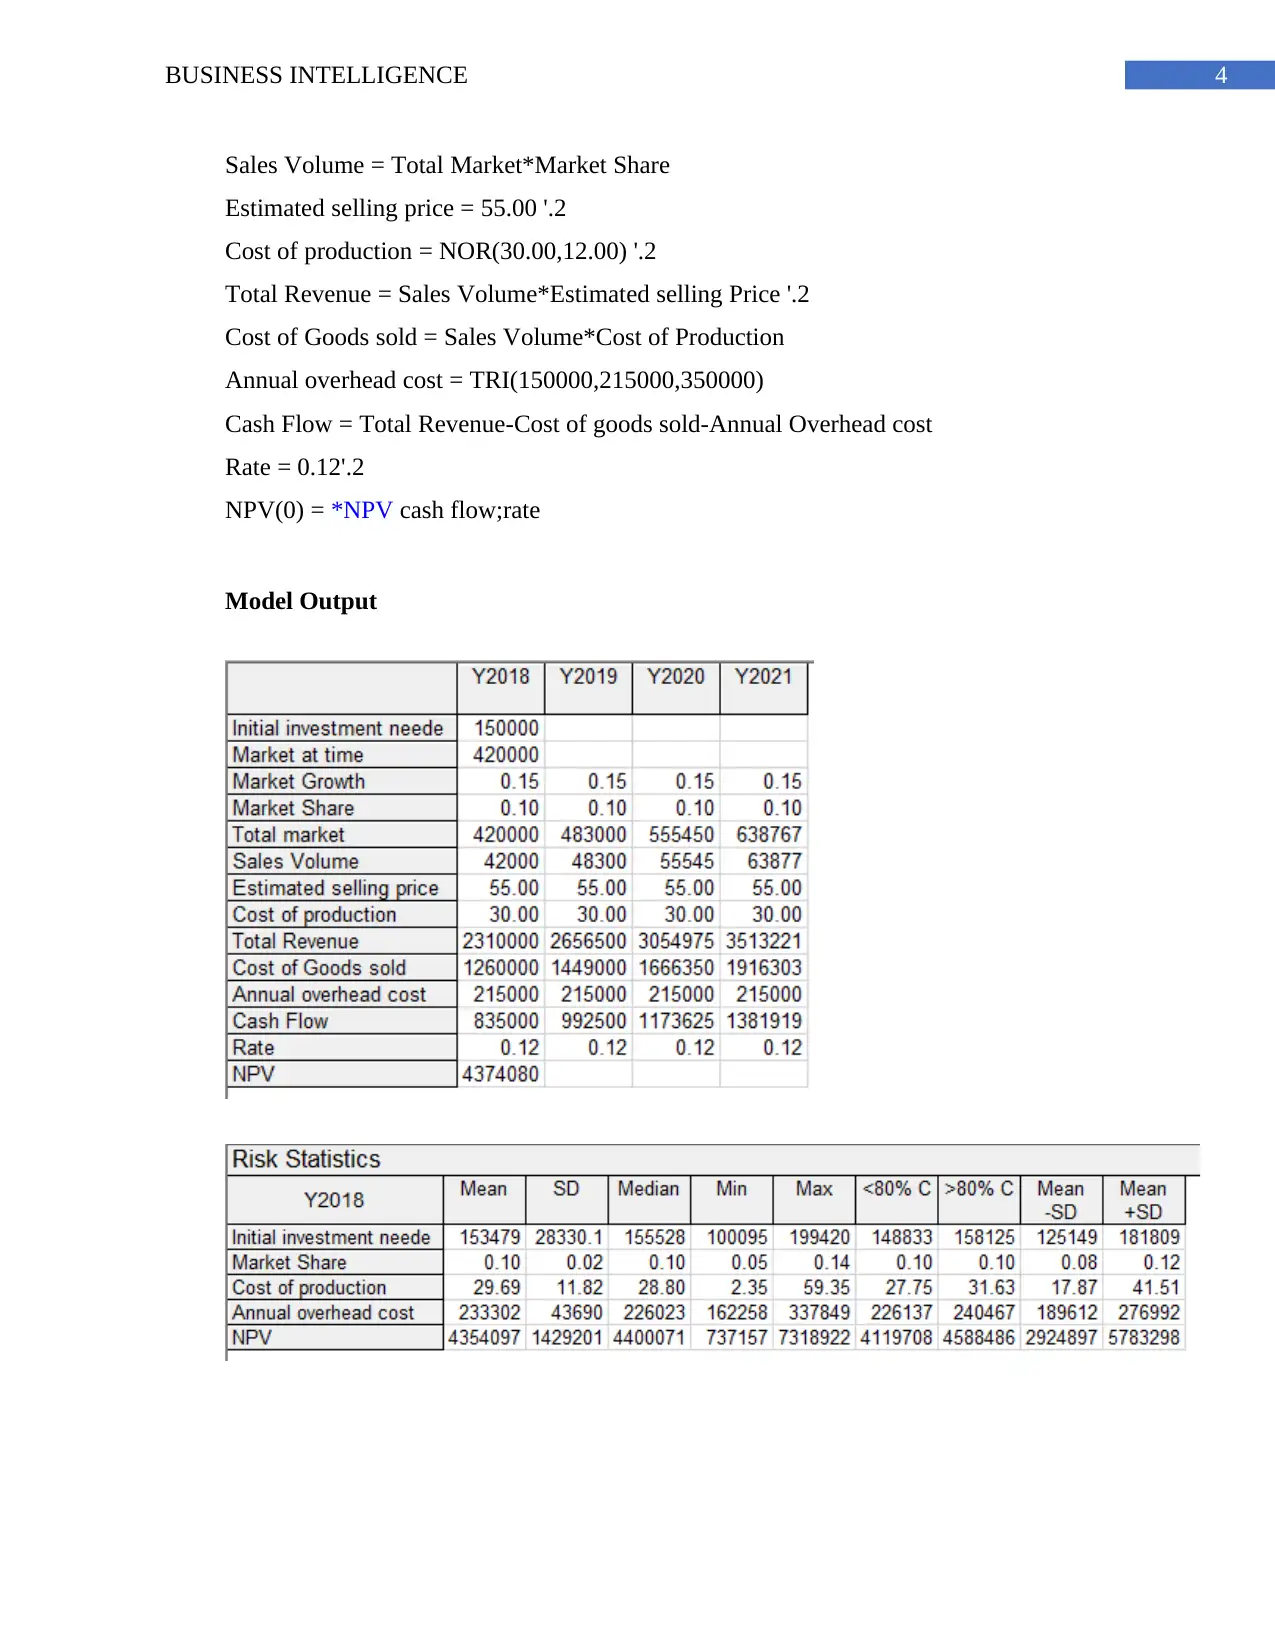
Model Output
Sales Volume = Total Market*Market Share
Estimated selling price = 55.00 '.2
Cost of production = NOR(30.00,12.00) '.2
Total Revenue = Sales Volume*Estimated selling Price '.2
Cost of Goods sold = Sales Volume*Cost of Production
Annual overhead cost = TRI(150000,215000,350000)
Cash Flow = Total Revenue-Cost of goods sold-Annual Overhead cost
Rate = 0.12'.2
NPV(0) = *NPV cash flow;rate
Model Output
5BUSINESS INTELLIGENCE
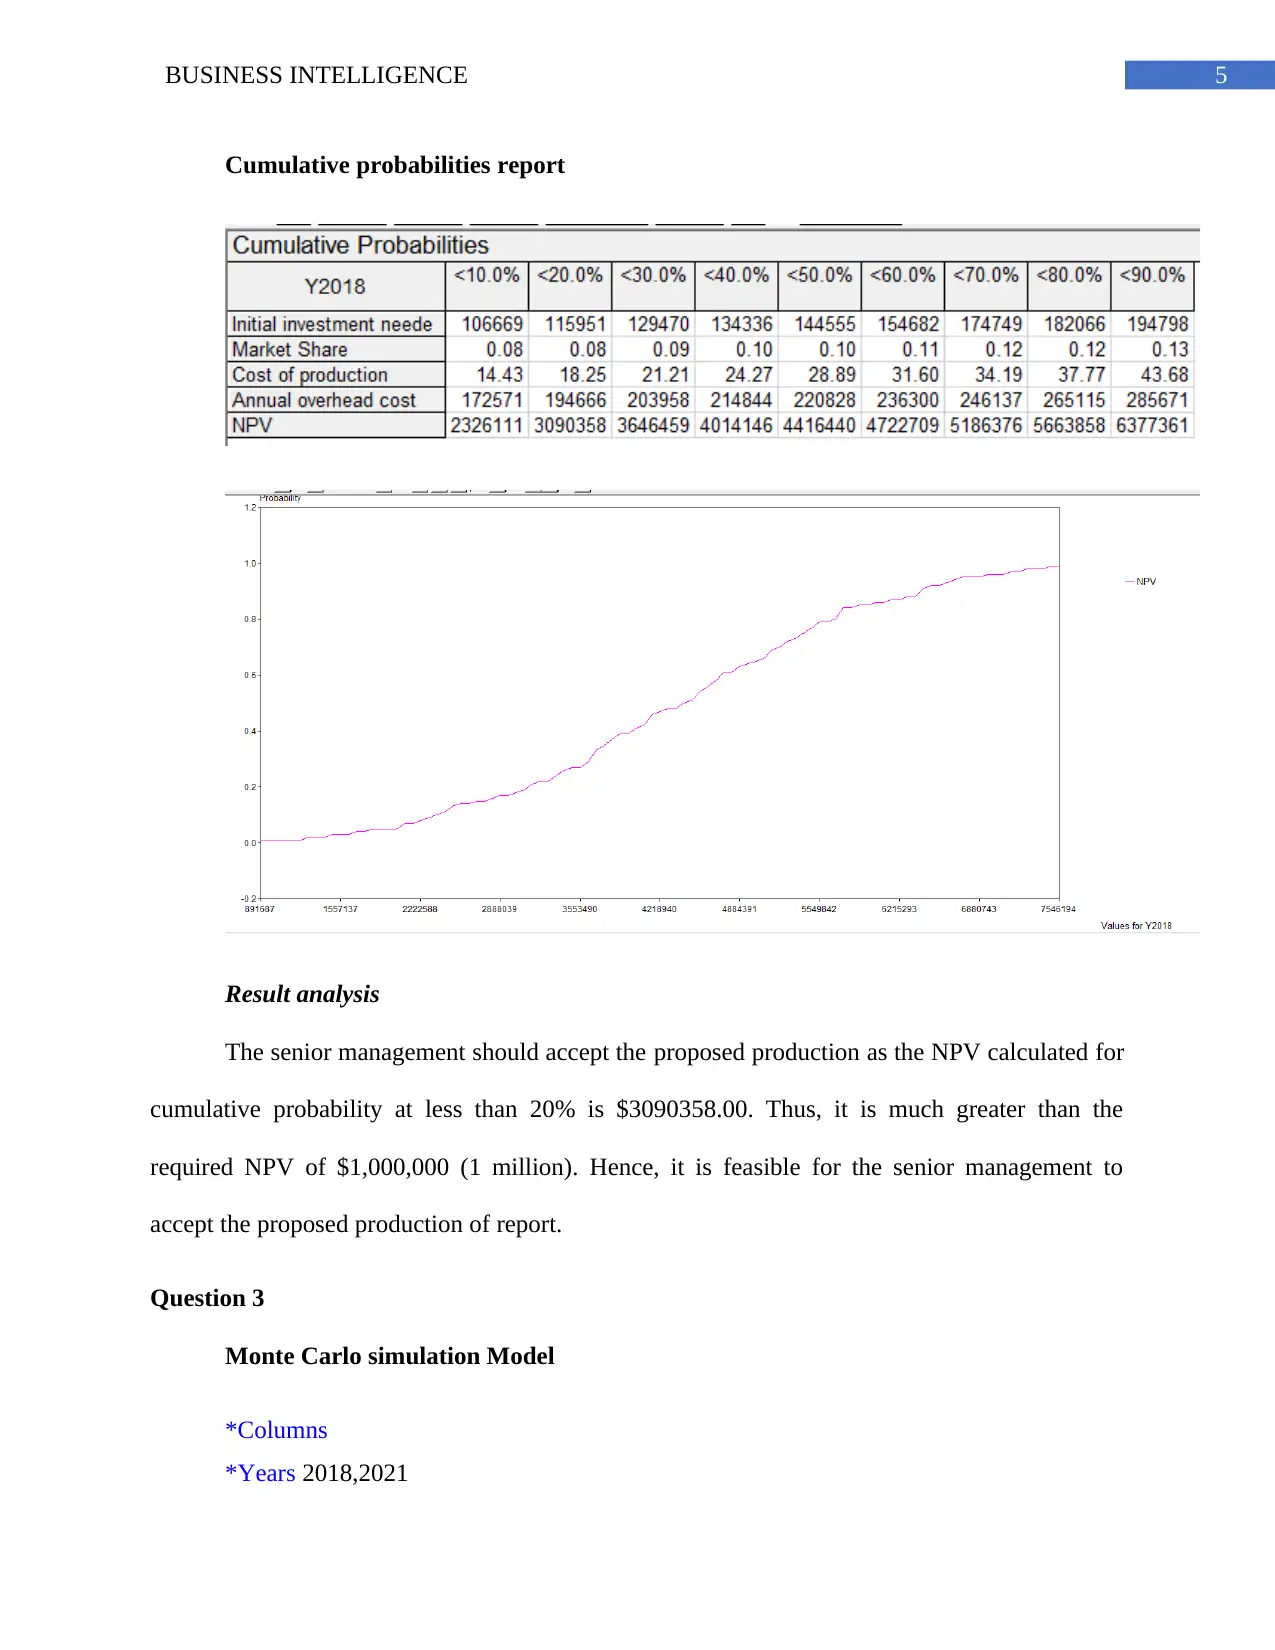
Cumulative probabilities report
Result analysis
The senior management should accept the proposed production as the NPV calculated for
cumulative probability at less than 20% is $3090358.00. Thus, it is much greater than the
required NPV of $1,000,000 (1 million). Hence, it is feasible for the senior management to
accept the proposed production of report.
Question 3
Monte Carlo simulation Model
*Columns
*Years 2018,2021
6BUSINESS INTELLIGENCE
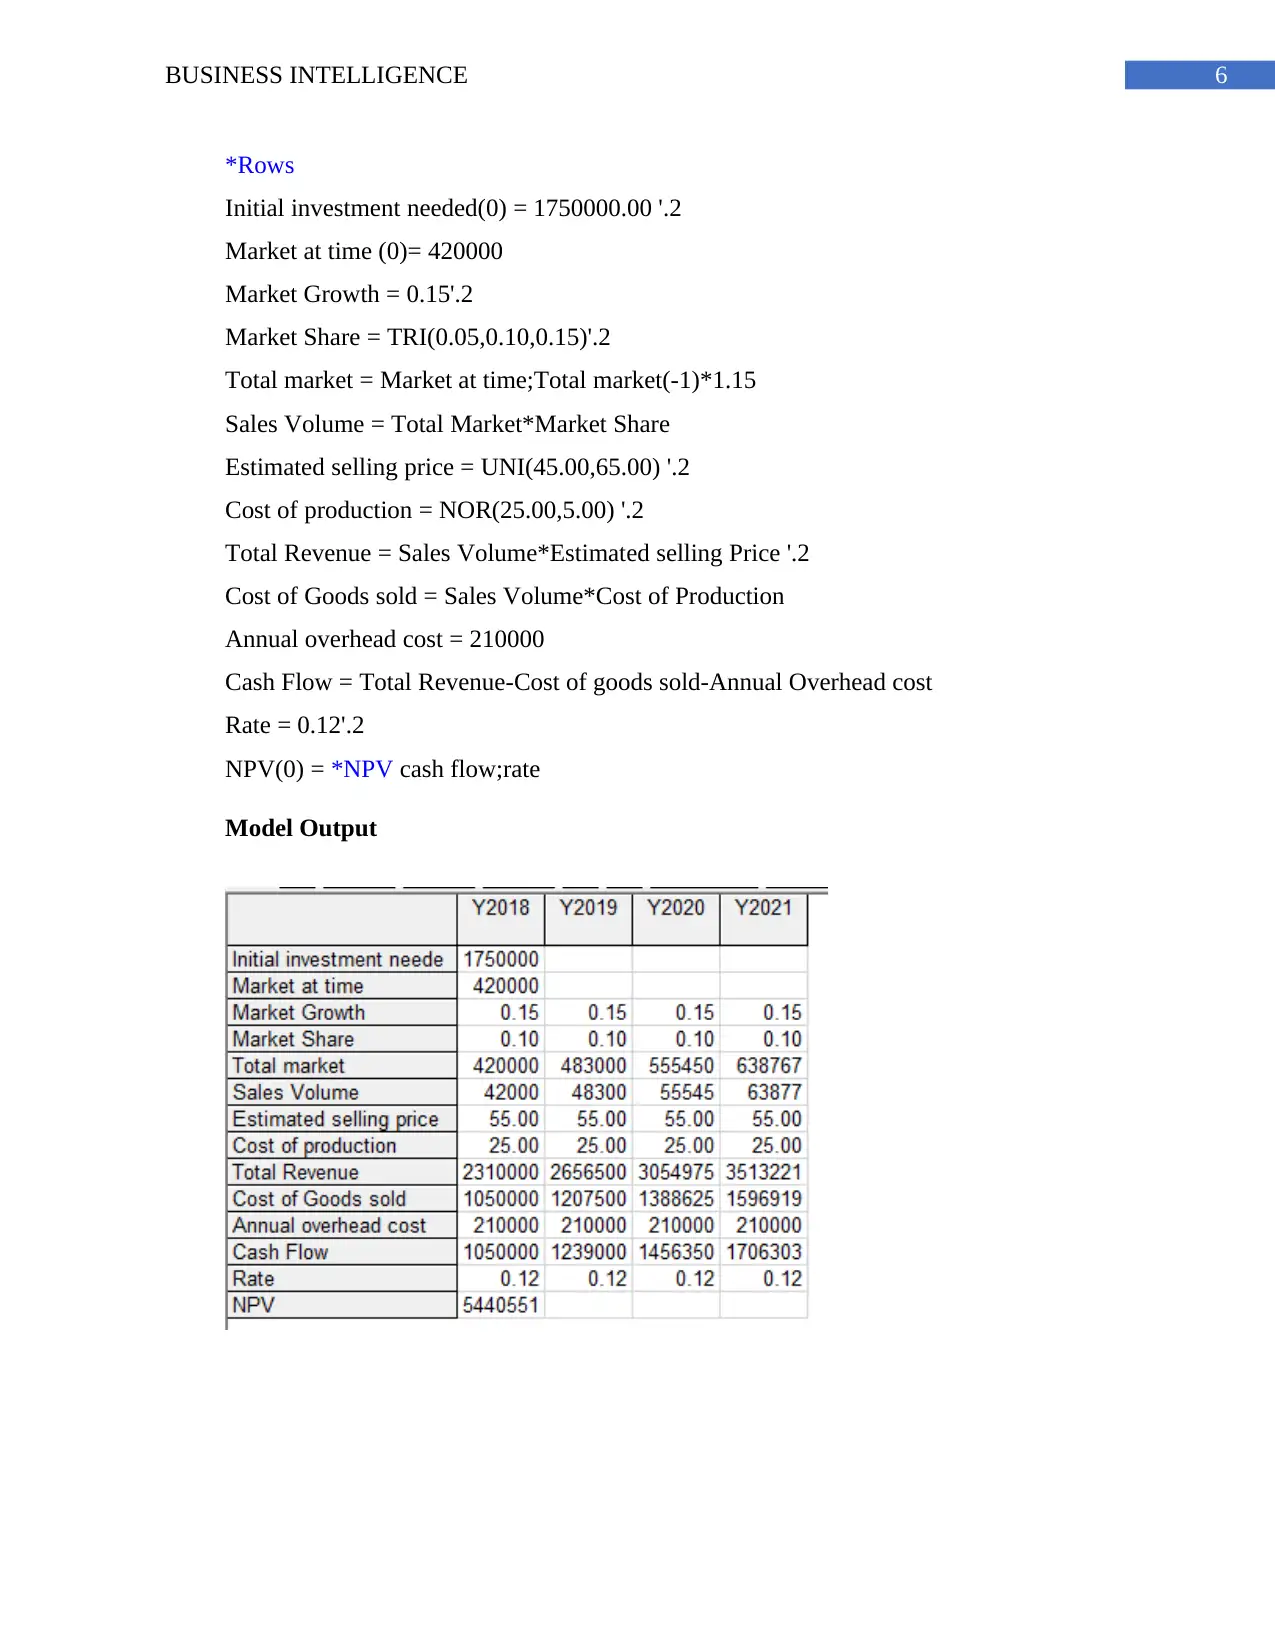
*Rows
Initial investment needed(0) = 1750000.00 '.2
Market at time (0)= 420000
Market Growth = 0.15'.2
Market Share = TRI(0.05,0.10,0.15)'.2
Total market = Market at time;Total market(-1)*1.15
Sales Volume = Total Market*Market Share
Estimated selling price = UNI(45.00,65.00) '.2
Cost of production = NOR(25.00,5.00) '.2
Total Revenue = Sales Volume*Estimated selling Price '.2
Cost of Goods sold = Sales Volume*Cost of Production
Annual overhead cost = 210000
Cash Flow = Total Revenue-Cost of goods sold-Annual Overhead cost
Rate = 0.12'.2
NPV(0) = *NPV cash flow;rate
Model Output
Paraphrase This Document
Need a fresh take? Get an instant paraphrase of this document with our AI Paraphraser
7BUSINESS INTELLIGENCE
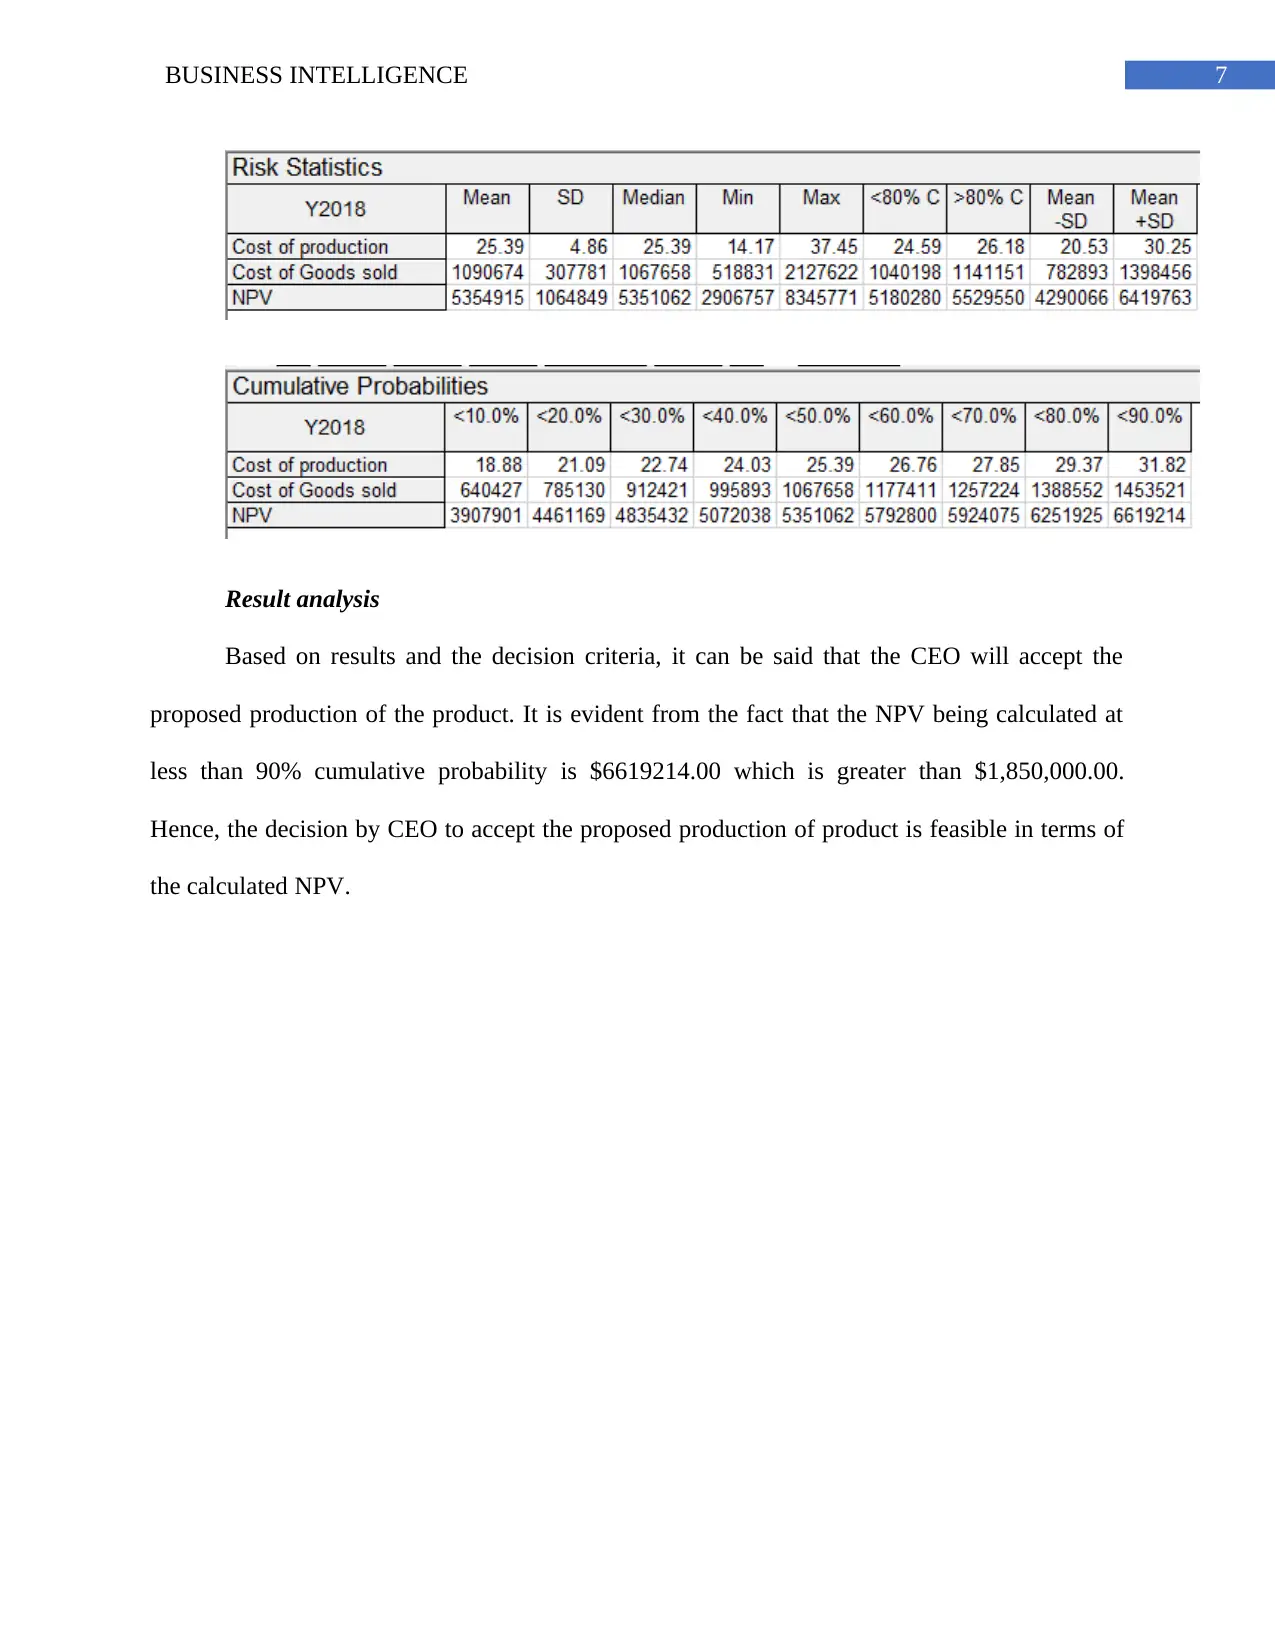
Result analysis
Based on results and the decision criteria, it can be said that the CEO will accept the
proposed production of the product. It is evident from the fact that the NPV being calculated at
less than 90% cumulative probability is $6619214.00 which is greater than $1,850,000.00.
Hence, the decision by CEO to accept the proposed production of product is feasible in terms of
the calculated NPV.

8BUSINESS INTELLIGENCE
Part – B
Demonstration 1
First dashboard
Second dashboard
Part – B
Demonstration 1
First dashboard
Second dashboard
9BUSINESS INTELLIGENCE
Answer to questions
The dashboard has been designed by selecting DB9 in slicer from which it has been
found that the most SalePrice of DB9 is of USA.
Use of Power BI to validate business assumptions
The business assumptions can be validated by using Power BI as it offers data
visualization and graphical representation of data. In context to the demonstration with Car sales
data, it has been determined that Power BI will help to analyse the sales and profit.
Demonstration 2
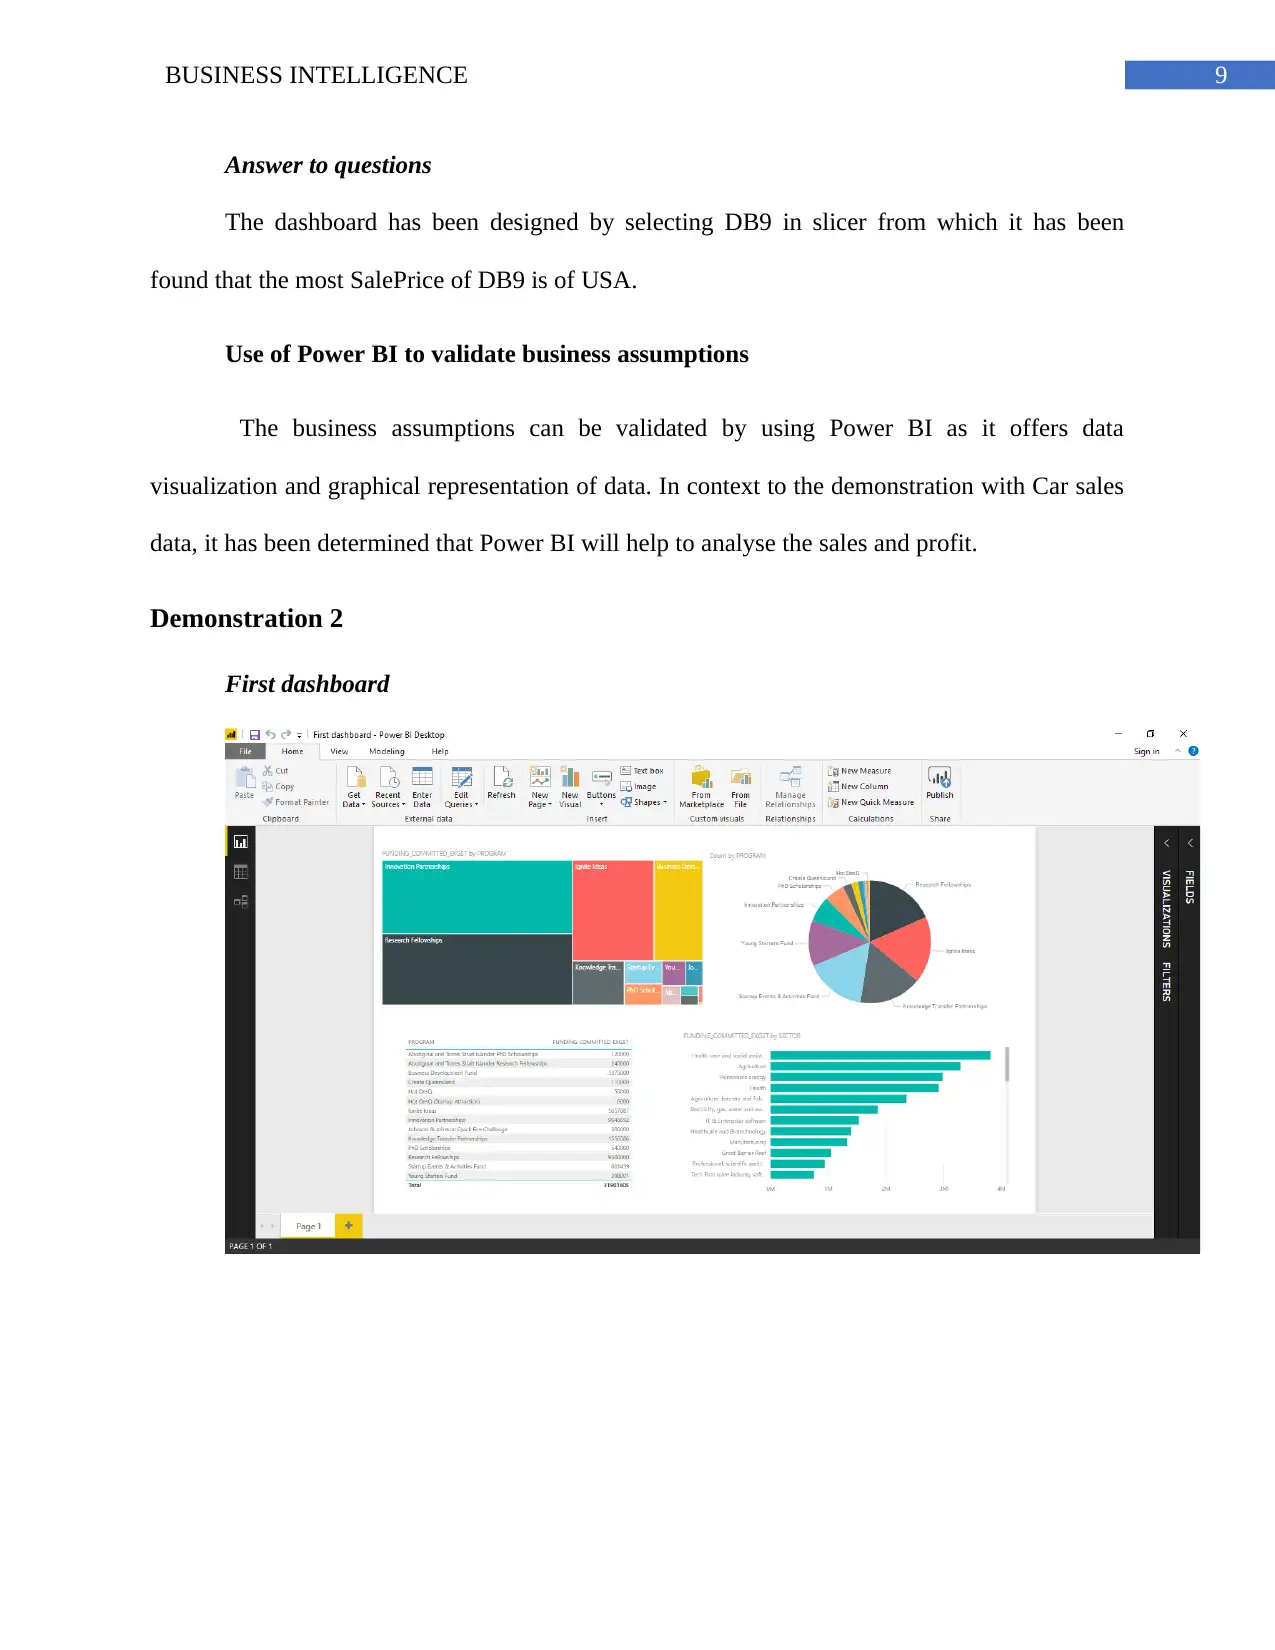
First dashboard
Answer to questions
The dashboard has been designed by selecting DB9 in slicer from which it has been
found that the most SalePrice of DB9 is of USA.
Use of Power BI to validate business assumptions
The business assumptions can be validated by using Power BI as it offers data
visualization and graphical representation of data. In context to the demonstration with Car sales
data, it has been determined that Power BI will help to analyse the sales and profit.
Demonstration 2
First dashboard
Secure Best Marks with AI Grader
Need help grading? Try our AI Grader for instant feedback on your assignments.
10BUSINESS INTELLIGENCE
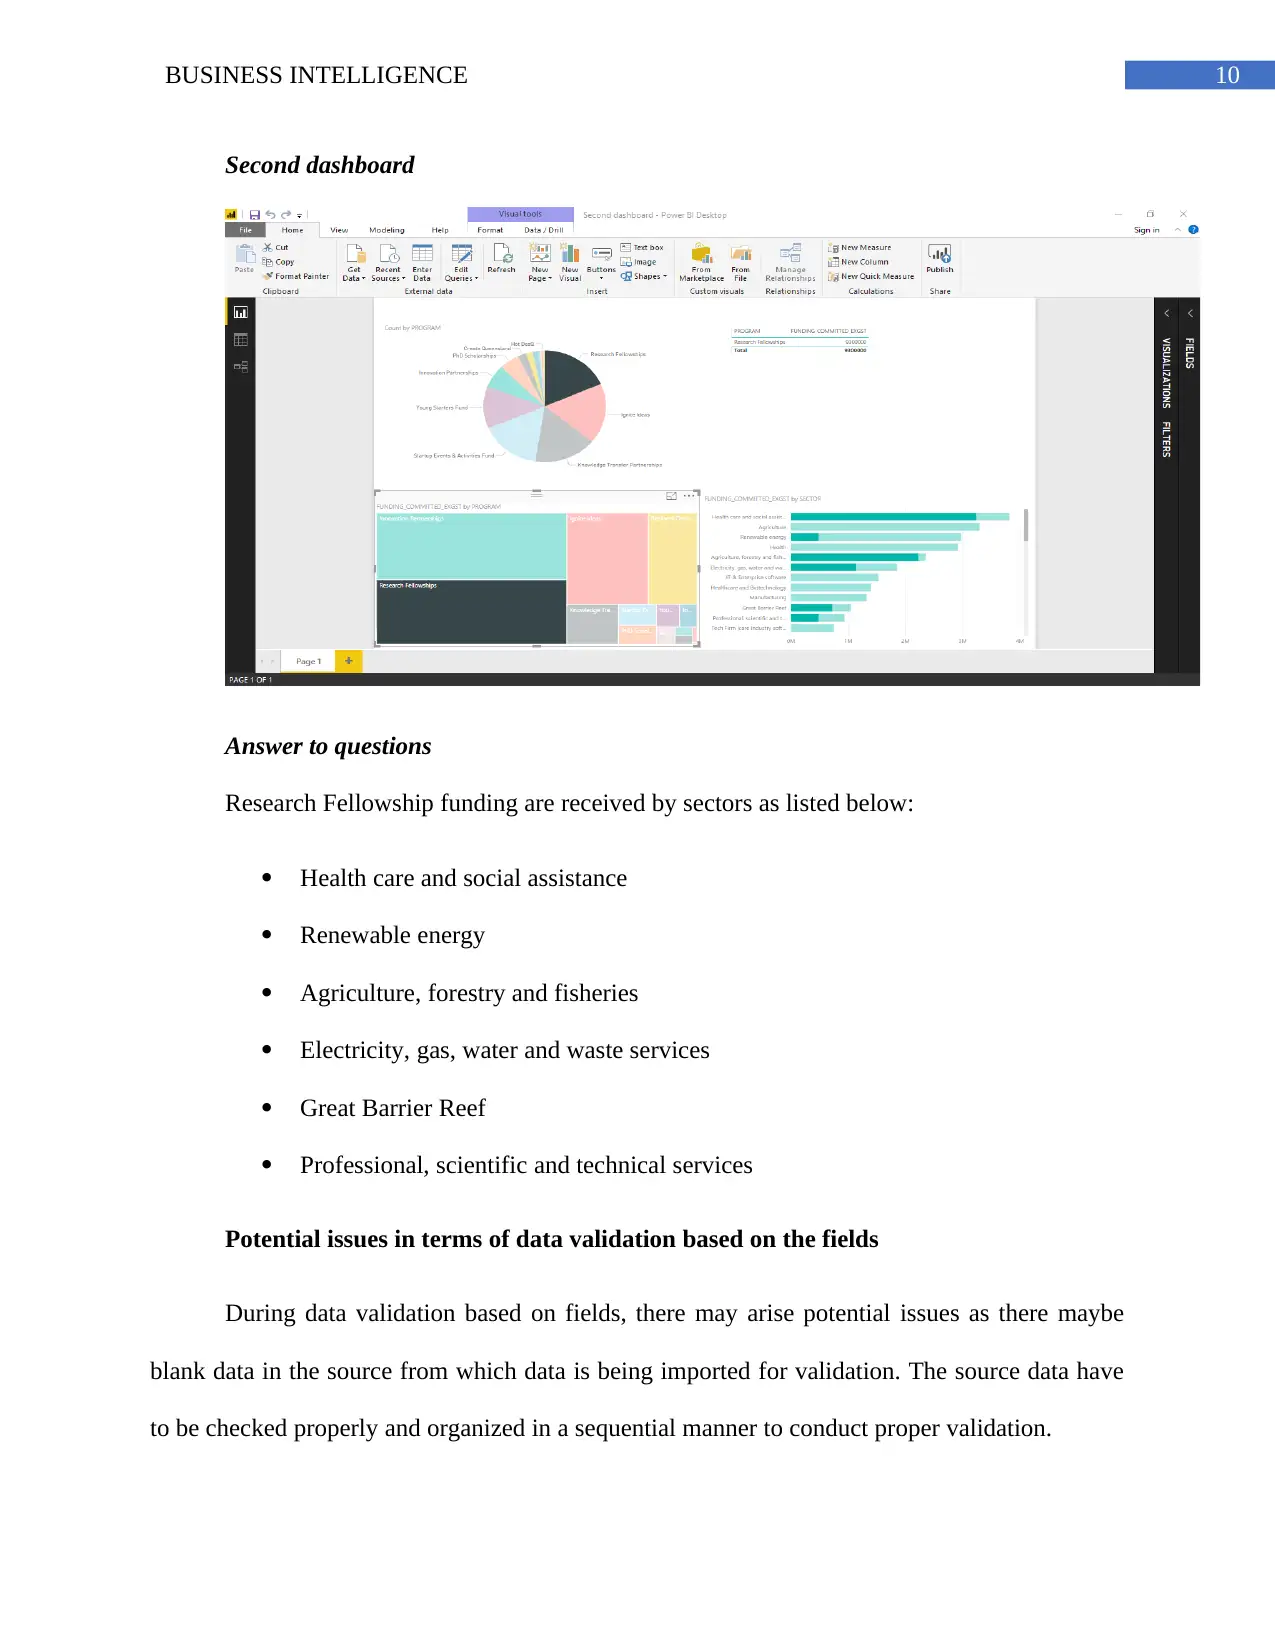
Second dashboard
Answer to questions
Research Fellowship funding are received by sectors as listed below:
Health care and social assistance
Renewable energy
Agriculture, forestry and fisheries
Electricity, gas, water and waste services
Great Barrier Reef
Professional, scientific and technical services
Potential issues in terms of data validation based on the fields
During data validation based on fields, there may arise potential issues as there maybe
blank data in the source from which data is being imported for validation. The source data have
to be checked properly and organized in a sequential manner to conduct proper validation.
11BUSINESS INTELLIGENCE
Part C – Analysis of Case Study
Introduction
This report is focused on smart, connected products for determining the role played by
them in context to business analytics and how they may help to transform companies with the
use of business intelligence. The businesses in this modern world of technological world are
revolutionizing and there is evolution of products into intelligent and connected devices. The
discussions being carried out in this report reflect that there is a relationship between the smart,
connected products and business analytics. The companies are transforming their business
strategy with the help of smart, connected products by utilizing the features offered by business
intelligence.
Smart, connected products contribute to business analytics
The new abilities and tremendous amounts of information that smart, connected products
offer are rethinking the exercises of the center elements of organizations here and there
fundamentally. As programming and cloud-based working frameworks wind up vital to items,
new item advancement standards rise, producing segments and procedures change, and IT
security turns into the activity of each capacity. As the capacity to open the full estimation of
information turns into a key source of upper hand, the administration, administration,
investigation, and security of that information is forming into a noteworthy new business work.
According to Porter and Heppelmann (2014), while singular sensor readings are
profitable, organizations regularly can uncover intense experiences by recognizing designs in a
large number of readings from numerous items after some time. For instance, data from
divergent individual sensors, for example, a car's motor temperature, throttle position, and fuel
12BUSINESS INTELLIGENCE
utilization, can uncover how execution corresponds with the car's building details. Connecting
mixes of readings to the event of issues can be valuable, and notwithstanding when the main
driver of an issue is difficult to conclude, those examples can be followed up on. Information
from sensors that measure warmth and vibration, for instance, can foresee an approaching
bearing disappointment days or weeks ahead of time. Catching such bits of knowledge is the area
of enormous information examination, which mix arithmetic, software engineering, and business
investigation methods.
Big data analytics utilize a group of new systems to comprehend those examples. A test is
that the information from smart, connected products and related inward and outside information
are regularly unstructured. In accordance to Porter and Heppelmann (2014), they might be in a
variety of configurations, for example, sensor readings, areas, temperatures, and deals and
guarantee history. Traditional ways to deal with information collection and investigation, for
example, spreadsheets and database tables, are ill-suited to dealing with a wide assortment of
information positions. The developing arrangement is an "information lake," an archive in which
dissimilar information streams can be put away in their local configurations. From that point, the
information can be examined with an arrangement of new information investigation instruments.
Those apparatuses fall into four classes: unmistakable, demonstrative, prescient, and prescriptive.
Smart, connected products help to transform companies by using business intelligence 300
Smart, connected products change existing items as well as frequently widen industry
limits. Items that have been discrete and unmistakable can progress toward becoming parts of
enhanced frameworks of related items, or segments of frameworks of frameworks. Moving limits
imply that organizations that have been industry pioneers for quite a long time may wind up
playing all the more a supporting part in a more extensive scene (Porter and Heppelmann 2014).
Paraphrase This Document
Need a fresh take? Get an instant paraphrase of this document with our AI Paraphraser
13BUSINESS INTELLIGENCE
The development of item frameworks and frameworks of frameworks raises no less than two
kinds of vital decisions about organization scope. The first is whether an organization ought to
venture into related items or different parts of the arrangement of frameworks. The second is
whether an organization should try to give the stage that interfaces the related items and data,
regardless of whether it does not make or control every one of the parts. Customary approaches
to manage data gathering and examination, for instance, spreadsheets and database tables, are ill-
suited for managing a wide collection of data positions.
Organizations might be enticed to go into related items to catch the enormous
opportunity, yet passage into related items dependably includes hazard and the requirement for
new abilities. Organizations must distinguish a reasonable offer before entering. Growing item
extension will be most alluring where there are real execution change openings through co-
outlining the related items to enhance the framework. Then again, if enhancement is not subject
to singular item plans, an organization might be in an ideal situation adhering to its sewing and
giving open network to related items delivered by others. As opined by Porter and Heppelmann
(2014), achievement is less a component of customary item outline than frameworks building.
Smart, connected products will offer ascent to its following period driven profitability
development when the effect of prior rushes of IT has generally run its course. Organizations
whose items and related mechanical abilities are fundamental to general item framework activity
and execution, for example, Joy Global's mining machines, will be in the best position to enter
related items and coordinate the framework. Makers that create less framework basic machines,
for example, the trucks that move the material extricated from underground, will have less ability
and believability in clients' eyes to go up against a more extensive framework supplier part.

14BUSINESS INTELLIGENCE
Conclusion
From the analysis, it can be said that smart, connected products plays an important role in
context to business analytics and they help to transform companies with the help of business
intelligence. Smart, connected products offers new abilities and tremendous amounts of
information which helps in rethinking the exercises associated with centre elements of
organizations fundamentally. Big data analytics utilize a group of new systems to comprehend
those examples. Due to emergence of smart connected products, organizations might be enticed
to go into related items to catch the enormous opportunity, yet passage into related items
dependably includes hazard and the requirement for new abilities.
15BUSINESS INTELLIGENCE
Bibliography
Behmann, F. and Wu, K., 2015. Collaborative internet of things (C-IoT): For future smart
connected life and business. John Wiley & Sons.
Fan, S., Lau, R.Y. and Zhao, J.L., 2015. Demystifying big data analytics for business intelligence
through the lens of marketing mix. Big Data Research, 2(1), pp.28-32.
Joachimsthaler, E., Chaudhuri, A., Kalthoff, M., Burgess-Webb, A. and Bharadwaj, A., 2015.
How smart, connected products are transforming competition. Harvard business review, 93(1),
p.4.
Laha, A., 2015. Business Analytics & Intelligence.
Phillips-Wren, G.E., Iyer, L.S., Kulkarni, U.R. and Ariyachandra, T., 2015. Business Analytics
in the Context of Big Data: A Roadmap for Research. CAIS, 37, p.23.
Porter, M.E. and Heppelmann, J.E., 2014. How smart, connected products are transforming
competition. Harvard Business Review, 92(11), pp.64-88.
Slama, D., Puhlmann, F., Morrish, J. and Bhatnagar, R.M., 2015. Enterprise IoT: Strategies and
Best Practices for Connected Products and Services. " O'Reilly Media, Inc.".
Wortmann, F. and Flüchter, K., 2015. Internet of things. Business & Information Systems
Engineering, 57(3), pp.221-224.
1 out of 16
Related Documents


Your All-in-One AI-Powered Toolkit for Academic Success.
+13062052269
info@desklib.com
Available 24*7 on WhatsApp / Email
![[object Object]](/_next/static/media/star-bottom.7253800d.svg)
Unlock your academic potential
© 2024 | Zucol Services PVT LTD | All rights reserved.