logo

Business Statistics and Analysis

This assignment is about time series modelling and forecasting using the number of new passenger vehicles sold in Australia from 1997 to 2011.

9 Pages840 Words344 Views
   

Added on  2022-12-02

About This Document

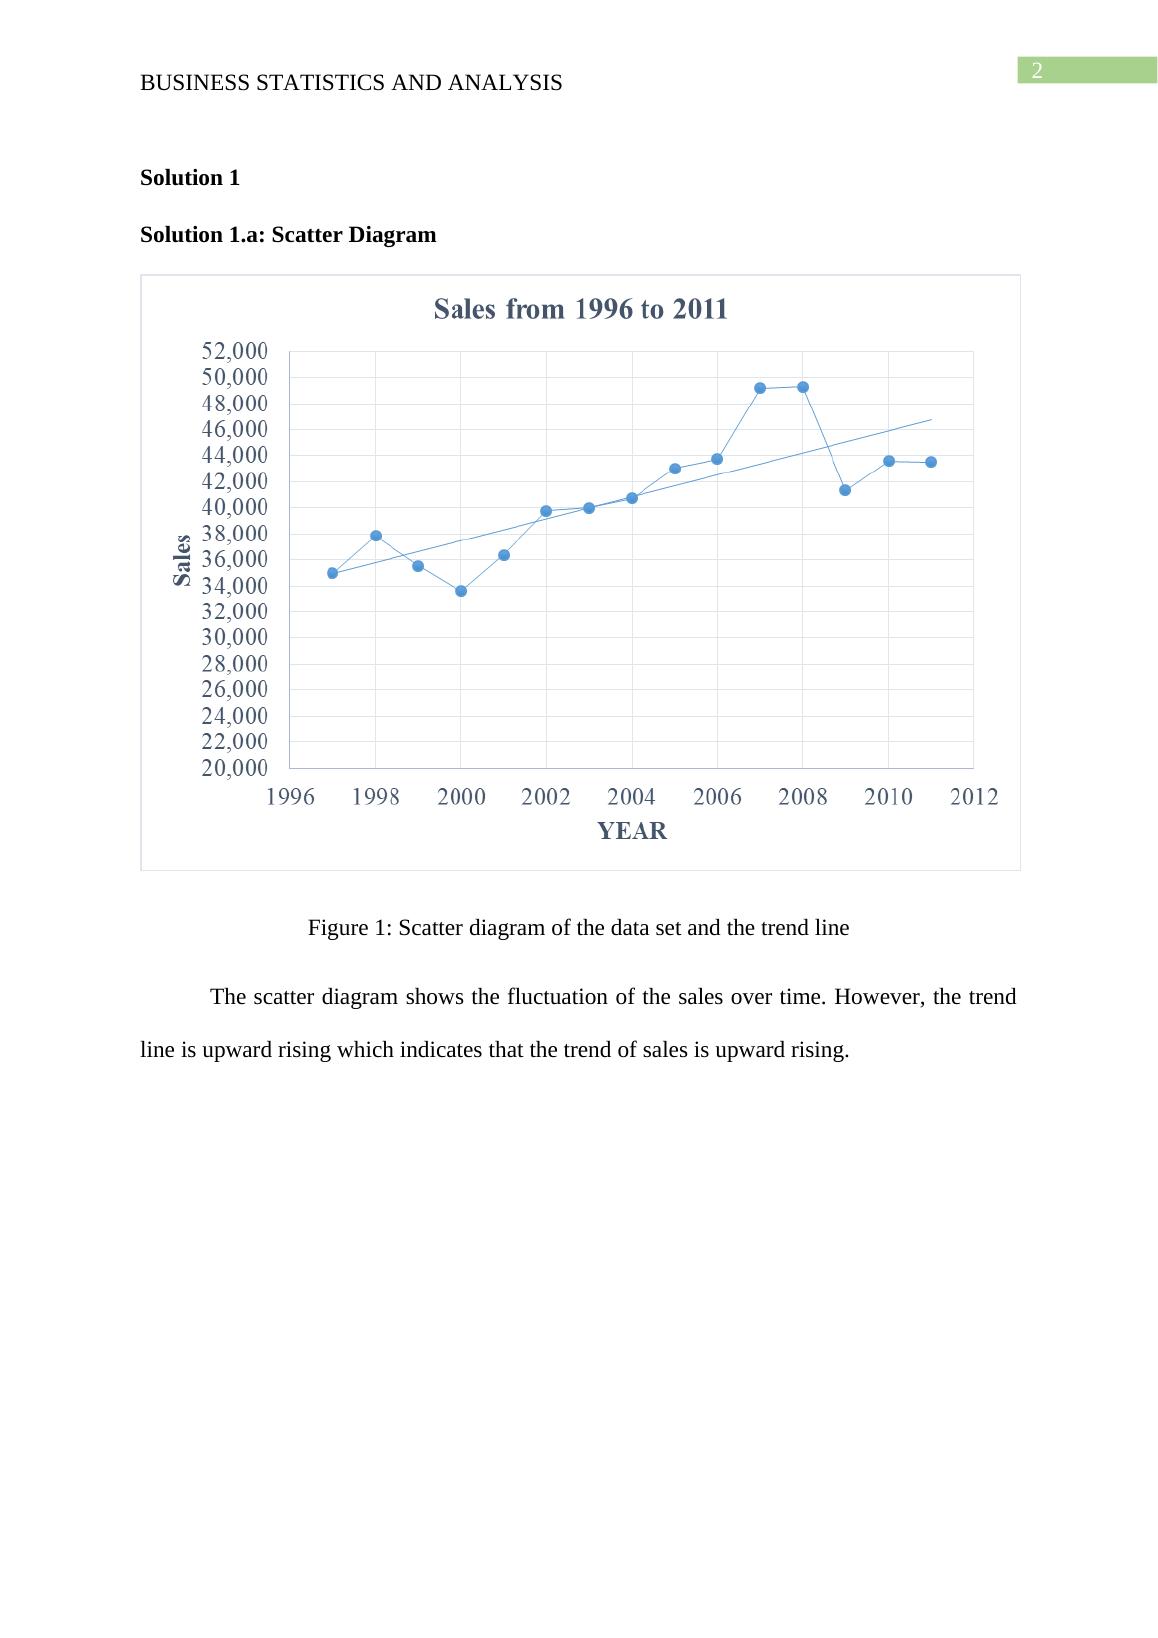
This document provides solutions and analysis for business statistics, including scatter diagrams, regression lines, coefficient of determination, sales prediction, exponential smoothing, and more.

Business Statistics and Analysis

This assignment is about time series modelling and forecasting using the number of new passenger vehicles sold in Australia from 1997 to 2011.

   Added on 2022-12-02

ShareRelated Documents
Running head: BUSINESS STATISTICS AND ANALYSIS
Business Statistics and Analysis
Name of the Student:
Name of the University:
Author Note:
Business Statistics and Analysis_1
1
BUSINESS STATISTICS AND ANALYSIS
Table of Contents
Section B....................................................................................................................................2
Reference and bibliography.......................................................................................................3
Business Statistics and Analysis_2
2
BUSINESS STATISTICS AND ANALYSIS
Solution 1
Solution 1.a: Scatter Diagram
Figure 1: Scatter diagram of the data set and the trend line
The scatter diagram shows the fluctuation of the sales over time. However, the trend
line is upward rising which indicates that the trend of sales is upward rising.
Business Statistics and Analysis_3

End of preview

Want to access all the pages? Upload your documents or become a member.

Related Documents
Assignment on Regression Model
|9
|1239
|206