logo

Current Ratio Analysis: Current Balance Sheet or Projected Balance Sheet

9 Pages1613 Words35 Views
   

Added on  2021-01-02

About This Document

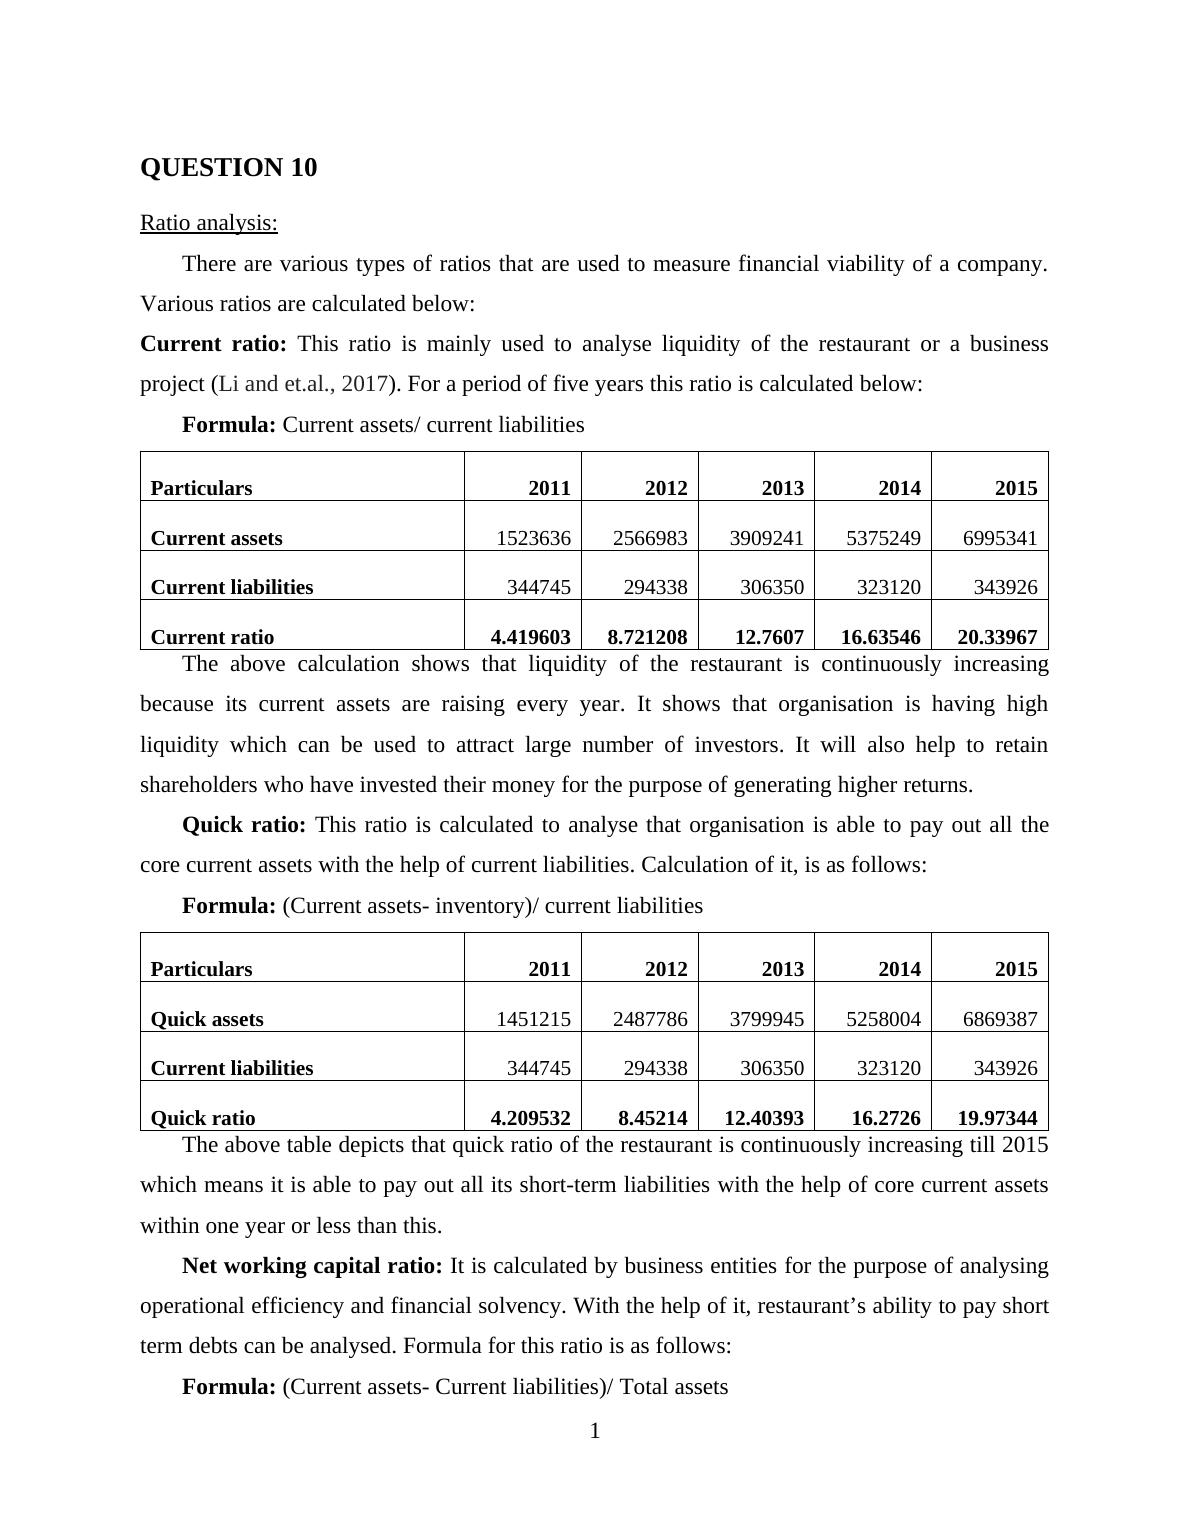
For a period of five years this ratio is calculated below: Formula: Current assets/ current liabilities |Particulars |2011 |2012 |2013 |2014 |2015 | |Current assets |1523636 |2566983 |3909241 |5375249 |6995341 | |Current liabilities|344745 |294338 |2012 |2014 |2015 | |Current ratio|4.419603|8.721208|12.7607 |16.63546|20.33967|

Current Ratio Analysis: Current Balance Sheet or Projected Balance Sheet

   Added on 2021-01-02

ShareRelated Documents
Business
Current Ratio Analysis: Current Balance Sheet or Projected Balance Sheet_1
Table of ContentsQUESTION 10.................................................................................................................................1Ratio analysis:........................................................................................................................1REFERENCES................................................................................................................................5APPENDIX......................................................................................................................................6Projected income statement....................................................................................................6Projected balance sheet...........................................................................................................6
Current Ratio Analysis: Current Balance Sheet or Projected Balance Sheet_2
QUESTION 10Ratio analysis:There are various types of ratios that are used to measure financial viability of a company.Various ratios are calculated below:Current ratio: This ratio is mainly used to analyse liquidity of the restaurant or a businessproject (Li and et.al., 2017). For a period of five years this ratio is calculated below:Formula: Current assets/ current liabilitiesParticulars20112012201320142015Current assets15236362566983390924153752496995341Current liabilities344745294338306350323120343926Current ratio4.4196038.72120812.760716.6354620.33967The above calculation shows that liquidity of the restaurant is continuously increasingbecause its current assets are raising every year. It shows that organisation is having highliquidity which can be used to attract large number of investors. It will also help to retainshareholders who have invested their money for the purpose of generating higher returns.Quick ratio: This ratio is calculated to analyse that organisation is able to pay out all thecore current assets with the help of current liabilities. Calculation of it, is as follows:Formula: (Current assets- inventory)/ current liabilitiesParticulars20112012201320142015Quick assets14512152487786379994552580046869387Current liabilities344745294338306350323120343926Quick ratio4.2095328.4521412.4039316.272619.97344The above table depicts that quick ratio of the restaurant is continuously increasing till 2015which means it is able to pay out all its short-term liabilities with the help of core current assetswithin one year or less than this.Net working capital ratio: It is calculated by business entities for the purpose of analysingoperational efficiency and financial solvency. With the help of it, restaurant’s ability to pay shortterm debts can be analysed. Formula for this ratio is as follows:Formula: (Current assets- Current liabilities)/ Total assets1
Current Ratio Analysis: Current Balance Sheet or Projected Balance Sheet_3

End of preview

Want to access all the pages? Upload your documents or become a member.

Related Documents
Preparing The Balance Sheet Statement Report
|6
|670
|17

Balance Sheet Criticism and Liquidity Analysis of McDonald Company
|5
|629
|231

Business Finance: Analysis of Financial Viability and Ratios for Crusher PLC
|15
|1257
|177

PERFORMANCE MEASUREMENT FOR ACFI2208 dfghjklzxcvbnmqwertyuiopasdfghjklzxcvbnmqwertyuiopasdfghjklzxcvbnmqwertyuiopasdfghjklzxcvbnmqwertyuiopasdfghjklzxcvbnmq
|13
|2648
|396

Financial Performance Analysis of Marks and Spencer
|10
|2378
|596

Analysis of Apple's Financial Statement and Risk Factors
|18
|3444
|36