logo

CAPM Analysis of the Capital Asset Pricing

Testing the CAPM theory using market index and 12 companies' daily data from at least three different sectors.

14 Pages3300 Words18 Views
   

Added on  2022-08-12

About This Document

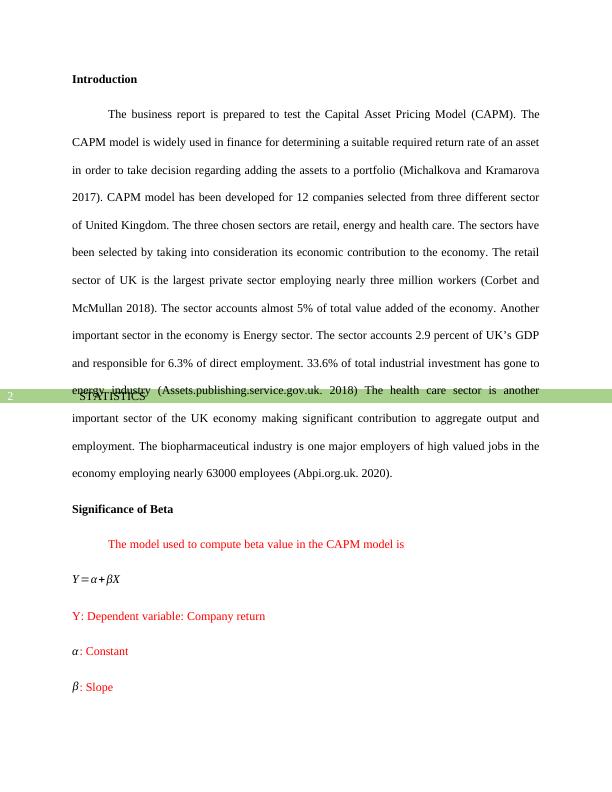
STATISTICS STATISTICS 1 1 STATISTICS Statistics Name of the Student Name of the University Course ID Introduction 2 Significance of Beta 2 t statistics and R square 4 Discussion and merits and demerits of CAPM analysis 5 Merits and Demerits of CAPM 9 Sensitivity to sector characteristics 9 Conclusion 10 References 12 Introduction The business report is prepared to test the Capital Asset Pricing Model (CAPM). The beta value is significantly smaller than the p value associated with the beta

CAPM Analysis of the Capital Asset Pricing

Testing the CAPM theory using market index and 12 companies' daily data from at least three different sectors.

   Added on 2022-08-12

ShareRelated Documents
Running head: STATISTICS
Statistics
Name of the Student
Name of the University
Course ID
CAPM Analysis of the Capital Asset Pricing_1
STATISTICS1
Table of Contents
Introduction......................................................................................................................................2
Significance of Beta.........................................................................................................................2
t statistics and R square....................................................................................................................4
Discussion and merits and demerits of CAPM analysis..................................................................5
Merits and Demerits of CAPM....................................................................................................9
Sensitivity to sector characteristics..................................................................................................9
Conclusion.....................................................................................................................................10
References......................................................................................................................................12
CAPM Analysis of the Capital Asset Pricing_2
STATISTICS2
Introduction
The business report is prepared to test the Capital Asset Pricing Model (CAPM). The
CAPM model is widely used in finance for determining a suitable required return rate of an asset
in order to take decision regarding adding the assets to a portfolio (Michalkova and Kramarova
2017). CAPM model has been developed for 12 companies selected from three different sector
of United Kingdom. The three chosen sectors are retail, energy and health care. The sectors have
been selected by taking into consideration its economic contribution to the economy. The retail
sector of UK is the largest private sector employing nearly three million workers (Corbet and
McMullan 2018). The sector accounts almost 5% of total value added of the economy. Another
important sector in the economy is Energy sector. The sector accounts 2.9 percent of UK’s GDP
and responsible for 6.3% of direct employment. 33.6% of total industrial investment has gone to
energy industry (Assets.publishing.service.gov.uk. 2018) The health care sector is another
important sector of the UK economy making significant contribution to aggregate output and
employment. The biopharmaceutical industry is one major employers of high valued jobs in the
economy employing nearly 63000 employees (Abpi.org.uk. 2020).
Significance of Beta
The model used to compute beta value in the CAPM model is
Y =α + βX
Y: Dependent variable: Company return
α : Constant
β: Slope
CAPM Analysis of the Capital Asset Pricing_3
STATISTICS3
X: Independent variable: Market excess return = FTSE 100 return – Risk free rate
The beta value for ‘Tesco’ is 0.581. Significant p value for the beta is 0.000. This p value
is less than significance value at 5% significance level implying rejection of null hypothesis of
no significance of beta coefficient. That mean beta coefficient for ‘Tesco’ is statistically
significant. For ‘Morrison’ the beta value is 0.652 with a significant p value of 0.000. As the p
value is lower than significant value at 5% level this suggests beta for ‘Morrison’ is significant.
The beta value for ‘Sainsbury’ is 0.758. P value for the beta coefficient is 0.000. Since the
significant p value is smaller than 5% significance level suggesting the null hypothesis asserting
the beta value is zero can be rejected. The beta for ‘Sainsbury’ therefore is significant. In case of
‘Next PLC’ the beta value is 0.650. Associated p value for the beta is 0.000. As the p vale is less
than the significance level, this indicates a significant beta for the company (Darlington and
Hayes 2016).
In the energy sector, beta value for ‘British Petroleum’ is 1.211. Significant p value for
the beta is 0.000 which is smaller than the significance level corresponding to 5% level. The beta
for BP therefore is statistically significant. The beta value recorded for ‘Royal Dutch Shell’ is
1.233 along with a p value of 0.000. The smaller p value compared to significant level suggest
that the beta coefficient is significant. For ‘JKX oil and gas’ beta value is 0.639. Associated p
value is 0.006. P value less than 5% significance suggests a significant beta. In case of
‘PennPetro Energy PLC’ the beta value is 0.098 with the associated p value of 0.379. The p
value in this case exceeds the significant value at 5% level meaning acceptance of null
hypothesis indicating no significance of the beta coefficient. The beta value for the company
therefore is not significant.
CAPM Analysis of the Capital Asset Pricing_4

End of preview

Want to access all the pages? Upload your documents or become a member.

Related Documents
Testing the CAPM Theory Using Time Series Regression Analysis
|18
|3072
|254

Multiple Regression with Food Truck Case | Assignment
|9
|1106
|21

Statistics for Business and Finance - Hypothesis Testing, CAPM Model and Regression Analysis
|10
|1170
|212

Analytical Methods
|9
|560
|21

Frequency Distribution, Hypothesis Testing, Regression Analysis
|2
|757
|346

Statistics of Business & Finance
|10
|1152
|422