logo

Finding the Best Car Value: Regression Analysis and Conclusions

8 Pages1047 Words137 Views
   

Added on  2023-06-11

About This Document

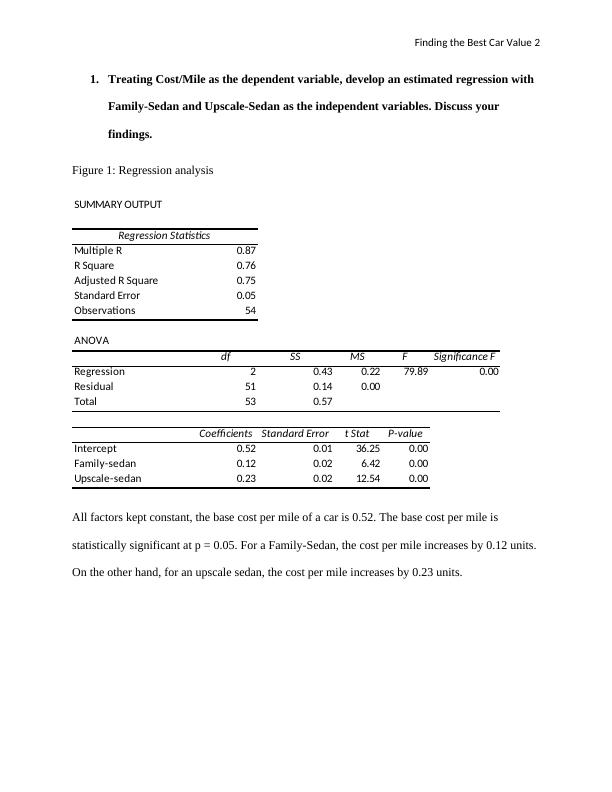
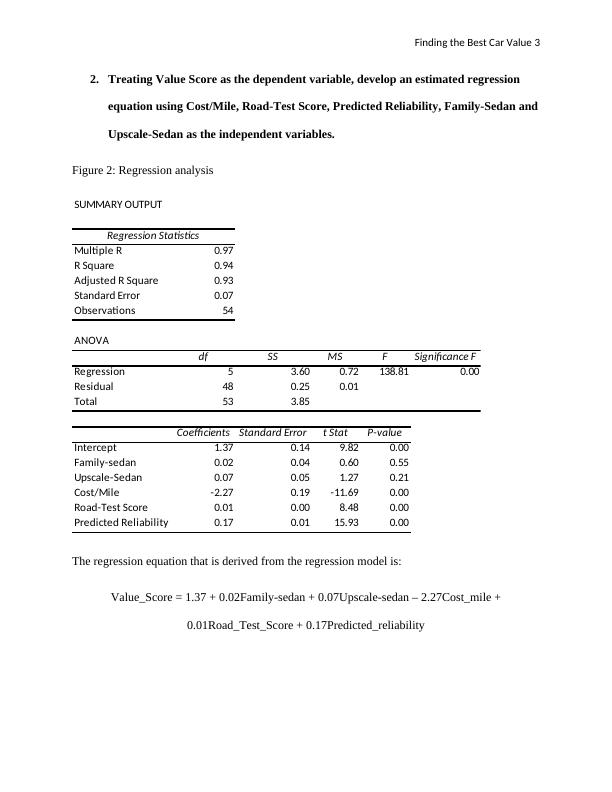
This article discusses the regression analysis conducted to find the best car value based on various independent variables. The article includes four regression analyses and their results, including the best predictor of the value score of a car. The article concludes that the size of the car is not a good predictor of the value score of the car, and the value score of a car is best predicted using the road test score and cost per mile as the variables were statistically significant.

Finding the Best Car Value: Regression Analysis and Conclusions

   Added on 2023-06-11

ShareRelated Documents
Running Header: Finding the Best Car Value 1
Finding the Best Car Value
Student’s name: Obaid Alshaali
Student’s ID:
Institution:
Finding the Best Car Value: Regression Analysis and Conclusions_1
Finding the Best Car Value 2
1. Treating Cost/Mile as the dependent variable, develop an estimated regression with
Family-Sedan and Upscale-Sedan as the independent variables. Discuss your
findings.
Figure 1: Regression analysis
SUMMARY OUTPUT
Regression Statistics
Multiple R 0.87
R Square 0.76
Adjusted R Square 0.75
Standard Error 0.05
Observations 54
ANOVA
df SS MS F Significance F
Regression 2 0.43 0.22 79.89 0.00
Residual 51 0.14 0.00
Total 53 0.57
Coefficients Standard Error t Stat P-value
Intercept 0.52 0.01 36.25 0.00
Family-sedan 0.12 0.02 6.42 0.00
Upscale-sedan 0.23 0.02 12.54 0.00
All factors kept constant, the base cost per mile of a car is 0.52. The base cost per mile is
statistically significant at p = 0.05. For a Family-Sedan, the cost per mile increases by 0.12 units.
On the other hand, for an upscale sedan, the cost per mile increases by 0.23 units.
Finding the Best Car Value: Regression Analysis and Conclusions_2
Finding the Best Car Value 3
2. Treating Value Score as the dependent variable, develop an estimated regression
equation using Cost/Mile, Road-Test Score, Predicted Reliability, Family-Sedan and
Upscale-Sedan as the independent variables.
Figure 2: Regression analysis
SUMMARY OUTPUT
Regression Statistics
Multiple R 0.97
R Square 0.94
Adjusted R Square 0.93
Standard Error 0.07
Observations 54
ANOVA
df SS MS F Significance F
Regression 5 3.60 0.72 138.81 0.00
Residual 48 0.25 0.01
Total 53 3.85
Coefficients Standard Error t Stat P-value
Intercept 1.37 0.14 9.82 0.00
Family-sedan 0.02 0.04 0.60 0.55
Upscale-Sedan 0.07 0.05 1.27 0.21
Cost/Mile -2.27 0.19 -11.69 0.00
Road-Test Score 0.01 0.00 8.48 0.00
Predicted Reliability 0.17 0.01 15.93 0.00
The regression equation that is derived from the regression model is:
Value_Score = 1.37 + 0.02Family-sedan + 0.07Upscale-sedan – 2.27Cost_mile +
0.01Road_Test_Score + 0.17Predicted_reliability
Finding the Best Car Value: Regression Analysis and Conclusions_3

End of preview

Want to access all the pages? Upload your documents or become a member.

Related Documents
Managerial Economics Assignment (Doc)
|13
|1199
|82

Regression Analysis of Relationship between Annual Income and Credit Card Charges
|7
|1017
|404

13 Managerial Economics Name of the Student Name of the University
|14
|1267
|110

Mortgage payment Gender Income
|8
|728
|10

Case Study: Multiple Linear Regression for Insurance Rates
|7
|769
|83

Regression Models using Cross Section Data Assignment 2022
|5
|1017
|16