Case Project Report
VerifiedAdded on 2023/02/01
|32
|9324
|90
AI Summary
The case project report evaluates the market conditions of Australia and develops a business venture for smart watches. It includes an economic analysis, literature review, financial model, and more.
Contribute Materials
Your contribution can guide someone’s learning journey. Share your
documents today.

Running head: CASE PROJECT REPORT
Case project report
Name of the student
Name of the university
Student ID
Author note
Case project report
Name of the student
Name of the university
Student ID
Author note
Secure Best Marks with AI Grader
Need help grading? Try our AI Grader for instant feedback on your assignments.
CASE PROJECT REPORT
Table of Contents
1. Overview................................................................................................................................2
1.1 Project Title......................................................................................................................3
1.2 Project Background..........................................................................................................3
2. Objectives and Scope.............................................................................................................3
2.1 Objective(s) of the assignment, assumptions and constraints..........................................3
2.2 Expected outcome(s)/benefits..........................................................................................4
3. Literature Review...................................................................................................................4
3.1 Literature Review on Project Economical Analysis........................................................4
3.2 Analyzing the economic scenario of Australia:...................................................................5
3.3 New ventures funding system in Australia:.........................................................................7
3.4 Identifying the market trend of smart watches in Australia:................................................7
3.5 Factors influencing the products price:................................................................................9
3.6 Special Topic Assigned to each Team by the Lecturer..................................................10
3.8 The Developed Methodology for the Case project........................................................11
4. Financial Model of the Case Project....................................................................................12
4.1 Assumptions including interest rates, inflation, project life, etc....................................12
4.2 Constraints......................................................................................................................12
4.3Risks................................................................................................................................13
4.4 Cash inflows and outflows.............................................................................................14
5. Financial and Sensitivity Analyses of the Case Project.......................................................16
5.1 Financial Analysis of the Case Project...........................................................................16

CASE PROJECT REPORT
5.2 Sensitivity Analysis of the Case Project........................................................................19
5.3 Other non-financial decision making factors involved in the Case Project...................19
5.4 Selection of Best Alternative.........................................................................................20
6. Conclusion............................................................................................................................24
References and Bibliography list:............................................................................................25
Appendix:.................................................................................................................................30
CASE PROJECT REPORT
1. Overview
The case project report is prepared for demonstrating the assessment of the evaluation of
the market conditions of Australia. Such analysis would provide assistance to the members
of team by enabling them to select any particular business on which they are required to
make case project. Hence, this requires assessing the market adequately so that the ongoing
trend can ascertain and accordingly the development of business can be done. For
performing the economic analysis of the project, the paper also addresses the review of
literature along with the development of methodology for evaluating the project to be
developed. In addition to this, the sensitivity and financial analysis of the case project is
performed along with the capital budgeting and break even analysis.
1.1 Project Title
The title of the project is to develop planning of business venture of smart watches in
Australia.
1.2 Project Background
The development of the case project has been done by analyzing the market of
Australia. The business plan would be developed for launching Smart watch business after
conducting and spending time on researching the market and analyzing the literature review.
2. Objectives and Scope
With the advancement in technology, there has been change in the preference and
liking if the consumers, therefore, the case project intends to develop the business for
launching smart watch in the country. The demand for smart watches in Australia has
surpassed the demand for cell phones and setting up the business would enable them to reap
Secure Best Marks with AI Grader
Need help grading? Try our AI Grader for instant feedback on your assignments.
CASE PROJECT REPORT
the benefits. In addition to this, the case project has the objective of setting up a profitable
business of selling the smart watches and enabling the consumers to become adaptive to the
modern technology.
2.1 Objective(s) of the assignment, assumptions and constraints
This assignment intends to provide every members of the group with adequate
knowledge about the technological advancement and how the customer preferences are
getting changes in light of such development. Moreover, members will become aware of the
latest ongoing trend and how the businesses are impacted by such development in
technology. While development the case project, it has been assumed that the market for
smart watches are developing significantly which would contribute to the growth of business
and thereby influence their profitability.
2.2 Expected outcome(s)/benefits
The business driver for launching the business of smart watch is the growth of smart
watch lured by the technological development and changing preferences of customers. The
setting of smart watch business is expected to reach the break even units after few years of
operations and generating the profits in the later years.
3. Literature Review
This section of the case project provides a description about the literature review on
the project’s economic analysis and the methodology that has been developed for evaluating
the case project. In addition to this, review of literature regarding the sensitivity analysis used
by the business has also been demonstrated. There are different sensitivity measures that are
used for performing the sensitivity analysis of the proposed business (Frynas and Mellahi
2015). It is required to explore the method by performing the robust identification of such
measures.
CASE PROJECT REPORT
3.1 Literature Review on Project Economical Analysis
Australia is the country that has recorded remarkable economic growth for more than
twenty five years unmarred by recession. A robust development in the entrepreneurship has
been supported by the well functioning legal system and independent bureaucracy along with
multiple benefits generated by the effective system of government. In addition to this, the
operations of private sector have been eased due to reduced interference on part of
government and this has made Australia an attractive and vibrant destination for investment.
In areas of providing service and technology development, the country is competing at the
international level. Organizations and companies are required to pay a flat corporate tax at the
rate of 30% and with the overall burden of tax becoming equivalent to the 27.5% of domestic
income generated. New business financing has not been an issue in Australia with most of the
foreign investors willing to make investment in the startup projects (Bruce et al. 2015).
The higher rate of start up business in the country is considered as one of the positive
indicators for startups as they are contributory factor to the growth. Nonetheless, there is
decline in the proportion of the total start up business. Furthermore, there has been fall in the
startup share in gross creation of job and rate of growth of employment. Growth in overall
productivity and innovation in the market is being driven by the development of new business
(Robinson 2016). The establishment of TechSmart business in Australia would be supported
by various developmental factors that would drive their business growth. Therefore, it is
expected that the economy of Australia would receive positive contribution from the starting
up of new technology business of smart watch. With the year passing, it is likely that the
development of business would result in generating improved and innovative products.
From the analysis of the market scenario in Australia, it has been found that
innovativeness is concentrated around cities such as Melbourne and Sydney. Therefore, the
business of TechSmart would be set up in Melbourne, Australia. It can be said that the new

CASE PROJECT REPORT
trends of market can be swiftly spotted by the newly development of venture such as
TechSmart. This is so because the changes in the preferences and the trend of the consumers
can be promptly responds by such newly developed business which uses the innovation
concept as their driver of business growth (Giang et al. 2015).
3.2 Analyzing the economic scenario of Australia:
The economy of Australia seems to have recovered in the first quarter of fiscal year
2017 after they experienced shock. Due to increased consumer confidence at the outset of this
year, it seems to create positive knock on the customer spending and business investment.
Despite of various weaknesses in the non mining business, the Australian economy is
considered to be on the moderately solid footing.
For the last few years, the rate of inflation in the country has fallen below the
expectation which has resulted in the increased cutting of rate by reserve bank of Australia
and sparked continuous fears of the weakness in economy. The consumer price index over
the years have risen to 0.5% with the inflation rate standing at 1.3% in the first quarter of
fiscal year 2019 compared to 1.8% from previous year. Since the third quarter of 2016, this
rate of inflation recorded was the lowest. The economic growth rate in the December quarter
of year 2018 adjusted by 0.2% and the growth rate was the weakest growth rate recorded
since the third quarter of 2016 resulting from the modest expansion in private investment and
contraction in dwelling investment. Furthermore, the unemployment rate in the country edged
up to 5% which was higher as against eight year low of 4.9% (Antonius and Gao 2015).
Therefore, the unemployment rate in the current period increased compared to previous
period.
People in Australia are considered to be the quick technology adopters and despite the
fact that digital lifestyle in the country is being promoted because of zealousness of electronic
Paraphrase This Document
Need a fresh take? Get an instant paraphrase of this document with our AI Paraphraser
CASE PROJECT REPORT
industry and doubling of the consumer spending in the last few years, consumer are still
lagging behind which makes the industry less attractive. Such lagging is attributable to lower
disposable income along with rising price of petrol. In addition to this, the growth of inflation
rate is being curbed by the rising interest rate and continuous growth of economy (Hatfield et
al. 2015). However, the spending of consumers on the consumer electronic products would
increase because of increase in the discretionary income and cutting down of the tax rate by
government.
3.3 New ventures funding system in Australia:
There are several funding sources that are used by the new business venture in
Australia. It has been ascertained that the start ups in the country rely on their savings,
personal credit facilities and credit cards instead of seeking external source of finance. In the
early stage of establishment of business such as TechSmart, they can make use of equity
source of finance for funding their operations and raising capital. In terms of setting up of
new business venture, Australia stands in the seventh position and when it comes to the ease
of carrying out any business, the county has been ranked tenth in the world (Turban et al.
2017).
3.4 Identifying the market trend of smart watches in Australia:
The market size of smart watch business in Australia is expected to increase as this
particular electronic device has started to make its way in the consumer shopping list. Some
of the features that owes to the standalone segment accounting for highest share of market are
acceptance of sim cards, wireless options, access to internet and its ability to be used as
Smartphone. The top factors that impacted the growth of smart watch market are increase in
health awareness among consumers and growth in demand for sport and wireless fitness
devices. However, the market growth of smart watch is restrained by factors such as lack of
CASE PROJECT REPORT
strong internet connectivity and higher cost. Moreover, there are various factors that would
provide lucrative opportunities to the growth of smart watch market and are expected to are
definite impact are increasing investment on building connected eco system (Manalo et al.
2015). In recent years, there has been high level of investment with significant expansion in
the capital shock of country. In this competitive environment, companies are taking effort to
reduce the prices and attracting consumers due to increasing landscape maturity.
The growth smart watch market in Australia is driven by numerous factors and they
are as follows:
People are increasingly using advanced gadgets to maintain fitness level due to better
access to technology and increase in consumer consciousness resulting from rapid
advancement of technology.
The carrier channel has made greater availability of the product along with the
reduction in the price. Purchasing of Smart watch have become easier due to the
availability of bundles and repayment plans.
The market of smart watch have been taken to next level due to innovative and new
features which is expected to boost the overall sales of market in the near future. It is
so because the companies have focus on developing and designing highly advanced
smart watches.
Customers are provided with the option of making mobile contactless payments using
smart watches and it is expected that such payment would be easier compared to
smart phones.
Smart watches have greater apparel to both the genders because of several additional
features such as uniqueness of bands, watch face and designs.
CASE PROJECT REPORT
The electronic market of Australia is highly competitive as there are several large
established brands and international brands are preferred by the local customers of country
and the existence of domestic smart watch player is considered to be insignificant in the
market of Australia. The players of Smart watch are provided with huge opportunity because
of fusion of smart watch and traditional mechanical watch. The smart watch industry of
Australia is dominated by number of international and regional players that offer different
services and products making rivalry to compete moderately (Tamm et al. 2016).
The smart watch market is considered to be highly dynamic and highly growth sector
that makes partnership and collaboration easier. For vendors in the country offering
electronic gods are provided with lucrative offers due to high income being spent by
consumers and strong demand for the products. However, due to the maturity, it has been
found that there is weakness in the consumer electronic market. Moreover, the penetration
rate of other devices such as computers, smart phones and television sets are quite high along
with diminish growth prospect as against the market of Asia Pacific (Weber 2016).
Furthermore, the confidence level and affordability of the consumers to spend on the
electronic goods has downside risk attached to it because of weakening economic growth and
currency depreciation.
3.5 Factors influencing the products price:
In Australia, there are several factors determining the prices of smart watch which
comprise of wage, local regulations, standards, insurance cost, government, distribution and
wholesale cost, rent cost and occupancy. The suppliers and manufacturers of the digital
product s a gadgets are affected due to variation in such costs between the markets. In
addition to this, there are other factors impacting them such as structure, nature and basis of
operations along with the level of competition and demand. It has been found that the unit
Secure Best Marks with AI Grader
Need help grading? Try our AI Grader for instant feedback on your assignments.
CASE PROJECT REPORT
costing of the products with specification is too high because of comparatively smaller
market and lack of scale of production. The reason why the products pricing in the country is
impacted by the regulation and standards of country is that there is deviation from
international specifications. Regulations and compliance are other factors that influence the
pricing of smart watch and it is expected that in the next three years, there will be rise of 75%
of expenditure and compliance cost (Pushkar and Dragunova 2016). Information technology
products in the country are regulated by the government at the federal and state level and
compliance to such regulations helps in ensuring that the usage of such products poses
minimal impact on environment and they are reliable. The products of IT are also applicable
to some regulations that are specific to this particular sector which include safety
requirements, labeling requirement as sought by telecommunication and schemes of
recycling.
Furthermore, it has been ascertained that the business would receive productivity
boosting due to making investment in information technology. Newer technologies have been
cites as the main reason for improvement in productivity along with the knowledge and skills
required for making business decision. Interference of government in monitoring the cost of
doing business would contribute by way of relieving pricing pressure of products which
involves burden of cumulative regulation and involvement of level of income tax (Yin and
Kaynak 2015).
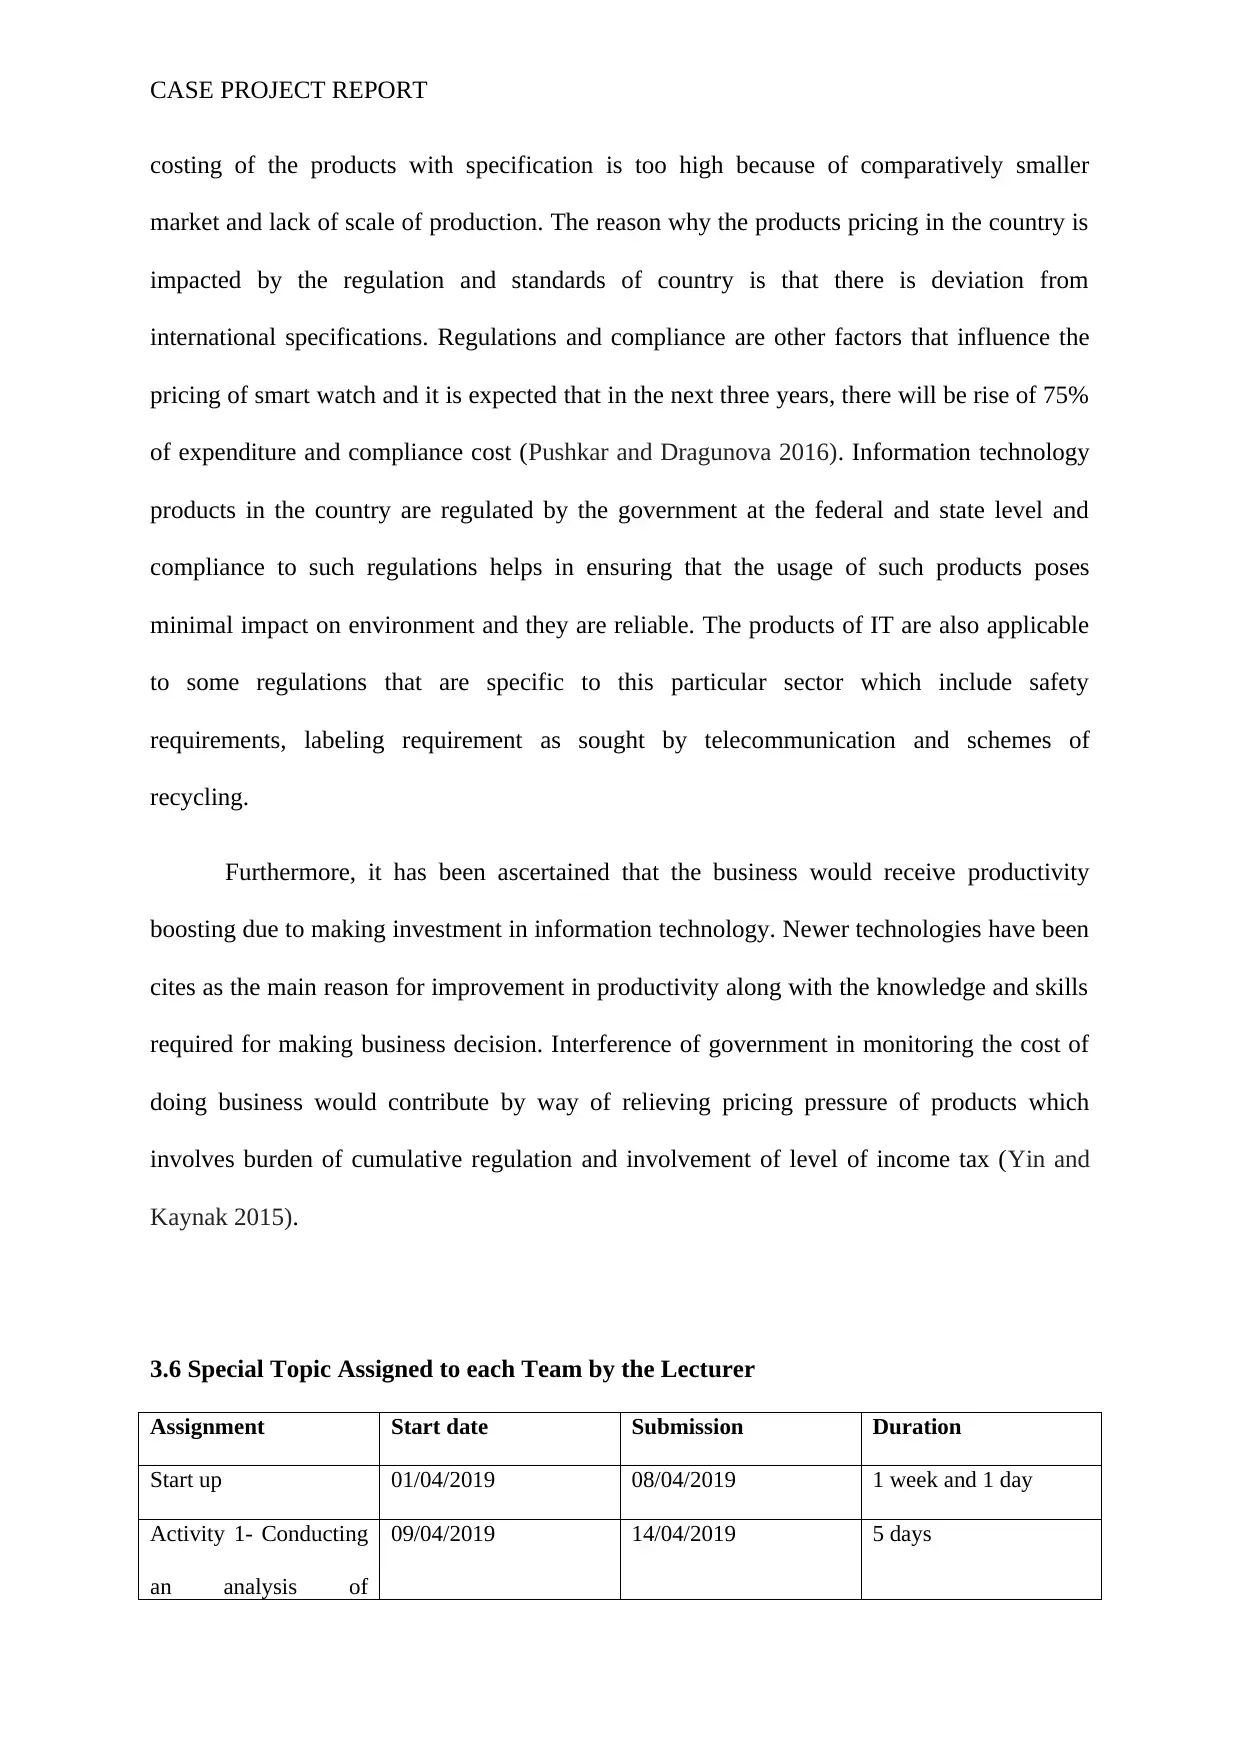
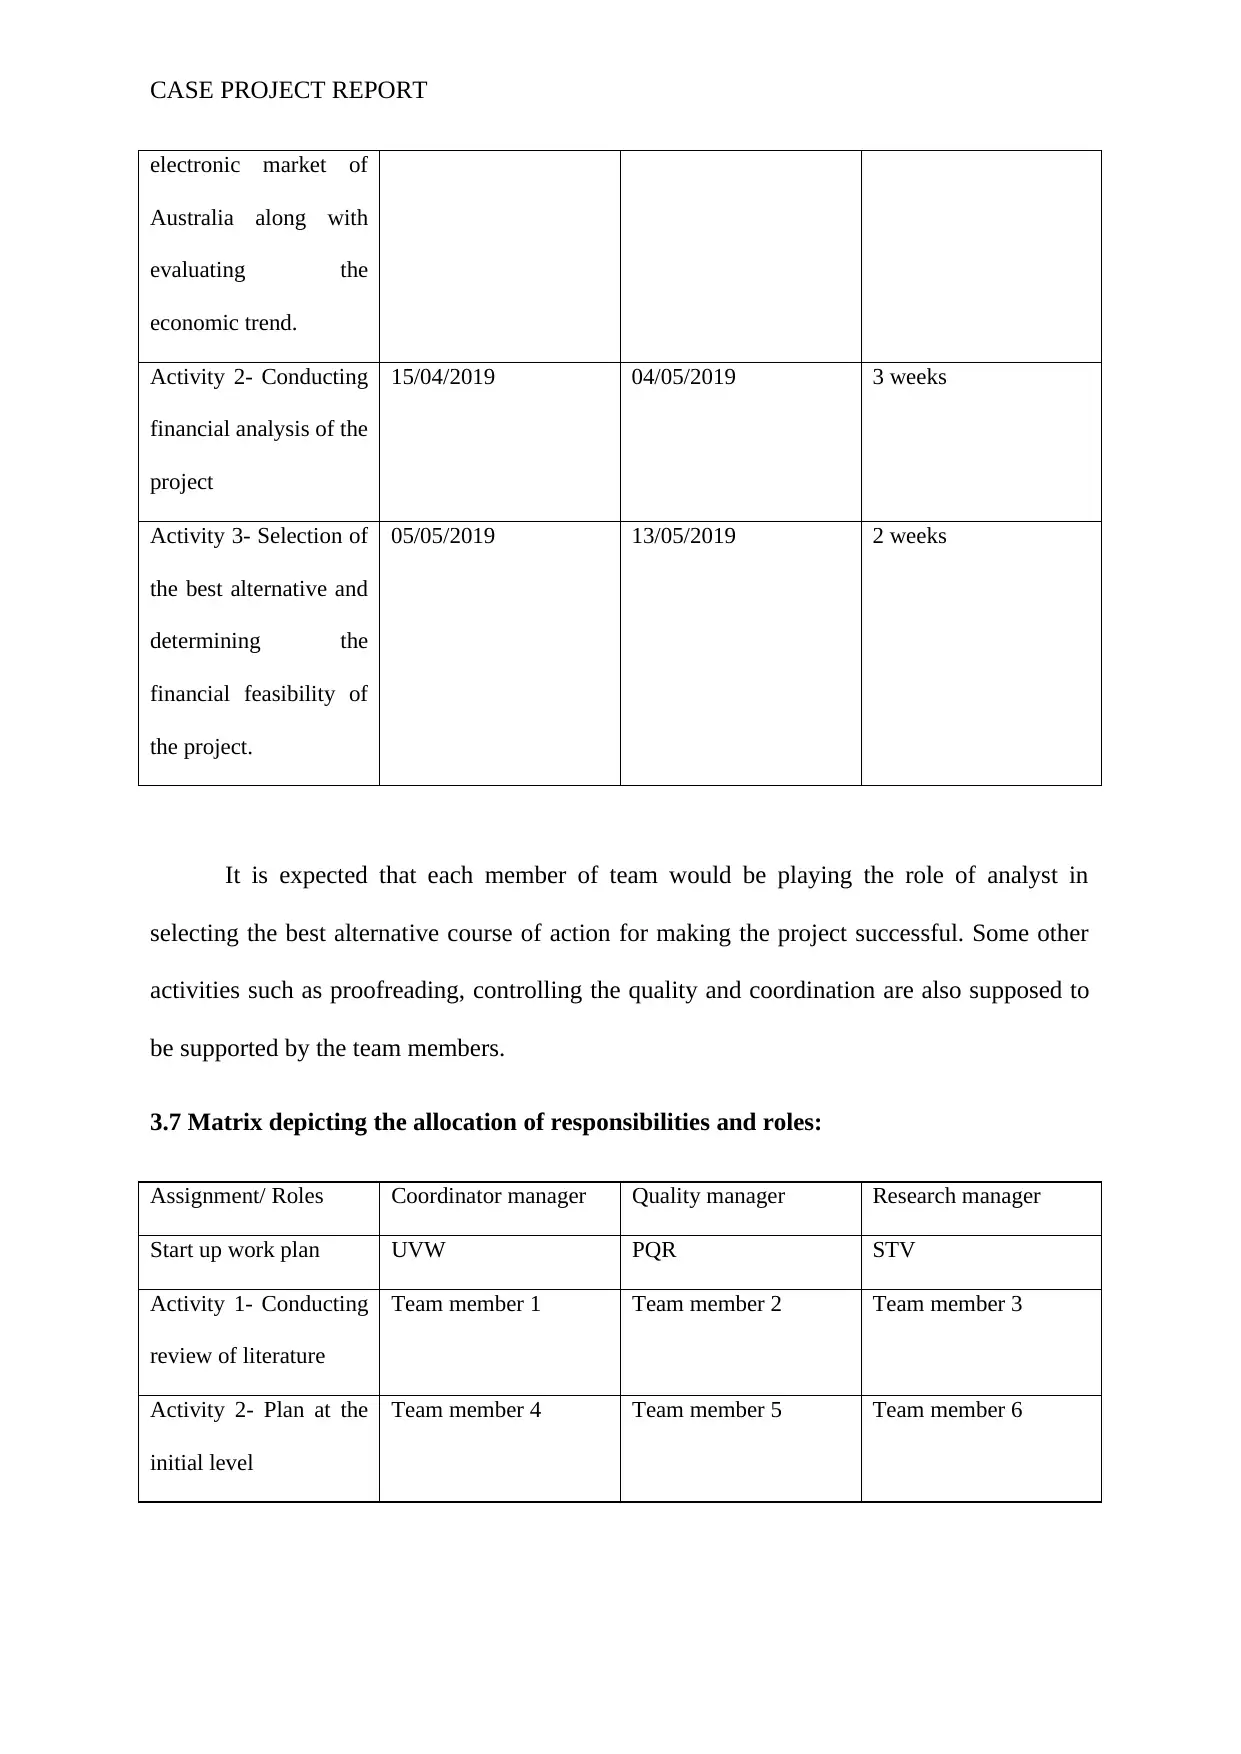
3.6 Special Topic Assigned to each Team by the Lecturer
Assignment Start date Submission Duration
Start up 01/04/2019 08/04/2019 1 week and 1 day
Activity 1- Conducting
an analysis of
09/04/2019 14/04/2019 5 days
costing of the products with specification is too high because of comparatively smaller
market and lack of scale of production. The reason why the products pricing in the country is
impacted by the regulation and standards of country is that there is deviation from
international specifications. Regulations and compliance are other factors that influence the
pricing of smart watch and it is expected that in the next three years, there will be rise of 75%
of expenditure and compliance cost (Pushkar and Dragunova 2016). Information technology
products in the country are regulated by the government at the federal and state level and
compliance to such regulations helps in ensuring that the usage of such products poses
minimal impact on environment and they are reliable. The products of IT are also applicable
to some regulations that are specific to this particular sector which include safety
requirements, labeling requirement as sought by telecommunication and schemes of
recycling.
Furthermore, it has been ascertained that the business would receive productivity
boosting due to making investment in information technology. Newer technologies have been
cites as the main reason for improvement in productivity along with the knowledge and skills
required for making business decision. Interference of government in monitoring the cost of
doing business would contribute by way of relieving pricing pressure of products which
involves burden of cumulative regulation and involvement of level of income tax (Yin and
Kaynak 2015).
3.6 Special Topic Assigned to each Team by the Lecturer
Assignment Start date Submission Duration
Start up 01/04/2019 08/04/2019 1 week and 1 day
Activity 1- Conducting
an analysis of
09/04/2019 14/04/2019 5 days
CASE PROJECT REPORT
electronic market of
Australia along with
evaluating the
economic trend.
Activity 2- Conducting
financial analysis of the
project
15/04/2019 04/05/2019 3 weeks
Activity 3- Selection of
the best alternative and
determining the
financial feasibility of
the project.
05/05/2019 13/05/2019 2 weeks
It is expected that each member of team would be playing the role of analyst in
selecting the best alternative course of action for making the project successful. Some other
activities such as proofreading, controlling the quality and coordination are also supposed to
be supported by the team members.
3.7 Matrix depicting the allocation of responsibilities and roles:
Assignment/ Roles Coordinator manager Quality manager Research manager
Start up work plan UVW PQR STV
Activity 1- Conducting
review of literature
Team member 1 Team member 2 Team member 3
Activity 2- Plan at the
initial level
Team member 4 Team member 5 Team member 6
CASE PROJECT REPORT
Activity 3- Detailed
plan
Team member 7 Team member 8 Team member 9
3.8 The Developed Methodology for the Case project
The project has been evaluated by adopting various methodologies that incorporates
accounting methodologies, sensitivity analysis and techniques of capital budgeting. In
addition to this, the project is also evaluated by using the tool of break even analysis and the
progression of business is analyzed and further evaluated using the performance indicators.
For conducting the economic evaluation of the project, there are some selected parameters
which comprised of capitalizing the expenditures, capital cost, fundamental growth and
earning (Lin and Tseng 2016). In addition to this, some further assumptions have been made
in terms of interest rate, gross domestic products and rate of inflation. Such assumptions have
helped in forecasting the balance sheet, cash flow and income statement of the case project.
In the given case, the performance of business variable is considered to be dependent
variables and rests of the factors are considered to be independent variables.
4. Financial Model of the Case Project
4.1 Assumptions including interest rates, inflation, project life, etc.
The table above presents the detailed assumption made for evaluating the financial
viability of the project. Such assumptions have been made by the management of
organization with the purpose of determining the project’s feasibility. The method of
depreciation that would be used for depreciating the assets used in the business includes both
straight line method and diminishing method of depreciation (Rees et al. 2016). The total cost
Paraphrase This Document
Need a fresh take? Get an instant paraphrase of this document with our AI Paraphraser
CASE PROJECT REPORT
incurred by setting up the new business venture is presented by the term initial expenses. All
such amount is the assumed and estimated by the management of organization.
4.2 Constraints
The business would be efficient on itself to carry out their operations because the
benefits that would be derived in terms of opening the smart watch business for producing
and supplying. However, there are certain shortfalls faced by business which is listed below:
There would be immense competition from the rivals in the market and it would be
required by the TechSamrt to develop appropriate strategy for competing with the
leading marketers such as Windows and Apple. Therefore, at the initial level, the
company would be faced with resource constraints.
The rapid development and changing technology comes with associated risk that the
developed products would become obsolete faster (Tseng et al. 2015). Therefore the
management planning to incorporate the technology in the smart watches would make
less appealing to customers because of technological advancement.
In this sector, it is of crucial importance that the employees have desired level of
technical expertise as it has an association with the advancement of technology. The
business performance depends to a great extent on the efficiency and overall skills of
employees (Karadag 2015).
4.3Risks
Smart watch business face certain types of risks and it are essential to identify such
risks as it would help in planning the business accordingly.
Financial risk- The newly established and start up firms face many financial risks in
their early stage of operations. This can be in terms of budgetary planning when the
CASE PROJECT REPORT
estimated expenses are less than the actual amount of expenses incurred (Barr and
McClellan 2018). Therefore, there exists the risk of financing the business when the
budget falls short of the realized amount of expenses.
Market risk- Business faces the risk of changing trend of market and how such
change in trend would impact the sales of products. The developed products with
particular features have the risk of becoming obsolete if there is a sudden change in
market (Hitt et al. 2016).
Management risk- The start ups also have the risk of management in terms of
decision making and therefore, it is required by the business to develop appropriate
business strategies to deal with such risk.
Cyber incidents risk- The start ups usually lacks sophisticated system and
capabilities and therefore they have the risk of getting attacked to cyber incidents.
Therefore, it becomes the responsibility of entire organization to deal with such risks
(Broadhurst 2017).
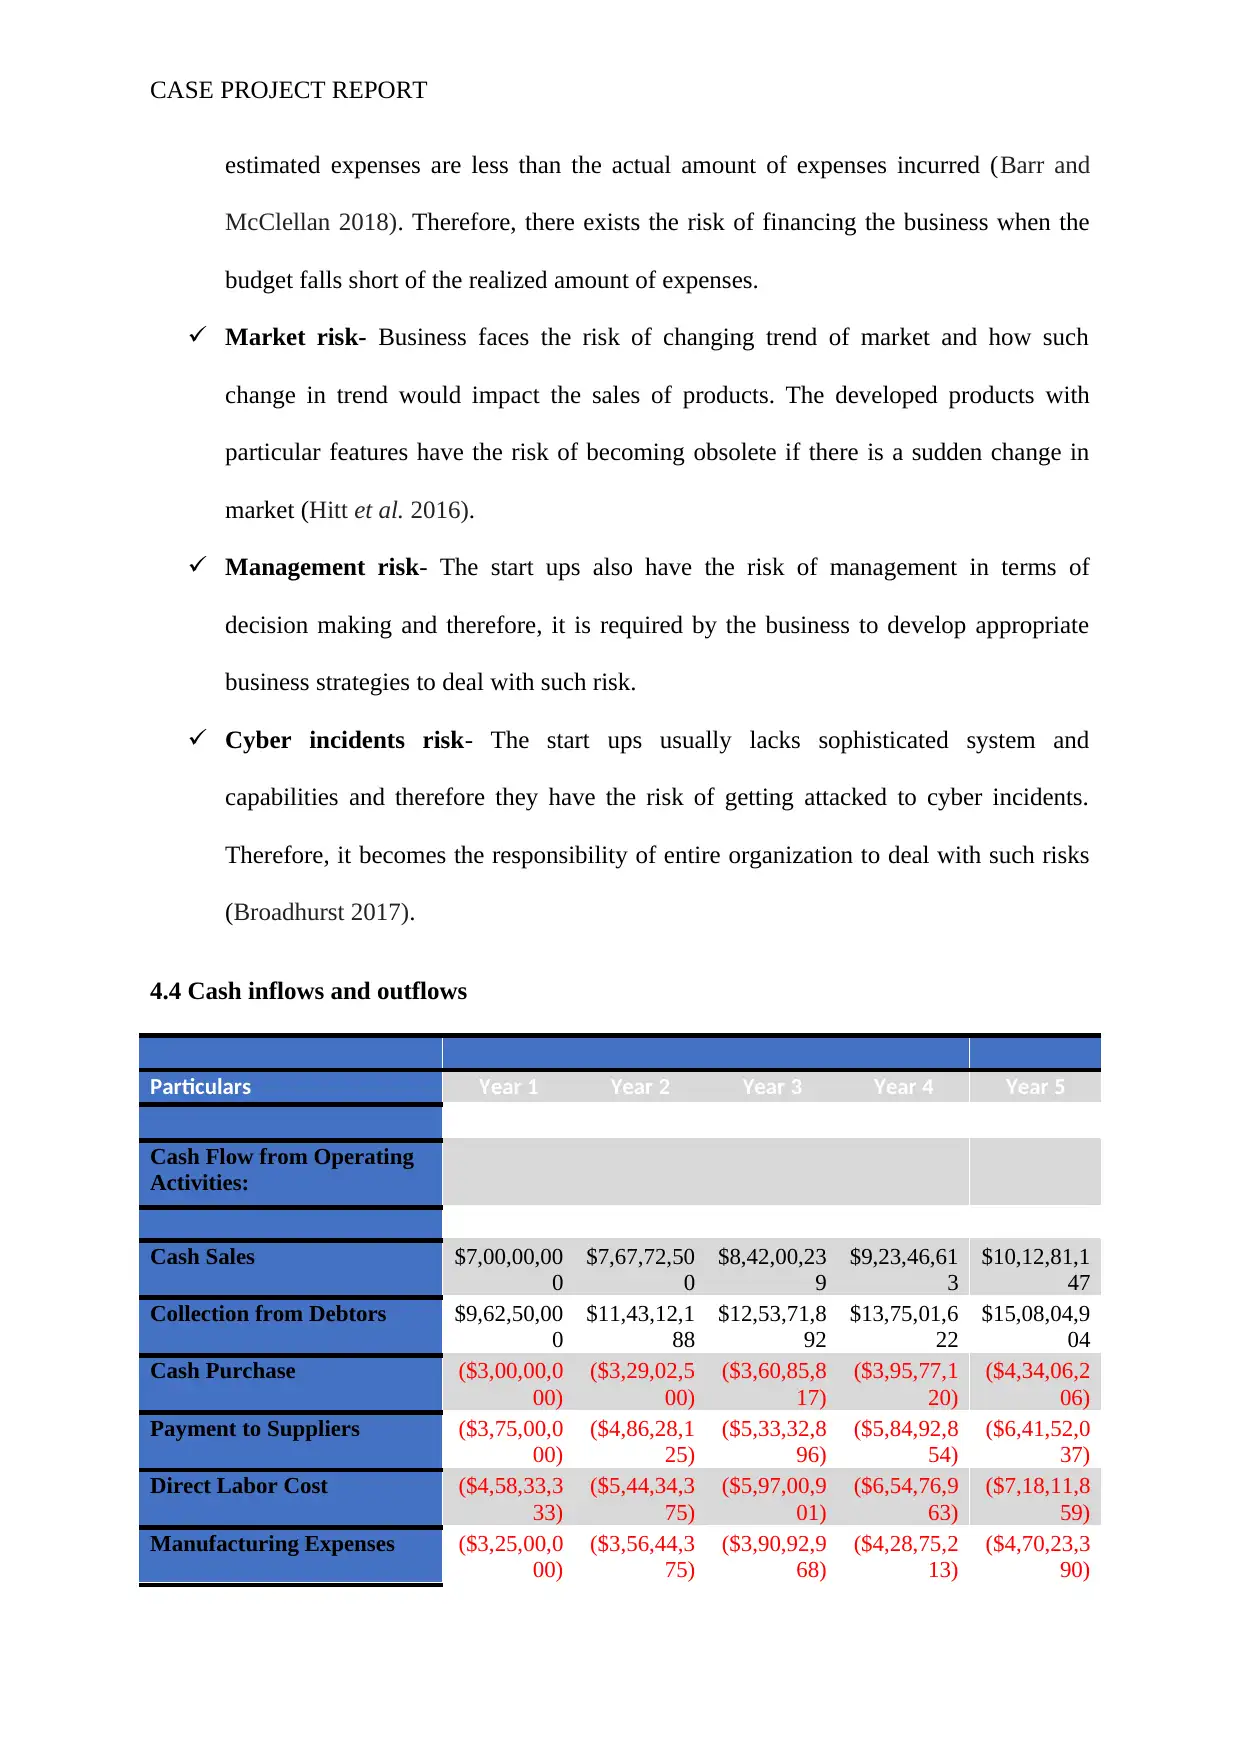
4.4 Cash inflows and outflows
Particulars Year 1 Year 2 Year 3 Year 4 Year 5
Cash Flow from Operating
Activities:
Cash Sales $7,00,00,00
0
$7,67,72,50
0
$8,42,00,23
9
$9,23,46,61
3
$10,12,81,1
47
Collection from Debtors $9,62,50,00
0
$11,43,12,1
88
$12,53,71,8
92
$13,75,01,6
22
$15,08,04,9
04
Cash Purchase ($3,00,00,0
00)
($3,29,02,5
00)
($3,60,85,8
17)
($3,95,77,1
20)
($4,34,06,2
06)
Payment to Suppliers ($3,75,00,0
00)
($4,86,28,1
25)
($5,33,32,8
96)
($5,84,92,8
54)
($6,41,52,0
37)
Direct Labor Cost ($4,58,33,3
33)
($5,44,34,3
75)
($5,97,00,9
01)
($6,54,76,9
63)
($7,18,11,8
59)
Manufacturing Expenses ($3,25,00,0
00)
($3,56,44,3
75)
($3,90,92,9
68)
($4,28,75,2
13)
($4,70,23,3
90)
estimated expenses are less than the actual amount of expenses incurred (Barr and
McClellan 2018). Therefore, there exists the risk of financing the business when the
budget falls short of the realized amount of expenses.
Market risk- Business faces the risk of changing trend of market and how such
change in trend would impact the sales of products. The developed products with
particular features have the risk of becoming obsolete if there is a sudden change in
market (Hitt et al. 2016).
Management risk- The start ups also have the risk of management in terms of
decision making and therefore, it is required by the business to develop appropriate
business strategies to deal with such risk.
Cyber incidents risk- The start ups usually lacks sophisticated system and
capabilities and therefore they have the risk of getting attacked to cyber incidents.
Therefore, it becomes the responsibility of entire organization to deal with such risks
(Broadhurst 2017).
4.4 Cash inflows and outflows
Particulars Year 1 Year 2 Year 3 Year 4 Year 5
Cash Flow from Operating
Activities:
Cash Sales $7,00,00,00
0
$7,67,72,50
0
$8,42,00,23
9
$9,23,46,61
3
$10,12,81,1
47
Collection from Debtors $9,62,50,00
0
$11,43,12,1
88
$12,53,71,8
92
$13,75,01,6
22
$15,08,04,9
04
Cash Purchase ($3,00,00,0
00)
($3,29,02,5
00)
($3,60,85,8
17)
($3,95,77,1
20)
($4,34,06,2
06)
Payment to Suppliers ($3,75,00,0
00)
($4,86,28,1
25)
($5,33,32,8
96)
($5,84,92,8
54)
($6,41,52,0
37)
Direct Labor Cost ($4,58,33,3
33)
($5,44,34,3
75)
($5,97,00,9
01)
($6,54,76,9
63)
($7,18,11,8
59)
Manufacturing Expenses ($3,25,00,0
00)
($3,56,44,3
75)
($3,90,92,9
68)
($4,28,75,2
13)
($4,70,23,3
90)
CASE PROJECT REPORT
Insurance ($12,000) ($12,300) ($12,608) ($12,923) ($13,246)
Rates & Taxes ($6,500) ($6,663) ($6,829) ($7,000) ($7,175)
Salary of Office Staffs ($91,667) ($1,02,292) ($1,04,849) ($1,07,470) ($1,10,157)
Cleaning Charges ($5,000) ($5,125) ($5,253) ($5,384) ($5,519)
Electricity for Office ($13,750) ($15,344) ($15,727) ($16,121) ($16,524)
Telephone & Internet ($7,333) ($8,183) ($8,388) ($8,598) ($8,813)
Salary of Marketing Staffs ($1,37,500) ($1,53,438) ($1,57,273) ($1,61,205) ($1,65,235)
Sales Commissions @1.5%
on Sales
($8,75,000) ($9,59,656) ($10,52,50
3)
($11,54,33
3)
($12,66,01
4)
Travelling charges @2% on
Sales
($4,37,500) ($4,79,828) ($5,26,251) ($5,77,166) ($6,33,007)
Income Tax Expenses ($33,95,40
1)
($38,74,05
9)
($43,96,84
2)
($49,68,29
5)
($55,93,37
2)
Cash Inflow/(Outflow) from
Operating Activities
$1,54,35,01
6
$1,38,58,42
5
$1,50,73,02
5
$1,64,07,59
0
$1,78,73,49
8
Cash Flow from Investing
Activities:
Purchase of Non-Current
Assets
($59,00,00
0)
Preliminary Expenses ($5,00,000)
Sale of Assets $11,20,000
Return on Deposits $1,20,000
Cash Inflow/(Outflow) from
Investing Activities
($64,00,00
0)
$0 $0 $0 $12,40,000
Cash Flow from Financing
Activities:
Share Issue $3,87,92,02
5
Bonds Issue $2,84,47,48
5
Loan From Bank $1,89,64,99
0
Interest Payment ($37,92,99
8)
($37,92,99
8)
($37,92,99
8)
($37,92,99
8)
($37,92,99
8)
Dividend Payment ($27,72,91
0)
($31,63,81
5)
($35,90,75
5)
($40,57,44
1)
($45,67,92
0)
Repayment of Bond ($2,84,47,4
85)
Repayment of Loan from
Bank
($1,89,64,9
90)
Secure Best Marks with AI Grader
Need help grading? Try our AI Grader for instant feedback on your assignments.
CASE PROJECT REPORT
Cash Inflow/(Outflow) from
Financing Activities
$7,96,38,59
2
($69,56,81
3)
($73,83,75
3)
($78,50,43
9)
($5,57,73,3
93)
Net Cash
Increase/(Decrease) for the
period
$8,86,73,60
8
$69,01,612 $76,89,272 $85,57,151 ($3,66,59,8
95)
Add: Opening Cash Balance $0 $8,86,73,60
8
$9,55,75,22
0
$10,32,64,4
92
$11,18,21,6
43
Closing Cash Balance $8,86,73,60
8
$9,55,75,22
0
$10,32,64,4
92
$11,18,21,6
43
$7,51,61,74
8
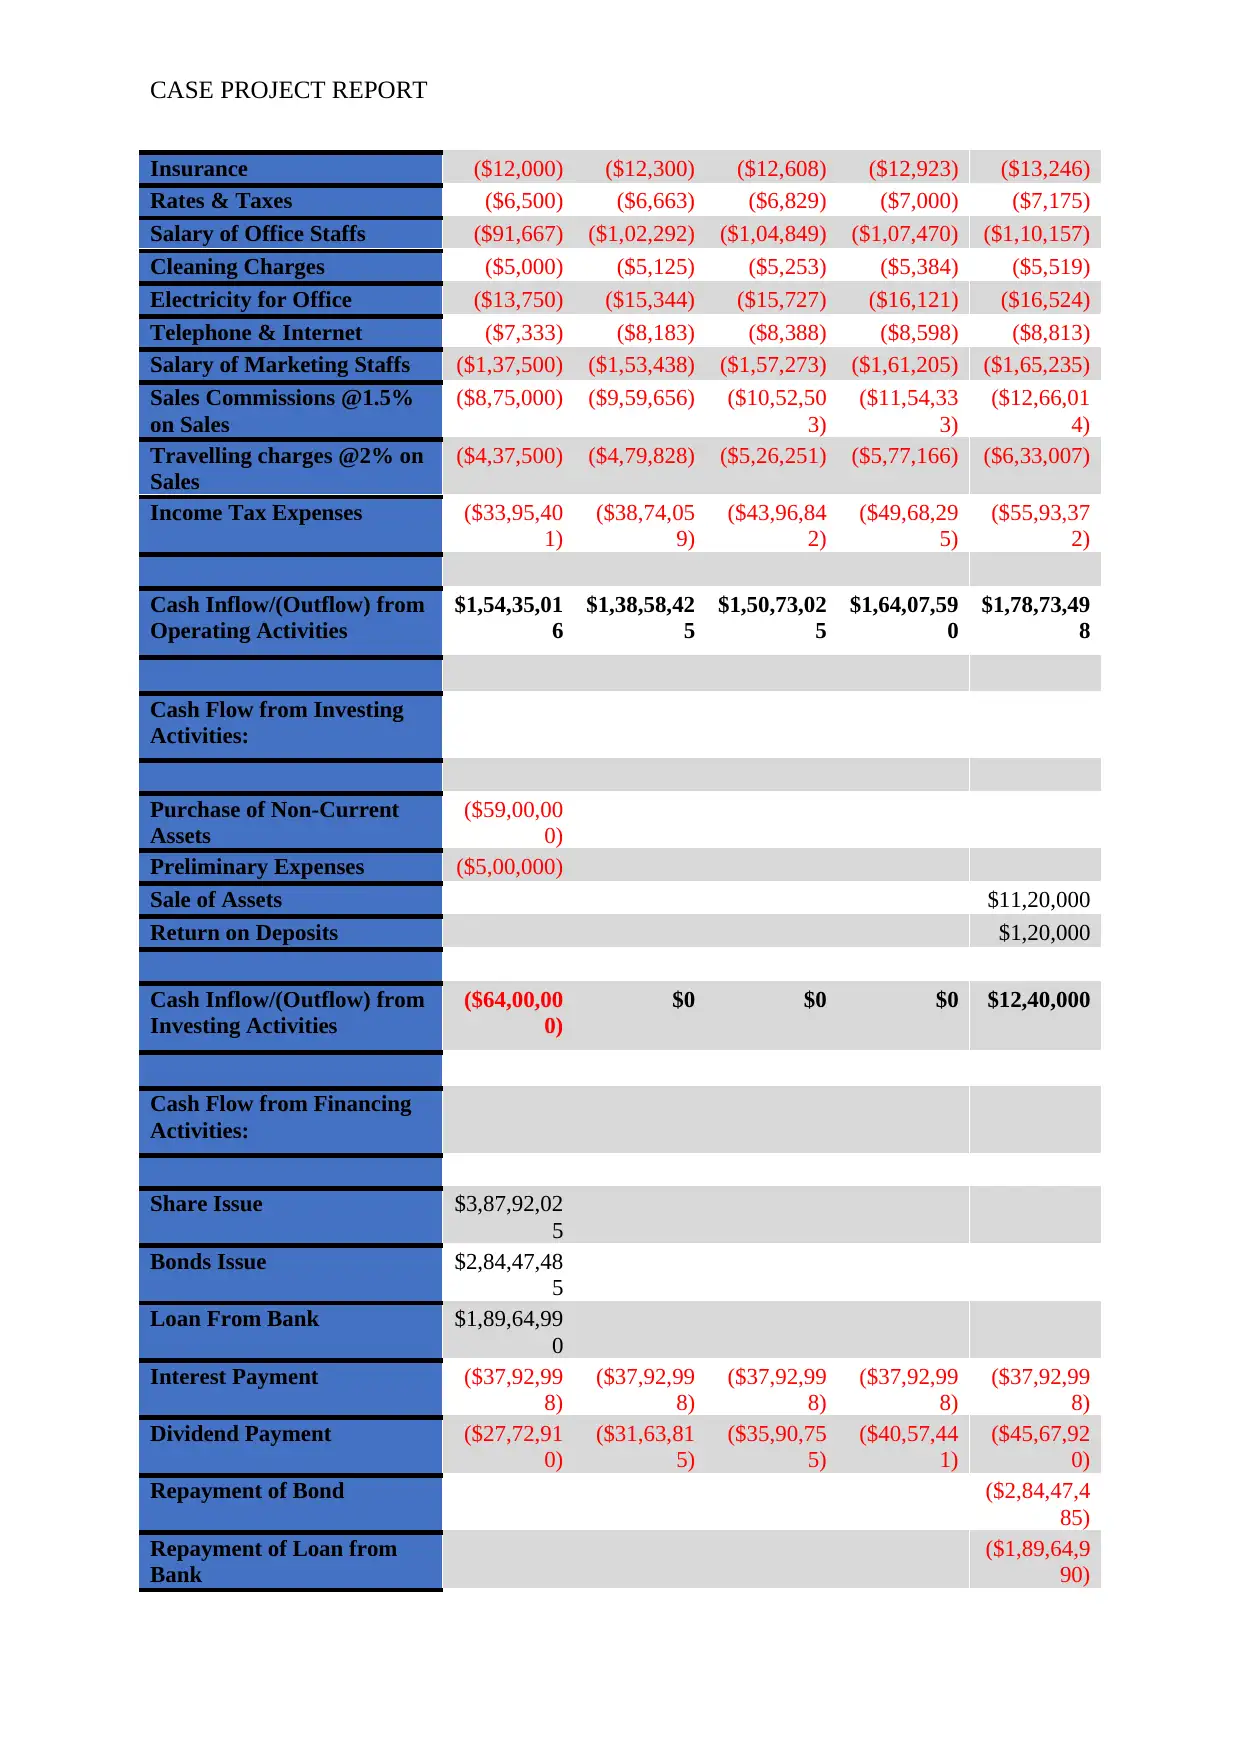
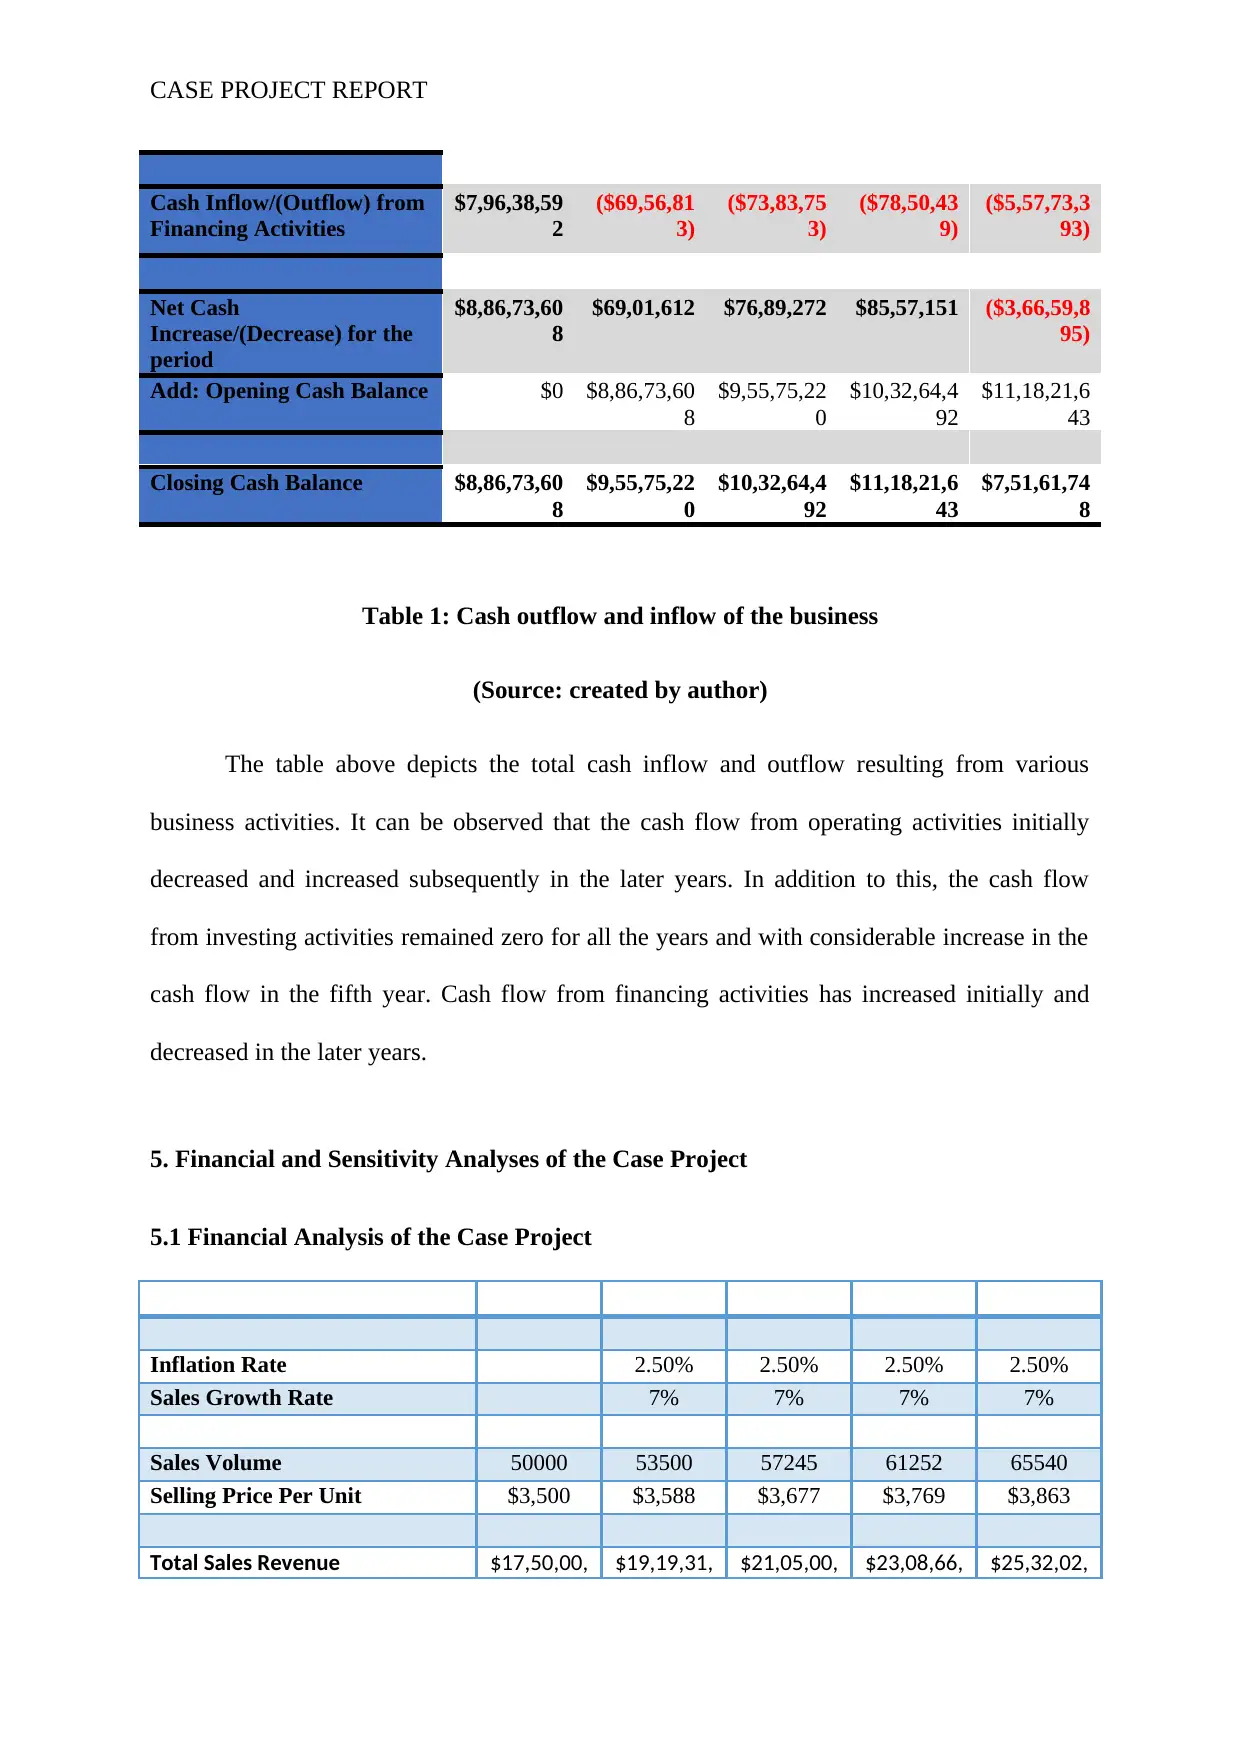
Table 1: Cash outflow and inflow of the business
(Source: created by author)
The table above depicts the total cash inflow and outflow resulting from various
business activities. It can be observed that the cash flow from operating activities initially
decreased and increased subsequently in the later years. In addition to this, the cash flow
from investing activities remained zero for all the years and with considerable increase in the
cash flow in the fifth year. Cash flow from financing activities has increased initially and
decreased in the later years.
5. Financial and Sensitivity Analyses of the Case Project
5.1 Financial Analysis of the Case Project
Particulars Year 1 Year 2 Year 3 Year 4 Year 5
Inflation Rate 2.50% 2.50% 2.50% 2.50%
Sales Growth Rate 7% 7% 7% 7%
Sales Volume 50000 53500 57245 61252 65540
Selling Price Per Unit $3,500 $3,588 $3,677 $3,769 $3,863
Total Sales Revenue $17,50,00, $19,19,31, $21,05,00, $23,08,66, $25,32,02,
Cash Inflow/(Outflow) from
Financing Activities
$7,96,38,59
2
($69,56,81
3)
($73,83,75
3)
($78,50,43
9)
($5,57,73,3
93)
Net Cash
Increase/(Decrease) for the
period
$8,86,73,60
8
$69,01,612 $76,89,272 $85,57,151 ($3,66,59,8
95)
Add: Opening Cash Balance $0 $8,86,73,60
8
$9,55,75,22
0
$10,32,64,4
92
$11,18,21,6
43
Closing Cash Balance $8,86,73,60
8
$9,55,75,22
0
$10,32,64,4
92
$11,18,21,6
43
$7,51,61,74
8
Table 1: Cash outflow and inflow of the business
(Source: created by author)
The table above depicts the total cash inflow and outflow resulting from various
business activities. It can be observed that the cash flow from operating activities initially
decreased and increased subsequently in the later years. In addition to this, the cash flow
from investing activities remained zero for all the years and with considerable increase in the
cash flow in the fifth year. Cash flow from financing activities has increased initially and
decreased in the later years.
5. Financial and Sensitivity Analyses of the Case Project
5.1 Financial Analysis of the Case Project
Particulars Year 1 Year 2 Year 3 Year 4 Year 5
Inflation Rate 2.50% 2.50% 2.50% 2.50%
Sales Growth Rate 7% 7% 7% 7%
Sales Volume 50000 53500 57245 61252 65540
Selling Price Per Unit $3,500 $3,588 $3,677 $3,769 $3,863
Total Sales Revenue $17,50,00, $19,19,31, $21,05,00, $23,08,66, $25,32,02,
CASE PROJECT REPORT
000 250 598 531 868
Cost of Good Sold per unit:
Raw Material Consumed ($1,500) ($1,538) ($1,576) ($1,615) ($1,656)
Direct Labor Cost ($1,000) ($1,025) ($1,051) ($1,077) ($1,104)
Total Cost of Goods Sold p.u. ($2,500) ($2,563) ($2,627) ($2,692) ($2,760)
Total Cost of Goods Sold ($12,50,00
,000)
($13,70,93
,750)
($15,03,57
,570)
($16,49,04
,665)
($18,08,59
,192)
GROSS PROFIT $5,00,00,0
00
$5,48,37,5
00
$6,01,43,0
28
$6,59,61,8
66
$7,23,43,6
77
Variable Manufacturing
Overhead p.u
($650) ($666) ($683) ($700) ($717)
Total Variable Manufacturing
Overhead
($3,25,00,
000)
($3,56,44,
375)
($3,90,92,
968)
($4,28,75,
213)
($4,70,23,
390)
Depreciation on Property, Plant
& Equipment
($2,80,000
)
($2,80,000
)
($2,80,000
)
($2,80,000
)
($2,80,000
)
Total Manufacturing Overhead ($3,27,80,
000)
($3,59,24,
375)
($3,93,72,
968)
($4,31,55,
213)
($4,73,03,
390)
General Administrative
Expenses:
Depreciation on Furniture &
Fixtures
($80,000) ($72,000) ($64,800) ($58,320) ($52,488)
Depreciation on Computer
Equipment
($1,20,000
)
($1,05,600
)
($92,928) ($81,777) ($71,963)
Amortization of Patent ($80,000) ($80,000) ($80,000) ($80,000) ($80,000)
Amortization of Trademark ($1,00,000
)
($1,00,000
)
($1,00,000
)
($1,00,000
)
($1,00,000
)
Insurance ($12,000) ($12,300) ($12,608) ($12,923) ($13,246)
Rates & Taxes ($6,500) ($6,663) ($6,829) ($7,000) ($7,175)
Salary of Office Staffs ($1,00,000
)
($1,02,500
)
($1,05,063
)
($1,07,689
)
($1,10,381
)
Cleaning Charges ($5,000) ($5,125) ($5,253) ($5,384) ($5,519)
Electricity for Office ($15,000) ($15,375) ($15,759) ($16,153) ($16,557)
Telephone & Internet ($8,000) ($8,200) ($8,405) ($8,615) ($8,831)
Total General Administrative
Expenses
($5,26,500
)
($5,07,763
)
($4,91,645
)
($4,77,861
)
($4,66,160
)
Selling & Marketing Expenses:
Depreciation on Motor Vehicle ($1,20,000 ($1,05,600 ($92,928) ($81,777) ($71,963)
CASE PROJECT REPORT
) )
Salary of Marketing Staffs ($1,50,000
)
($1,53,750
)
($1,57,594
)
($1,61,534
)
($1,65,572
)
Sales Commissions @0.5% on
Sales
($8,75,000
)
($9,59,656
)
($10,52,50
3)
($11,54,33
3)
($12,66,01
4)
Travelling charges @0.25% on
Sales
($4,37,500
)
($4,79,828
)
($5,26,251
)
($5,77,166
)
($6,33,007
)
Total Selling & Marketing
Expenses
($15,82,50
0)
($16,98,83
4)
($18,29,27
6)
($19,74,80
9)
($21,36,55
7)
Net Operating Profit/(Loss) $1,51,11,0
00
$1,67,06,5
28
$1,84,49,1
39
$2,03,53,9
83
$2,24,37,5
70
Interest Expenses:
Interest on Bond ($19,91,32
4)
($19,91,32
4)
($19,91,32
4)
($19,91,32
4)
($19,91,32
4)
Interest on Loan From Bank ($18,01,67
4)
($18,01,67
4)
($18,01,67
4)
($18,01,67
4)
($18,01,67
4)
Total Interest Expenses ($37,92,99
8)
($37,92,99
8)
($37,92,99
8)
($37,92,99
8)
($37,92,99
8)
Net Profit before Tax $1,13,18,0
02
$1,29,13,5
30
$1,46,56,1
41
$1,65,60,9
85
$1,86,44,5
72
Income Tax Expenses ($33,95,40
1)
($38,74,05
9)
($43,96,84
2)
($49,68,29
5)
($55,93,37
2)
Net Profit after Tax $79,22,60
1
$90,39,47
1
$1,02,59,2
99
$1,15,92,6
89
$1,30,51,2
00
Gross Profit Margin 28.57% 28.57% 28.57% 28.57% 28.57%
Net Profit Margin 4.53% 4.71% 4.87% 5.02% 5.15%
Return on Equity 20.42% 23.30% 26.45% 29.88% 33.64%
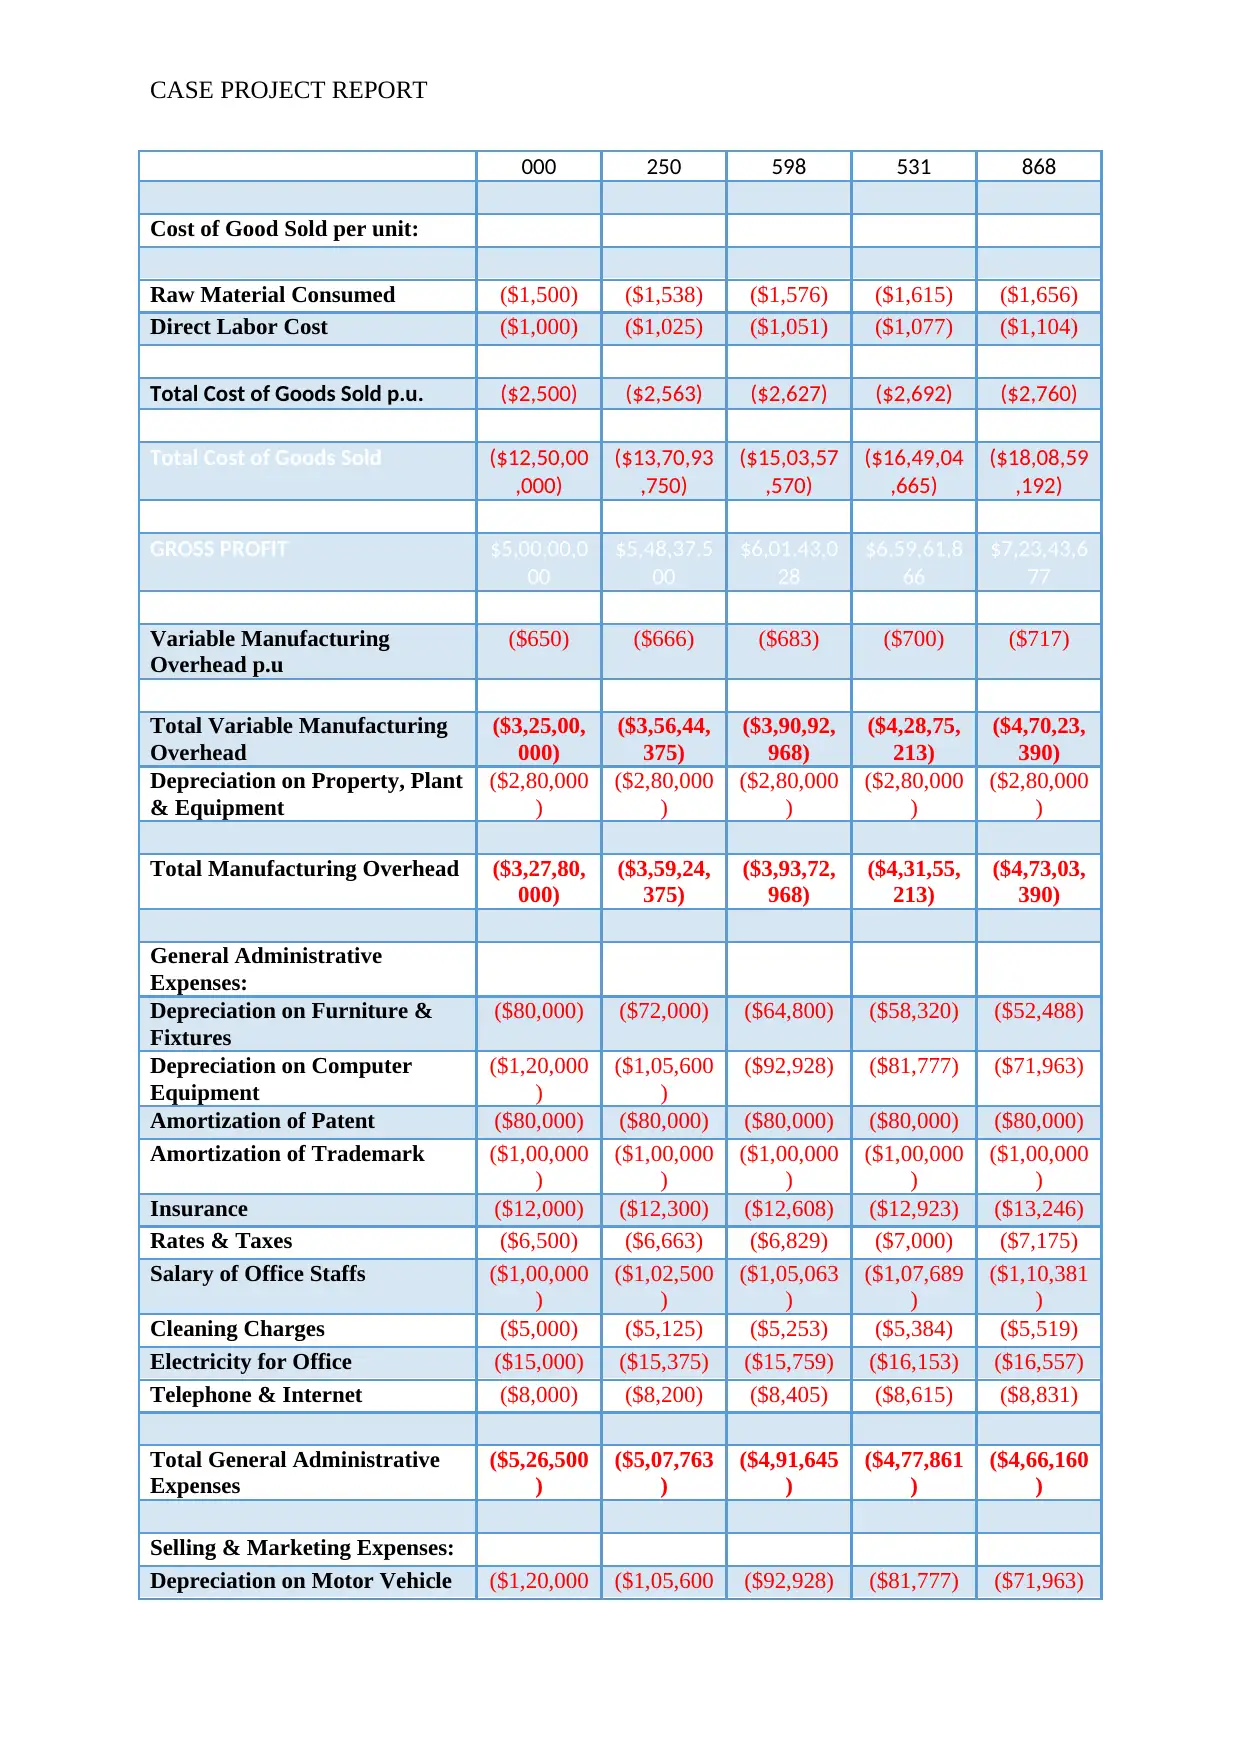
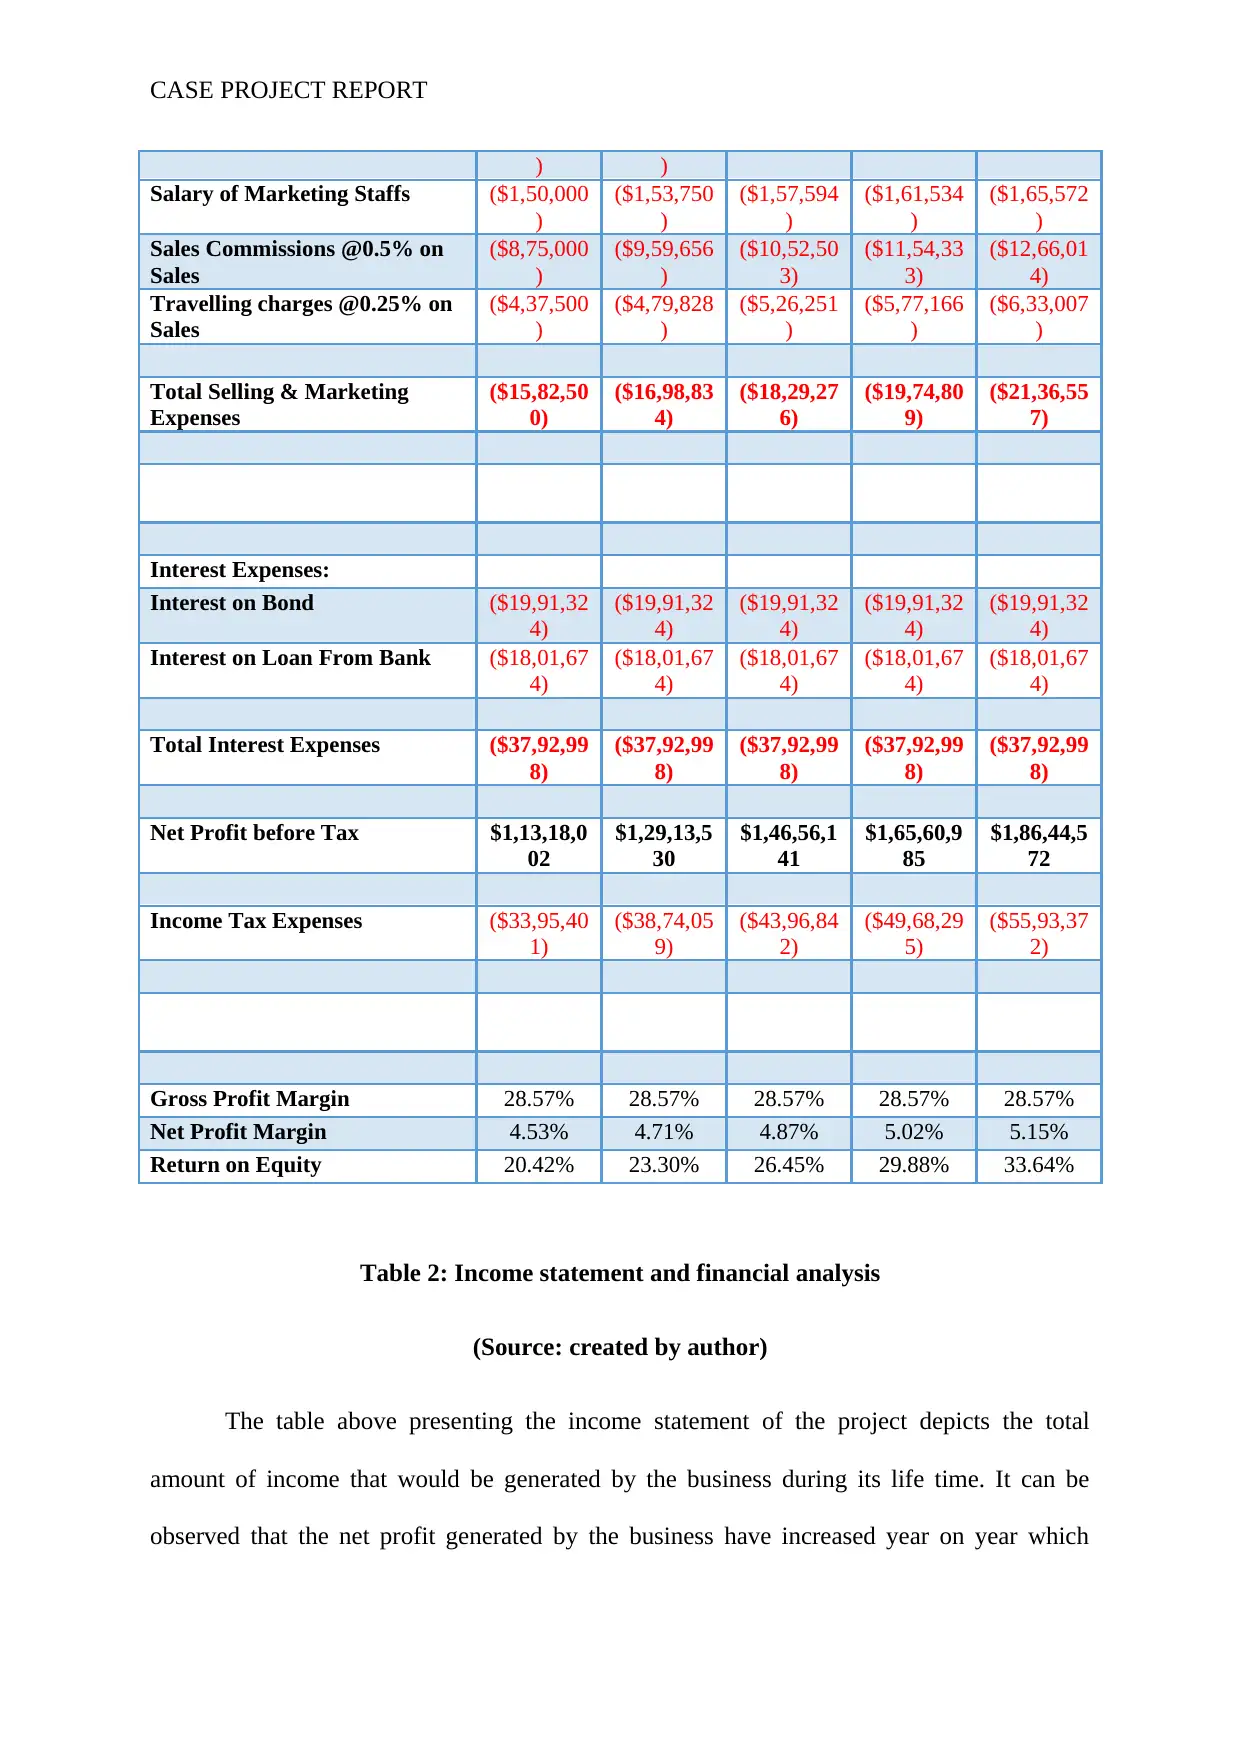
Table 2: Income statement and financial analysis
(Source: created by author)
The table above presenting the income statement of the project depicts the total
amount of income that would be generated by the business during its life time. It can be
observed that the net profit generated by the business have increased year on year which
) )
Salary of Marketing Staffs ($1,50,000
)
($1,53,750
)
($1,57,594
)
($1,61,534
)
($1,65,572
)
Sales Commissions @0.5% on
Sales
($8,75,000
)
($9,59,656
)
($10,52,50
3)
($11,54,33
3)
($12,66,01
4)
Travelling charges @0.25% on
Sales
($4,37,500
)
($4,79,828
)
($5,26,251
)
($5,77,166
)
($6,33,007
)
Total Selling & Marketing
Expenses
($15,82,50
0)
($16,98,83
4)
($18,29,27
6)
($19,74,80
9)
($21,36,55
7)
Net Operating Profit/(Loss) $1,51,11,0
00
$1,67,06,5
28
$1,84,49,1
39
$2,03,53,9
83
$2,24,37,5
70
Interest Expenses:
Interest on Bond ($19,91,32
4)
($19,91,32
4)
($19,91,32
4)
($19,91,32
4)
($19,91,32
4)
Interest on Loan From Bank ($18,01,67
4)
($18,01,67
4)
($18,01,67
4)
($18,01,67
4)
($18,01,67
4)
Total Interest Expenses ($37,92,99
8)
($37,92,99
8)
($37,92,99
8)
($37,92,99
8)
($37,92,99
8)
Net Profit before Tax $1,13,18,0
02
$1,29,13,5
30
$1,46,56,1
41
$1,65,60,9
85
$1,86,44,5
72
Income Tax Expenses ($33,95,40
1)
($38,74,05
9)
($43,96,84
2)
($49,68,29
5)
($55,93,37
2)
Net Profit after Tax $79,22,60
1
$90,39,47
1
$1,02,59,2
99
$1,15,92,6
89
$1,30,51,2
00
Gross Profit Margin 28.57% 28.57% 28.57% 28.57% 28.57%
Net Profit Margin 4.53% 4.71% 4.87% 5.02% 5.15%
Return on Equity 20.42% 23.30% 26.45% 29.88% 33.64%
Table 2: Income statement and financial analysis
(Source: created by author)
The table above presenting the income statement of the project depicts the total
amount of income that would be generated by the business during its life time. It can be
observed that the net profit generated by the business have increased year on year which
Paraphrase This Document
Need a fresh take? Get an instant paraphrase of this document with our AI Paraphraser
CASE PROJECT REPORT
implies that it would be possible for the business to make reinvestment and add to the
continuity of business. The gross profit margin remained at the same percentage. However,
the net profit margin of the project increased by value every year. In addition to this, the
return in equity of the project is increasing continuously which is indicative of the fact that
the amount of equity employed would generate increasing return with passing years (Kidwell
et al. 2016).
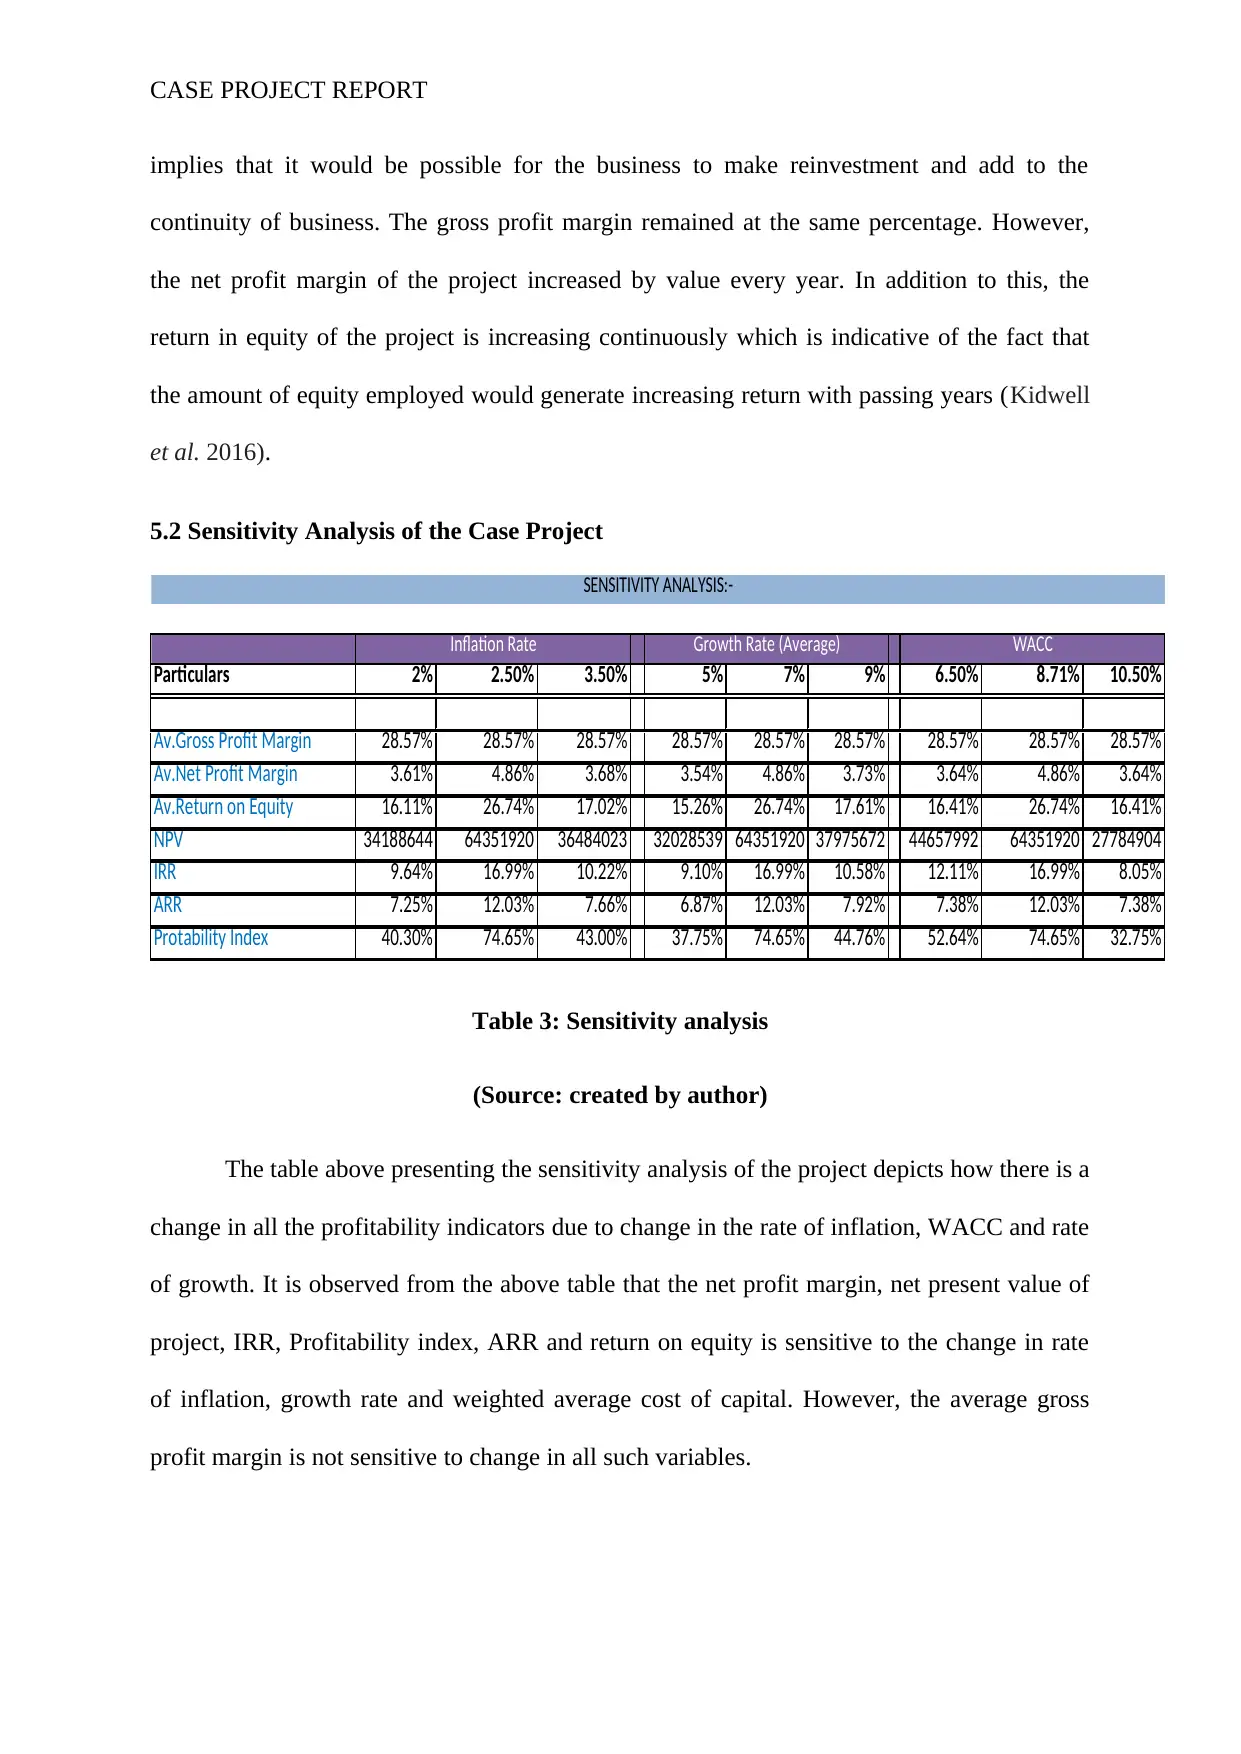
5.2 Sensitivity Analysis of the Case Project
Particulars 2% 2.50% 3.50% 5% 7% 9% 6.50% 8.71% 10.50%
Av.Gross Profit Margin 28.57% 28.57% 28.57% 28.57% 28.57% 28.57% 28.57% 28.57% 28.57%
Av.Net Profit Margin 3.61% 4.86% 3.68% 3.54% 4.86% 3.73% 3.64% 4.86% 3.64%
Av.Return on Equity 16.11% 26.74% 17.02% 15.26% 26.74% 17.61% 16.41% 26.74% 16.41%
NPV 34188644 64351920 36484023 32028539 64351920 37975672 44657992 64351920 27784904
IRR 9.64% 16.99% 10.22% 9.10% 16.99% 10.58% 12.11% 16.99% 8.05%
ARR 7.25% 12.03% 7.66% 6.87% 12.03% 7.92% 7.38% 12.03% 7.38%
Protability Index 40.30% 74.65% 43.00% 37.75% 74.65% 44.76% 52.64% 74.65% 32.75%
Inflation Rate Growth Rate (Average) WACC
SENSITIVITY ANALYSIS:-
Table 3: Sensitivity analysis
(Source: created by author)
The table above presenting the sensitivity analysis of the project depicts how there is a
change in all the profitability indicators due to change in the rate of inflation, WACC and rate
of growth. It is observed from the above table that the net profit margin, net present value of
project, IRR, Profitability index, ARR and return on equity is sensitive to the change in rate
of inflation, growth rate and weighted average cost of capital. However, the average gross
profit margin is not sensitive to change in all such variables.
implies that it would be possible for the business to make reinvestment and add to the
continuity of business. The gross profit margin remained at the same percentage. However,
the net profit margin of the project increased by value every year. In addition to this, the
return in equity of the project is increasing continuously which is indicative of the fact that
the amount of equity employed would generate increasing return with passing years (Kidwell
et al. 2016).
5.2 Sensitivity Analysis of the Case Project
Particulars 2% 2.50% 3.50% 5% 7% 9% 6.50% 8.71% 10.50%
Av.Gross Profit Margin 28.57% 28.57% 28.57% 28.57% 28.57% 28.57% 28.57% 28.57% 28.57%
Av.Net Profit Margin 3.61% 4.86% 3.68% 3.54% 4.86% 3.73% 3.64% 4.86% 3.64%
Av.Return on Equity 16.11% 26.74% 17.02% 15.26% 26.74% 17.61% 16.41% 26.74% 16.41%
NPV 34188644 64351920 36484023 32028539 64351920 37975672 44657992 64351920 27784904
IRR 9.64% 16.99% 10.22% 9.10% 16.99% 10.58% 12.11% 16.99% 8.05%
ARR 7.25% 12.03% 7.66% 6.87% 12.03% 7.92% 7.38% 12.03% 7.38%
Protability Index 40.30% 74.65% 43.00% 37.75% 74.65% 44.76% 52.64% 74.65% 32.75%
Inflation Rate Growth Rate (Average) WACC
SENSITIVITY ANALYSIS:-
Table 3: Sensitivity analysis
(Source: created by author)
The table above presenting the sensitivity analysis of the project depicts how there is a
change in all the profitability indicators due to change in the rate of inflation, WACC and rate
of growth. It is observed from the above table that the net profit margin, net present value of
project, IRR, Profitability index, ARR and return on equity is sensitive to the change in rate
of inflation, growth rate and weighted average cost of capital. However, the average gross
profit margin is not sensitive to change in all such variables.
CASE PROJECT REPORT
5.3 Other non-financial decision making factors involved in the Case Project
Some of the non financial factors that influence decision making by the business are
as follows:
It is required by the business to strictly comply with the regulations and standard for
carrying out the business in a seamless way.
The business should adhere to all the required and necessary regulations so that the
code of conduct of doing business is ethical.
The employees of business should try to deal with the customers in an environmental
friendly manner.
The productivity of business is also influenced by the motivation of employees in the
engagement of business activities.
The structure of organization also plays an important role in conducting the operations
of business so that the employees and managers are well aware of their
responsibilities (Robinson 2016).
5.4 Selection of Best Alternative
It can be observed from the analysis of the various financial decision making tools
that carrying out the project would be feasible. This is so because the present value of cash
flow of business is positive and internal rate of return being more than the cost of capital
(Bekaert and Hodrick 2017). Therefore, it would be appropriate to start the business of smart
watch.
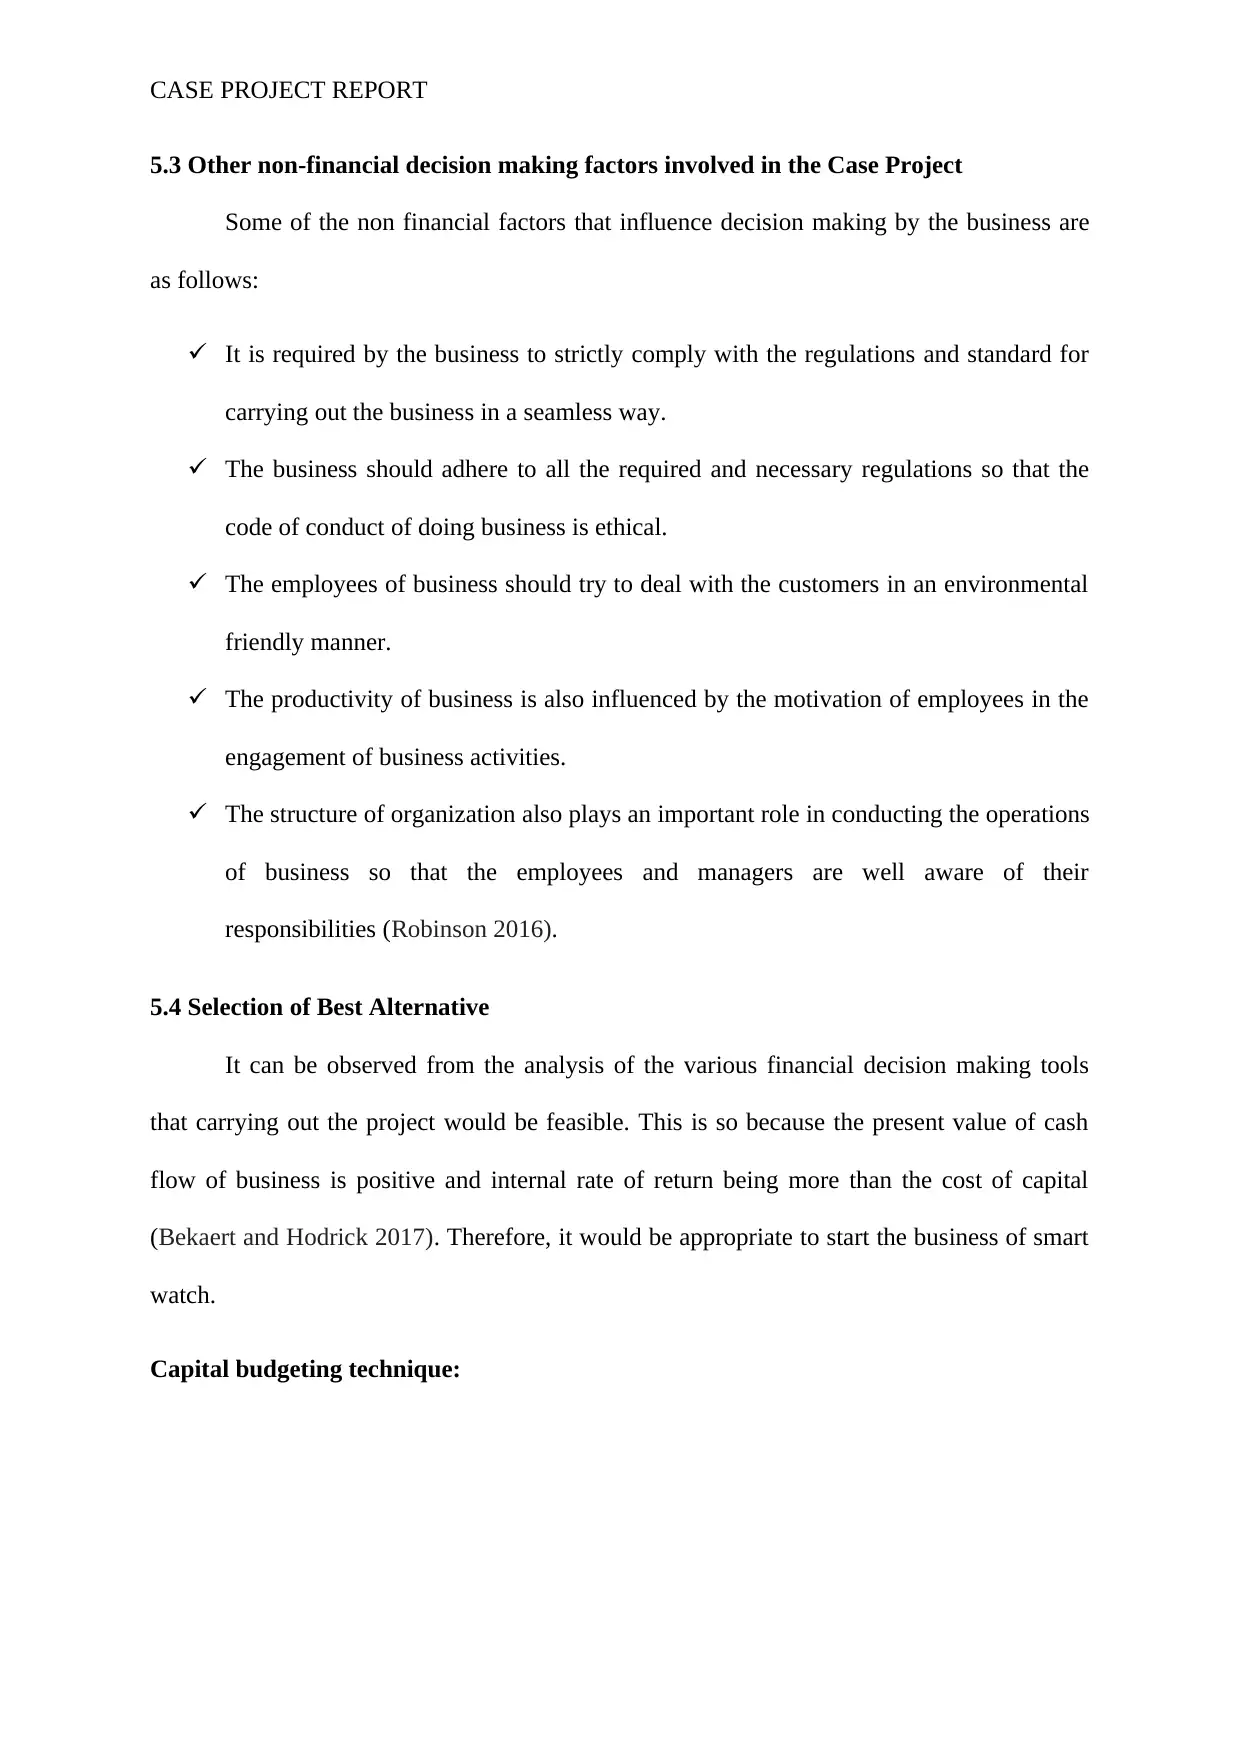
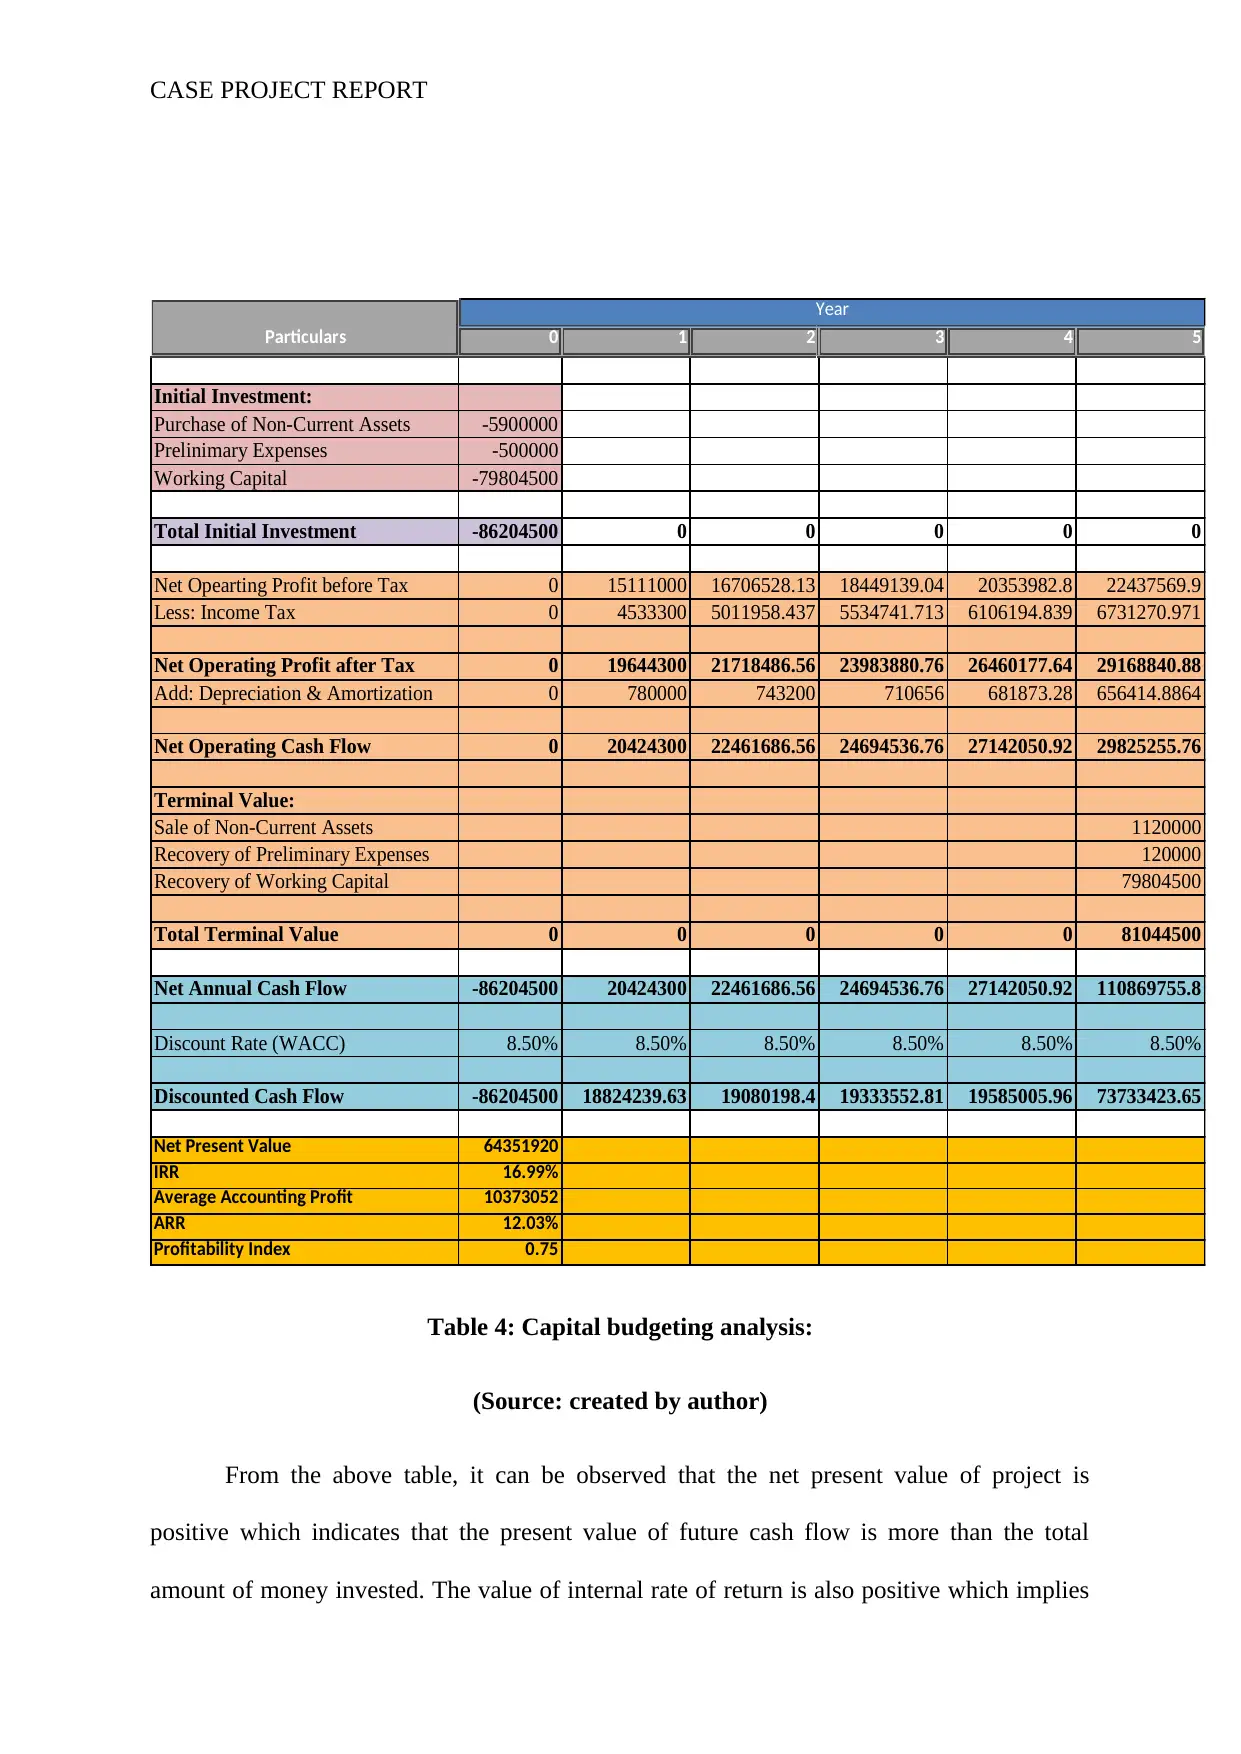
Capital budgeting technique:
5.3 Other non-financial decision making factors involved in the Case Project
Some of the non financial factors that influence decision making by the business are
as follows:
It is required by the business to strictly comply with the regulations and standard for
carrying out the business in a seamless way.
The business should adhere to all the required and necessary regulations so that the
code of conduct of doing business is ethical.
The employees of business should try to deal with the customers in an environmental
friendly manner.
The productivity of business is also influenced by the motivation of employees in the
engagement of business activities.
The structure of organization also plays an important role in conducting the operations
of business so that the employees and managers are well aware of their
responsibilities (Robinson 2016).
5.4 Selection of Best Alternative
It can be observed from the analysis of the various financial decision making tools
that carrying out the project would be feasible. This is so because the present value of cash
flow of business is positive and internal rate of return being more than the cost of capital
(Bekaert and Hodrick 2017). Therefore, it would be appropriate to start the business of smart
watch.
Capital budgeting technique:
CASE PROJECT REPORT
0 1 2 3 4 5
Initial Investment:
Purchase of Non-Current Assets -5900000
Prelinimary Expenses -500000
Working Capital -79804500
Total Initial Investment -86204500 0 0 0 0 0
Net Opearting Profit before Tax 0 15111000 16706528.13 18449139.04 20353982.8 22437569.9
Less: Income Tax 0 4533300 5011958.437 5534741.713 6106194.839 6731270.971
Net Operating Profit after Tax 0 19644300 21718486.56 23983880.76 26460177.64 29168840.88
Add: Depreciation & Amortization 0 780000 743200 710656 681873.28 656414.8864
Net Operating Cash Flow 0 20424300 22461686.56 24694536.76 27142050.92 29825255.76
Terminal Value:
Sale of Non-Current Assets 1120000
Recovery of Preliminary Expenses 120000
Recovery of Working Capital 79804500
Total Terminal Value 0 0 0 0 0 81044500
Net Annual Cash Flow -86204500 20424300 22461686.56 24694536.76 27142050.92 110869755.8
Discount Rate (WACC) 8.50% 8.50% 8.50% 8.50% 8.50% 8.50%
Discounted Cash Flow -86204500 18824239.63 19080198.4 19333552.81 19585005.96 73733423.65
Net Present Value 64351920
IRR 16.99%
Average Accounting Profit 10373052
ARR 12.03%
Profitability Index 0.75
Year
Particulars
Table 4: Capital budgeting analysis:
(Source: created by author)
From the above table, it can be observed that the net present value of project is
positive which indicates that the present value of future cash flow is more than the total
amount of money invested. The value of internal rate of return is also positive which implies
Secure Best Marks with AI Grader
Need help grading? Try our AI Grader for instant feedback on your assignments.
CASE PROJECT REPORT
that it is worthy to undertake investment. In addition to this, the accounting rate of return is
also positive along with the average accounting profit. However, the profitability index of the
project is less than one which indicates that the investment is not generating profit (Liaw et
al. 2016). Therefore, considering the total indicators, it is observed that the profit index
measure is outweighed by other measures such as accounting rate of return and net present
value.
Particulars Year 1 Year 2 Year 3 Year 4 Year 5
Selling Price per unit $3,500 $3,588 $3,677 $3,769 $3,863
Variable Expenses per unit:
Raw Material ($1,500) ($1,538) ($1,576) ($1,615) ($1,656)
Direct Labor Cost ($1,000) ($1,025) ($1,051) ($1,077) ($1,104)
Variable Manufacturing Overhead ($650) ($666) ($683) ($700) ($717)
Sales Commission ($18) ($18) ($18) ($19) ($19)
Travelling Expenses ($26) ($27) ($28) ($28) ($29)
Toatl Variable Costs per Unit ($3,194) ($3,274) ($3,355) ($3,439) ($3,525)
Contribution Margin $306 $314 $322 $330 $338
Fixed Costs:
Depreciation on Property,Plant & Equipment $2,80,000 $2,80,000 $2,80,000 $2,80,000 $2,80,000
Depreciation on Furniture & Fixtures $80,000 $72,000 $64,800 $58,320 $52,488
Depreciation on Computer Equipment $1,20,000 $1,05,600 $92,928 $81,777 $71,963
Amortization of Patent $80,000 $80,000 $80,000 $80,000 $80,000
Amortization of Trademark $1,00,000 $1,00,000 $1,00,000 $1,00,000 $1,00,000
Insurance $12,000 $12,300 $12,608 $12,923 $13,246
Rates & Taxes $6,500 $6,663 $6,829 $7,000 $7,175
Salary of Office Staffs $1,00,000 $1,02,500 $1,05,063 $1,07,689 $1,10,381
Cleaning Charges $5,000 $5,125 $5,253 $5,384 $5,519
Electricity for Office $15,000 $15,375 $15,759 $16,153 $16,557
Telephone & Internet $8,000 $8,200 $8,405 $8,615 $8,831
Interest on Bond $19,91,324 $19,91,324 $19,91,324 $19,91,324 $19,91,324
Interest on Loan From Bank $18,01,674 $18,01,674 $18,01,674 $18,01,674 $18,01,674
Depreciation on Motor Vehicle $19,91,324 $19,91,324 $19,91,324 $19,91,324 $19,91,324
Salary of Marketing Staffs $18,01,674 $18,01,674 $18,01,674 $18,01,674 $18,01,674
Total Fixed Costs $83,92,496 $83,73,759 $83,57,641 $83,43,857 $83,32,156
Break-Even in Units 27404 26676 25975 25300 24648
Break-Even in Dollars $9,59,14,240 $9,57,00,097 $9,55,15,892 $9,53,58,367 $9,52,24,640
CASE PROJECT REPORT
Table 5: Break even analysis:
(Source: created by author)
The table presenting the break even analysis of the project depicts the fixed cost and
the break even units that are required to be produced during the life time of project. It is
observed that the total break even units produced by the project is decreasing year on year
which is implication if the fact that in order to reach the breakeven point with passing years,
the total number of break even unit should be reduced. Furthermore, there is reduction in the
break even amount as the project becomes older.
5.5 Identification of key challenges and making recommendations
The stance of smart watch manufacturing company is being changed because of
changing opinion of the people on the importance of applications on smart watches. Keeping
the interactions discreet is one of the biggest changes that would be faced by smart watch
producing companies from both software and design perspectives. Therefore, the companies
should design the product by taking into account the ongoing market trend. Business might
also face the risk of increasing cost in terms of increasing cyber attacks. In addition to this,
the frequent changing of trend holds buyers from buying the products which results in falling
sales of the product (Doorley and Garcia 2015). Therefore, it is required by TechSmart to
deal with all such challenges in a tactful manner to penetrate the electronic market of
Australia.
Since, the cost of labor is high because of crunch of labor; therefore, it is
recommended that the business should develop some strategy that would help in minimizing
their cost of production. For entering into the consumer electronic industry with some
dominant players such as Windows and Apple, it is required by TechSmart to adopt some
appropriate pricing strategy to penetrate the market. The best would be to keep their price low
CASE PROJECT REPORT
in order to penetrate the market and increasing the price thereafter once the market share has
been gained.
It has been observed from the analysis of the market of Australia that there is an
ongoing trend of business entering into an online platform. Therefore, it is recommended to
TechSmart to use the online platform for expanding their business as it will enable them to
reap various benefits.
6. Conclusion
The paper discussed the evaluation of feasibility of project by using several financial
tools such as capital budgeting techniques, sensitivity analysis, computation of various
measures of profitability. Research conducted on the economic scenario of Australi and how
the electronic busies are getting impacted, it has been ascertained that there are few factors
that would push up to undertake such business along with some challenge that the business
would face such as higher labor cost and employing technical experts which would raise the
cost and lower the profit ultimately. It has been found from the analysis that the TechSmart
limited would generate positive net present value which indicates that the project is feasible
to be undertaken. Nevertheless, the changing technological trend has generated an increase in
the demand for such electronic products which implies positive scenario for doing such
business.
Paraphrase This Document
Need a fresh take? Get an instant paraphrase of this document with our AI Paraphraser
CASE PROJECT REPORT
References and Bibliography list:
Alismaili, S., Li, M., Shen, J. and He, Q., 2016. A multi perspective approach for
understanding the determinants of cloud computing adoption among Australian SMEs. arXiv
preprint arXiv:1606.00745.
Andersen, L., Ashton, P. and Colley, L., 2015. Creative Business in Australia Learnings from
the Creative Industries Innovation Centre, 2009 to 2015.
Antonius, N., Xu, J. and Gao, X., 2015. Factors influencing the adoption of enterprise social
software in Australia. Knowledge-Based Systems, 73, pp.32-43.
Barr, M.J. and McClellan, G.S., 2018. Budgets and financial management in higher
education. John Wiley & Sons.
Bekaert, G. and Hodrick, R., 2017. International financial management. Cambridge
University Press.
Broadhurst, R., 2017. Cybercrime in Australia. In The Palgrave Handbook of Australian and
New Zealand Criminology, Crime and Justice (pp. 221-235). Palgrave Macmillan, Cham.
Bruce, T., Zuo, J., Rameezdeen, R. and Pullen, S., 2015. Factors influencing the retrofitting
of existing office buildings using Adelaide, South Australia as a case study. Structural
Survey, 33(2), pp.150-166.
Cao, L., Hosking, A., Kouparitsas, M., Mullaly, D., Rimmer, X., Shi, Q., Stark, W. and
Wende, S., 2015. Understanding the economy-wide efficiency and incidence of major
Australian taxes. Treasury.
Chiou, K.C., Lo, M.M. and Wu, G.W., 2017, November. The minimizing prediction error on
corporate financial distress forecasting model: An application of dynamic distress threshold
CASE PROJECT REPORT
value. In 2017 IEEE 8th International Conference on Awareness Science and Technology
(iCAST) (pp. 514-517). IEEE.
Doorley, J. and Garcia, H.F., 2015. Reputation management: The key to successful public
relations and corporate communication. Routledge.
Frynas, J.G. and Mellahi, K., 2015. Global strategic management. Oxford University Press,
USA.
Gaol, F.L., Filimonova, N. and Maslennikov, V. eds., 2018. Financial and Economic Tools
Used in the World Hospitality Industry: Proceedings of the 5th International Conference on
Management and Technology in Knowledge, Service, Tourism & Hospitality 2017 (SERVE
2017), 21-22 October 2017 & 30 November 2017, Bali, Indonesia & Moscow, Russia. CRC
Press.
Giang, W.C., Shanti, I., Chen, H.Y.W., Zhou, A. and Donmez, B., 2015, September.
Smartwatches vs. smartphones: a preliminary report of driver behavior and perceived risk
while responding to notifications. In Proceedings of the 7th international conference on
automotive user interfaces and interactive vehicular applications (pp. 154-161). ACM.
Hatfield-Dodds, S., Schandl, H., Adams, P.D., Baynes, T.M., Brinsmead, T.S., Bryan, B.A.,
Chiew, F.H., Graham, P.W., Grundy, M., Harwood, T. and McCallum, R., 2015. Australia is
‘free to choose’economic growth and falling environmental pressures. Nature, 527(7576),
p.49.
Hitt, M.A., Ireland, R.D. and Hoskisson, R.E., 2016. Strategic management: Concepts and
cases: Competitiveness and globalization. Cengage Learning.
Karadag, H., 2015. Financial management challenges in small and medium-sized enterprises:
A strategic management approach. EMAJ: Emerging Markets Journal, 5(1), pp.26-40.
CASE PROJECT REPORT
Kidwell, D.S., Blackwell, D.W., Sias, R.W. and Whidbee, D.A., 2016. Financial institutions,
markets, and money. John Wiley & Sons.
Knight, E. and Wójcik, D., 2017. Geographical linkages in the financial services industry: a
dialogue with organizational studies. Regional Studies, 51(1), pp.116-127.
Kudrna, G., Tran, C. and Woodland, A., 2015. The dynamic fiscal effects of demographic
shift: The case of Australia. Economic Modelling, 50, pp.105-122.
Li, C.A., Lin, T.M. and Huang, Y.W., 2018. Managerial Overconfidence, Compensation
Induced Risk Taking, and Earnings Management. The International Journal of Business and
Finance Research, 12(2), pp.1-26.
Liaw, S.T., Powell-Davies, G., Pearce, C., Britt, H., McGlynn, L. and Harris, M.F., 2016.
Optimising the use of observational electronic health record data: Current issues, evolving
opportunities, strategies and scope for collaboration. Australian family physician, 45(3),
p.153.
Lin, Y.H. and Tseng, M.L., 2016. Assessing the competitive priorities within sustainable
supply chain management under uncertainty. Journal of cleaner production, 112, pp.2133-
2144.
Manalo, J., Perera, D. and Rees, D.M., 2015. Exchange rate movements and the Australian
economy. Economic Modelling, 47, pp.53-62.
Masadeh, W., Khasawneh, A.Y. and AL Salamat, W., 2018. Working Capital Variations by
Industry and Implications for Profitable Financial Management. The International Journal of
Business and Finance Research, 12(1).
Mazouni, M., 2018. Strategic Financial Management Global Technology-Case Study. Int J
Econ Manag Sci, 7(538), p.2.
Secure Best Marks with AI Grader
Need help grading? Try our AI Grader for instant feedback on your assignments.
CASE PROJECT REPORT
Oh, E., Kim, T.S. and Cho, T.H., 2016, August. Development of Information Security
Management Assessment Model for the Financial Sector. In International Workshop on
Information Security Applications (pp. 186-197). Springer, Cham.
Panou, K., 2015. Assessing financial viability of the freemium model for supply chain service
value networks: a case study of the container management service industry. International
Journal of Integrated Supply Management, 9(3), pp.137-177.
Pollin, R.E., Downey Jr, B.E. and Fleming, S.A., Autoscribe Corp, 2017. System and method
for registering financial accounts. U.S. Patent Application 15/408,185.
Pushkar, D.I. and Dragunova, E.V., 2016, October. Financial analysis as a tool for company
strategy developing. In 2016 13th International Scientific-Technical Conference on Actual
Problems of Electronics Instrument Engineering (APEIE) (Vol. 3, pp. 279-283). IEEE.
Raghunathan, B. and Maiya, R., 2017. SMACing the Bank: How to Use Social Media,
Mobility, Analytics and Cloud Technologies to Transform the Business Processes of Banks
and the Banking Experience. CRC Press.
Rees, D.M., Smith, P. and Hall, J., 2016. A Multi‐sector Model of the Australian
Economy. Economic Record, 92(298), pp.374-408.
Robinson, P.W., 2016, May. Regulatory compliance mark: For Australia/New Zealand
electrical and electronic equipment. In 2016 IEEE Symposium on Product Compliance
Engineering (ISPCE) (pp. 1-27). IEEE.
Singh, M. and Arora, C.A.P.S., 2017. Perspective and Growth of Cyber Insurance. World
Journal of Research and Review, 4(6).
CASE PROJECT REPORT
Tamm, T., Seddon, P.B., Shanks, G., Reynolds, P. and Frampton, K.M., 2015. How an
Australian Retailer Enabled Business Transformation Through Enterprise Architecture. MIS
Quarterly Executive, 14(4).
Tseng, K.A., Lin, C.I. and Yen, S.W., 2015. Contingencies of intellectual capitals and
financial capital on value creation: Moderation of business cycles. Journal of Intellectual
Capital, 16(1), pp.156-173.
Turban, E., Outland, J., King, D., Lee, J.K., Liang, T.P. and Turban, D.C., 2017. Electronic
commerce 2018: a managerial and social networks perspective. Springer.
Weber, B., Alfen, H.W. and Staub-Bisang, M., 2016. Infrastructure as an asset class:
investment strategy, sustainability, project finance and PPP. John wiley & sons.
Wendel, S., 2016. Behavioral Nudges and Consumer Technology. In Nudge Theory in
Action (pp. 95-123). Palgrave Macmillan, Cham.
Yin, S. and Kaynak, O., 2015. Big data for modern industry: challenges and trends [point of
view]. Proceedings of the IEEE, 103(2), pp.143-146.
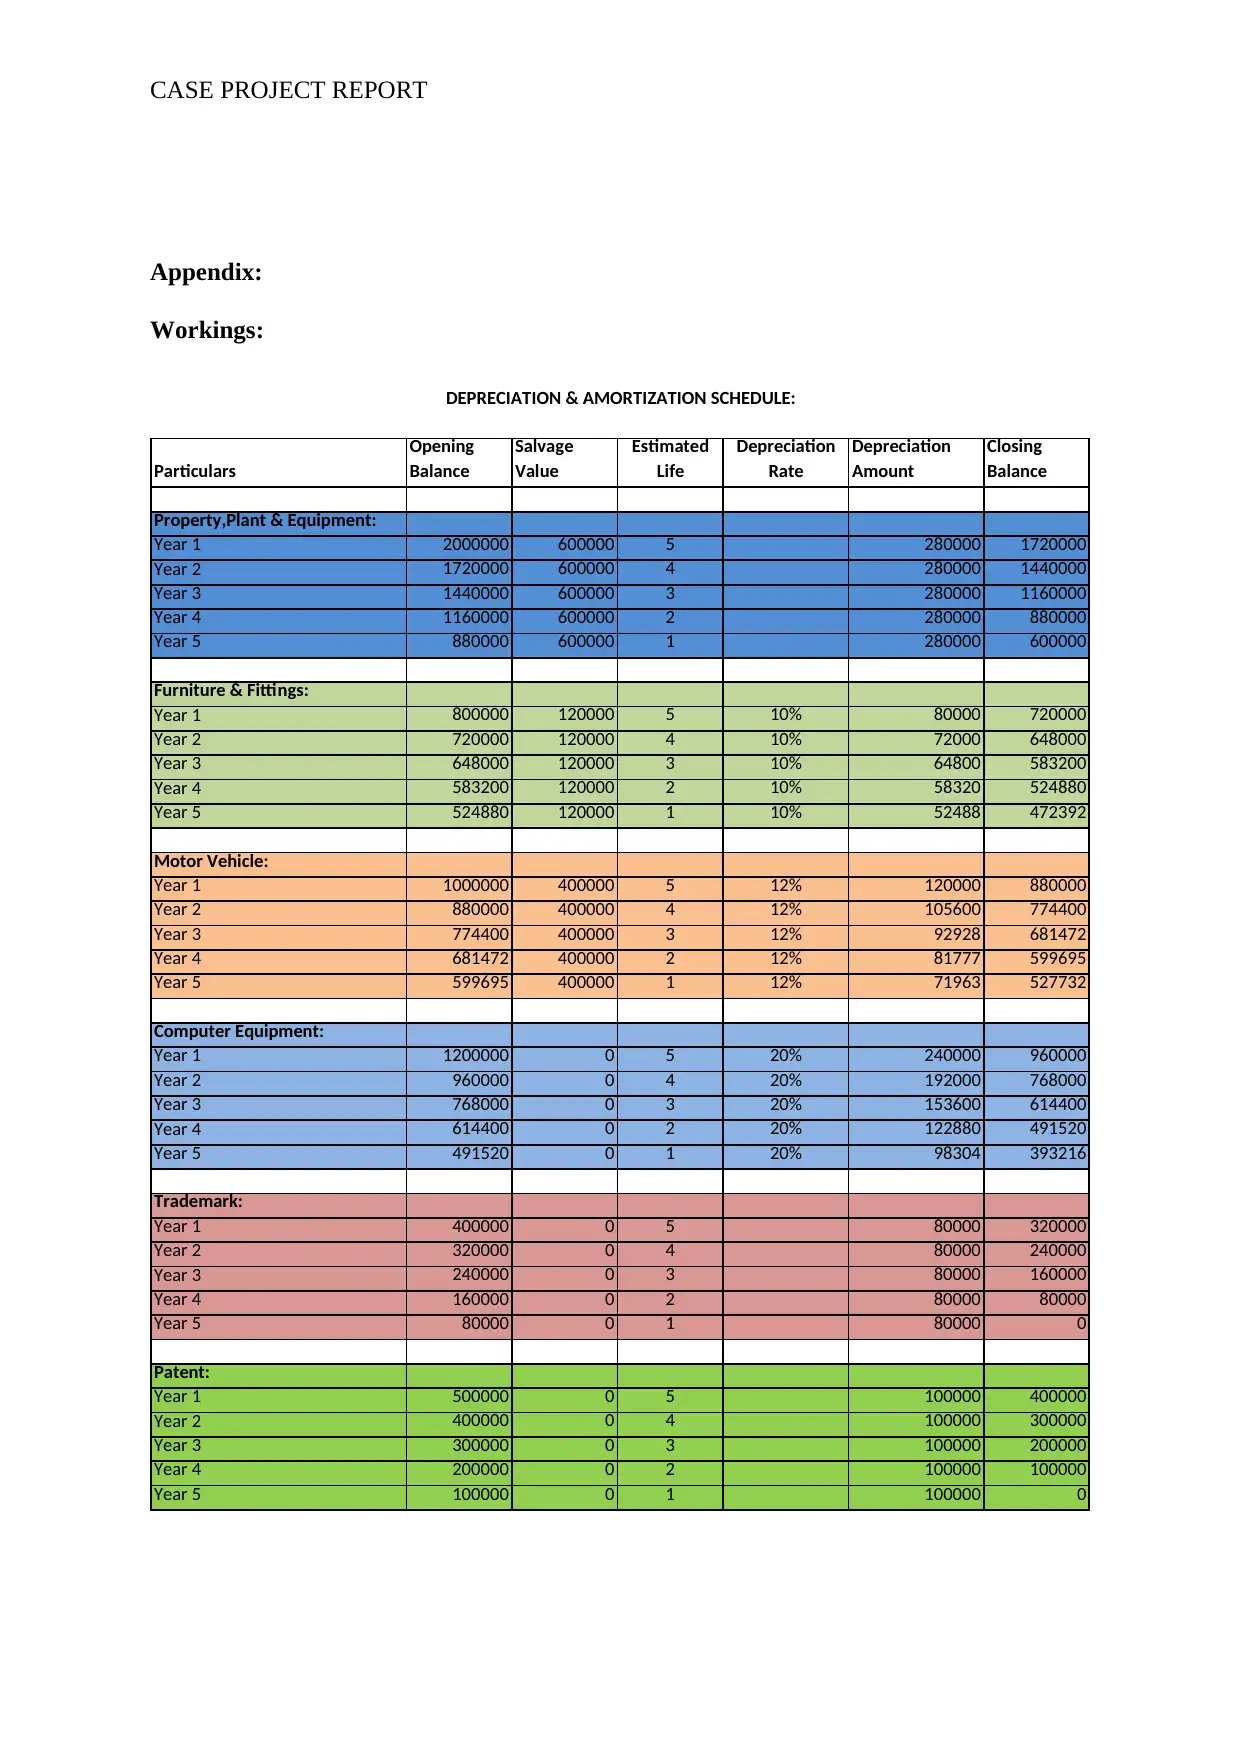
CASE PROJECT REPORT
Appendix:
Workings:
Particulars
Opening
Balance
Salvage
Value
Estimated
Life
Depreciation
Rate
Depreciation
Amount
Closing
Balance
Property,Plant & Equipment:
Year 1 2000000 600000 5 280000 1720000
Year 2 1720000 600000 4 280000 1440000
Year 3 1440000 600000 3 280000 1160000
Year 4 1160000 600000 2 280000 880000
Year 5 880000 600000 1 280000 600000
Furniture & Fittings:
Year 1 800000 120000 5 10% 80000 720000
Year 2 720000 120000 4 10% 72000 648000
Year 3 648000 120000 3 10% 64800 583200
Year 4 583200 120000 2 10% 58320 524880
Year 5 524880 120000 1 10% 52488 472392
Motor Vehicle:
Year 1 1000000 400000 5 12% 120000 880000
Year 2 880000 400000 4 12% 105600 774400
Year 3 774400 400000 3 12% 92928 681472
Year 4 681472 400000 2 12% 81777 599695
Year 5 599695 400000 1 12% 71963 527732
Computer Equipment:
Year 1 1200000 0 5 20% 240000 960000
Year 2 960000 0 4 20% 192000 768000
Year 3 768000 0 3 20% 153600 614400
Year 4 614400 0 2 20% 122880 491520
Year 5 491520 0 1 20% 98304 393216
Trademark:
Year 1 400000 0 5 80000 320000
Year 2 320000 0 4 80000 240000
Year 3 240000 0 3 80000 160000
Year 4 160000 0 2 80000 80000
Year 5 80000 0 1 80000 0
Patent:
Year 1 500000 0 5 100000 400000
Year 2 400000 0 4 100000 300000
Year 3 300000 0 3 100000 200000
Year 4 200000 0 2 100000 100000
Year 5 100000 0 1 100000 0
DEPRECIATION & AMORTIZATION SCHEDULE:
Paraphrase This Document
Need a fresh take? Get an instant paraphrase of this document with our AI Paraphraser
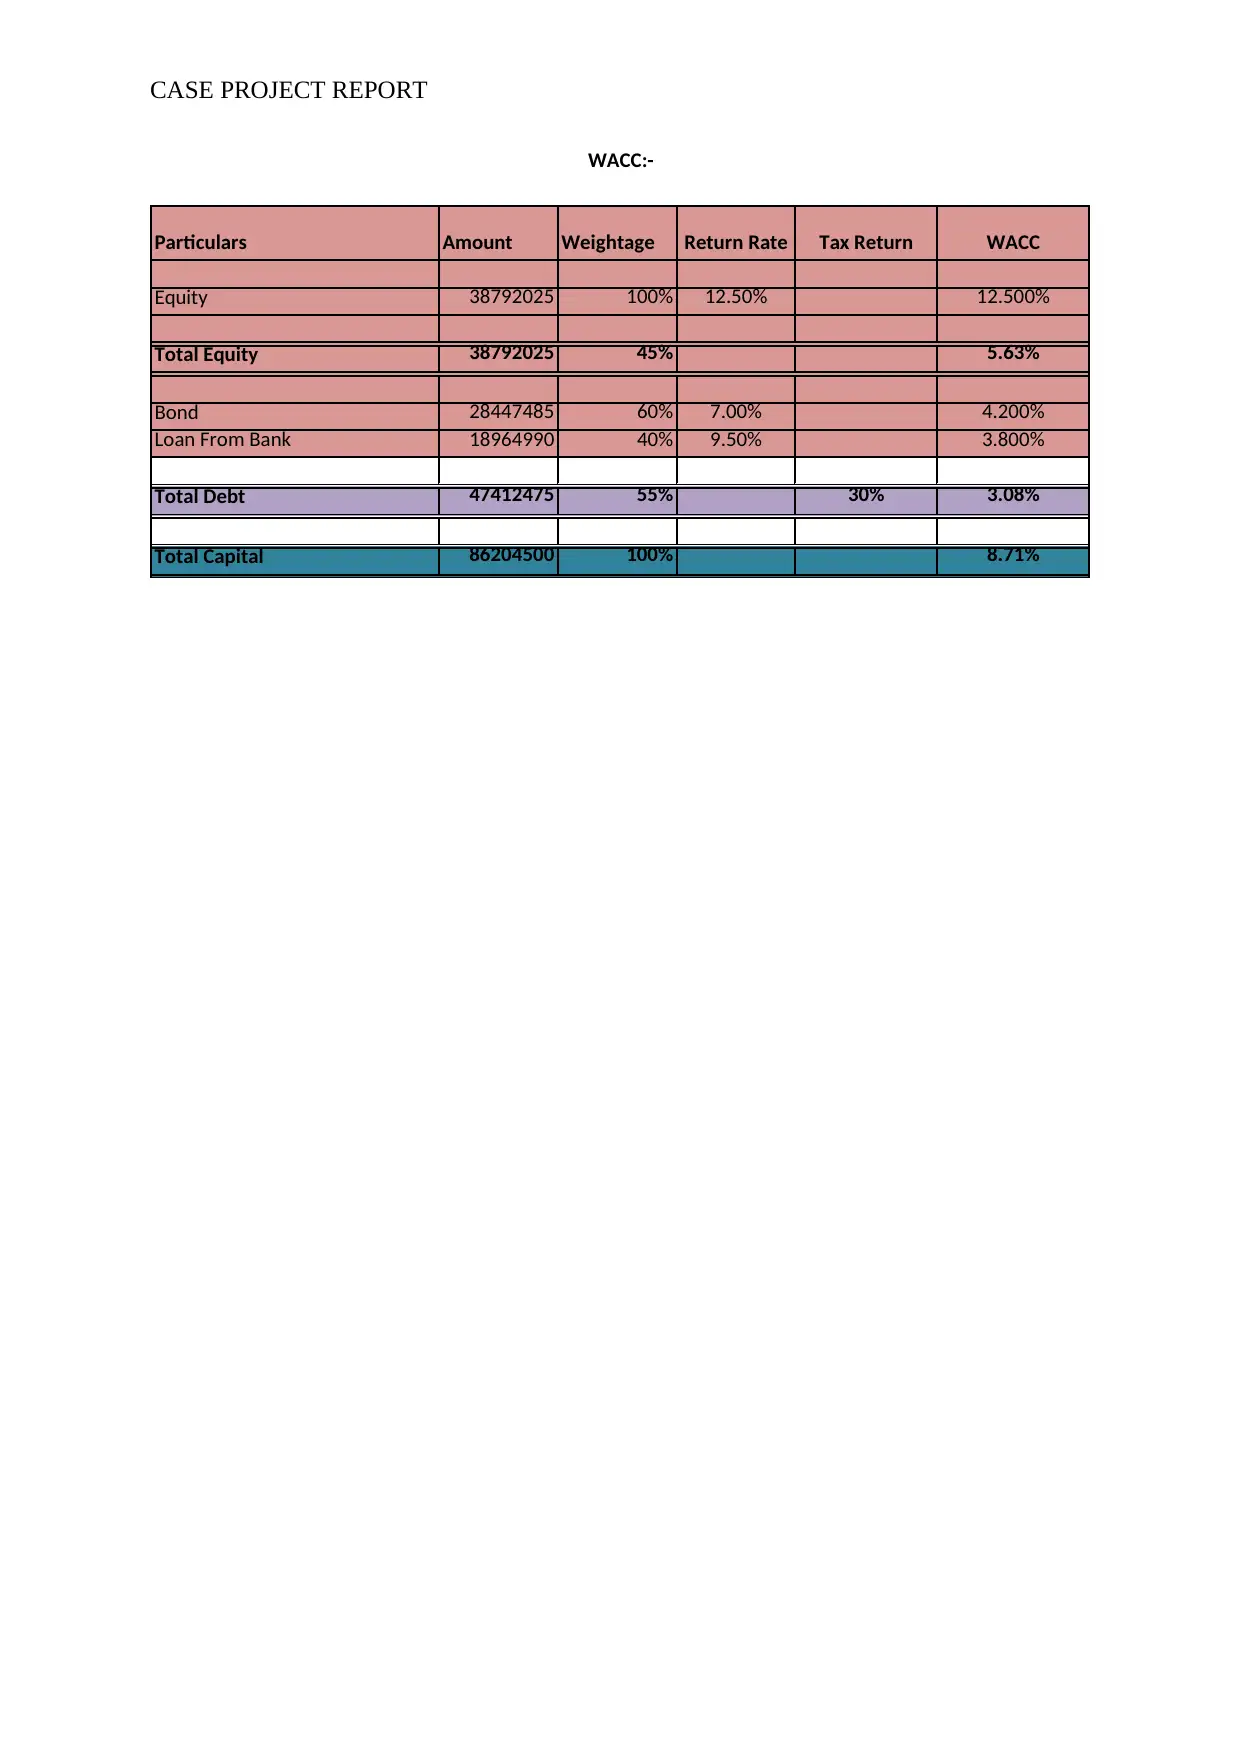
CASE PROJECT REPORT
Particulars Amount Weightage Return Rate Tax Return WACC
Equity 38792025 100% 12.50% 12.500%
Total Equity 38792025 45% 5.63%
Bond 28447485 60% 7.00% 4.200%
Loan From Bank 18964990 40% 9.50% 3.800%
Total Debt 47412475 55% 30% 3.08%
Total Capital 86204500 100% 8.71%
WACC:-
Particulars Amount Weightage Return Rate Tax Return WACC
Equity 38792025 100% 12.50% 12.500%
Total Equity 38792025 45% 5.63%
Bond 28447485 60% 7.00% 4.200%
Loan From Bank 18964990 40% 9.50% 3.800%
Total Debt 47412475 55% 30% 3.08%
Total Capital 86204500 100% 8.71%
WACC:-
1 out of 32
Related Documents


Your All-in-One AI-Powered Toolkit for Academic Success.
+13062052269
info@desklib.com
Available 24*7 on WhatsApp / Email
![[object Object]](/_next/static/media/star-bottom.7253800d.svg)
Unlock your academic potential
© 2024 | Zucol Services PVT LTD | All rights reserved.