Case Study on Investment Appraisal and Business Performance Analysis
VerifiedAdded on 2023/01/11
|10
|2153
|30
Case Study
AI Summary
This case study analyzes investment appraisal techniques, including Accounting Rate of Return (ARR), Net Present Value (NPV), Internal Rate of Return (IRR), and Payback Period, to evaluate the viability of a project. The analysis reveals that the ARR is 40%, the NPV is negative (-1998.4), and the IRR is 10%. The payback period is calculated at 4 years and 1 month. Furthermore, the study examines the performance of a business using various financial ratios, such as the current ratio, quick ratio, debt-equity ratio, interest coverage ratio, net profit margin, stock turnover ratio, debtors turnover ratio, and creditors turnover ratio, providing insights into the company's liquidity, solvency, and efficiency. Finally, the case study explores the importance of Key Performance Indicators (KPIs), both internal and external, in tracking and evaluating business performance, and discusses the role of pricing in influencing profitability and market share.

Case study
Paraphrase This Document
Need a fresh take? Get an instant paraphrase of this document with our AI Paraphraser
TABLE OF CONTENT
Case study..................................................................................................................................3
TASK 1......................................................................................................................................3
Computing investment appraisal............................................................................................3
TASK 2......................................................................................................................................6
Analysing performance of business.......................................................................................6
TASK 3......................................................................................................................................8
Analysing & comparing internal and the external performance measures and pricing role
on performance of business....................................................................................................8
REFERENCES.........................................................................................................................10
Case study
TASK 1
Computing investment appraisal
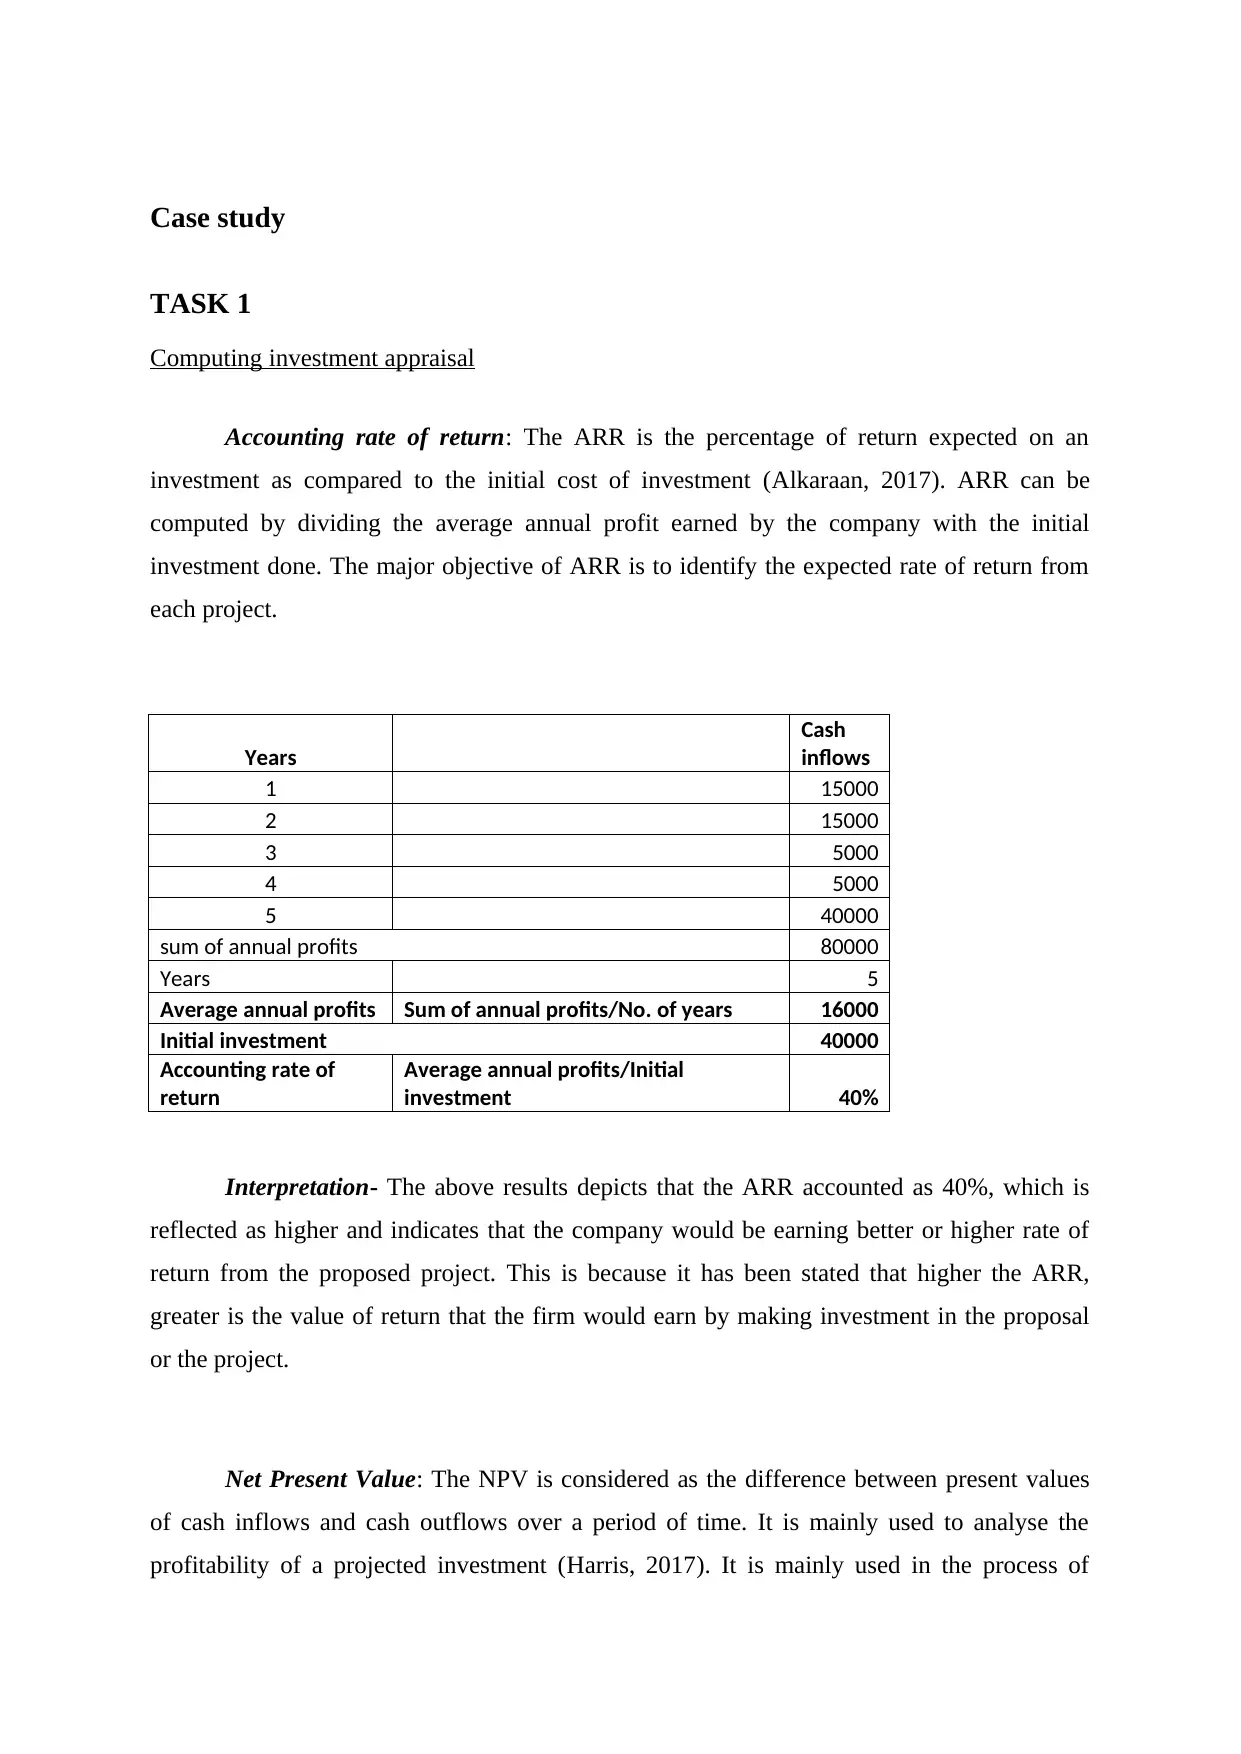
Accounting rate of return: The ARR is the percentage of return expected on an
investment as compared to the initial cost of investment (Alkaraan, 2017). ARR can be
computed by dividing the average annual profit earned by the company with the initial
investment done. The major objective of ARR is to identify the expected rate of return from
each project.
Years
Cash
inflows
1 15000
2 15000
3 5000
4 5000
5 40000
sum of annual profits 80000
Years 5
Average annual profits Sum of annual profits/No. of years 16000
Initial investment 40000
Accounting rate of
return
Average annual profits/Initial
investment 40%
Interpretation- The above results depicts that the ARR accounted as 40%, which is
reflected as higher and indicates that the company would be earning better or higher rate of
return from the proposed project. This is because it has been stated that higher the ARR,
greater is the value of return that the firm would earn by making investment in the proposal
or the project.
Net Present Value: The NPV is considered as the difference between present values
of cash inflows and cash outflows over a period of time. It is mainly used to analyse the
profitability of a projected investment (Harris, 2017). It is mainly used in the process of
TASK 1
Computing investment appraisal
Accounting rate of return: The ARR is the percentage of return expected on an
investment as compared to the initial cost of investment (Alkaraan, 2017). ARR can be
computed by dividing the average annual profit earned by the company with the initial
investment done. The major objective of ARR is to identify the expected rate of return from
each project.
Years
Cash
inflows
1 15000
2 15000
3 5000
4 5000
5 40000
sum of annual profits 80000
Years 5
Average annual profits Sum of annual profits/No. of years 16000
Initial investment 40000
Accounting rate of
return
Average annual profits/Initial
investment 40%
Interpretation- The above results depicts that the ARR accounted as 40%, which is
reflected as higher and indicates that the company would be earning better or higher rate of
return from the proposed project. This is because it has been stated that higher the ARR,
greater is the value of return that the firm would earn by making investment in the proposal
or the project.
Net Present Value: The NPV is considered as the difference between present values
of cash inflows and cash outflows over a period of time. It is mainly used to analyse the
profitability of a projected investment (Harris, 2017). It is mainly used in the process of
⊘ This is a preview!⊘
Do you want full access?
Subscribe today to unlock all pages.
Trusted by 1+ million students worldwide
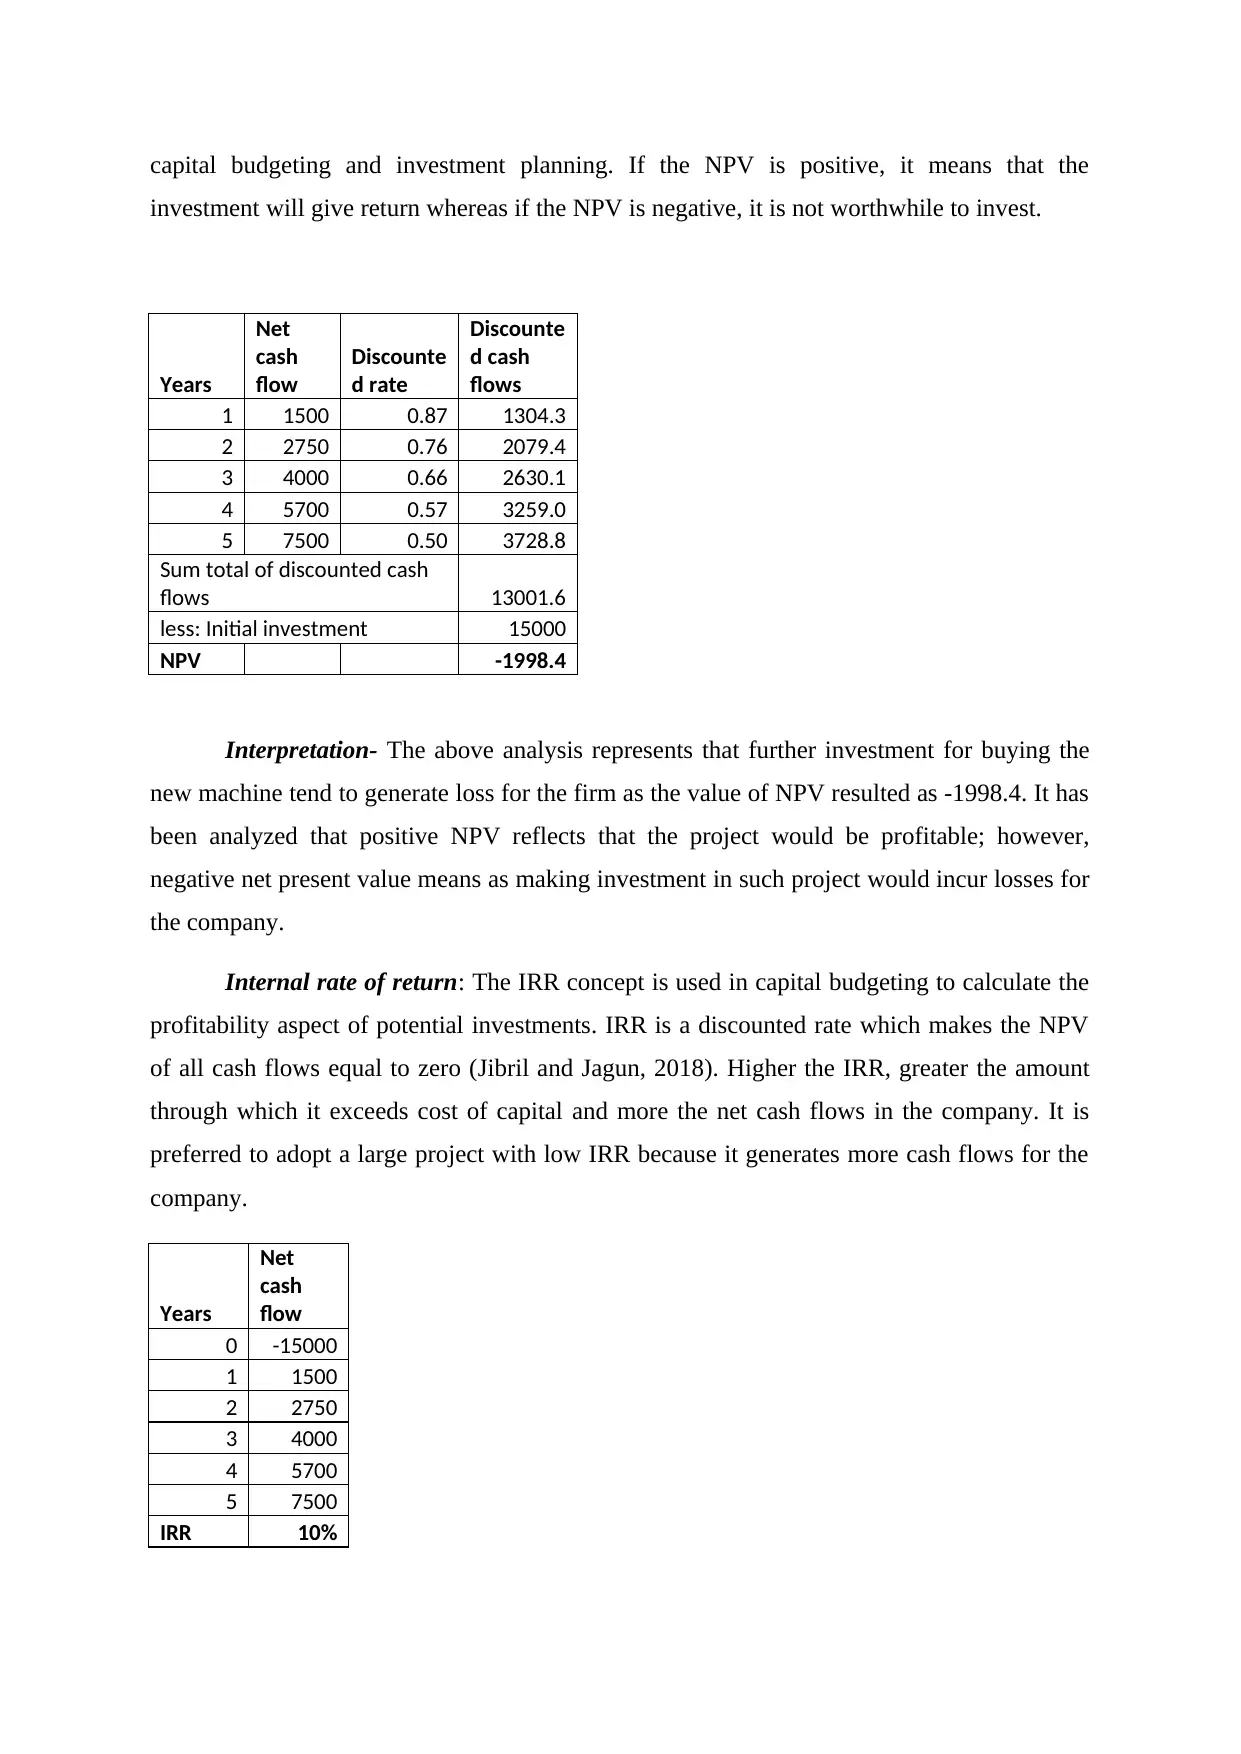
capital budgeting and investment planning. If the NPV is positive, it means that the
investment will give return whereas if the NPV is negative, it is not worthwhile to invest.
Years
Net
cash
flow
Discounte
d rate
Discounte
d cash
flows
1 1500 0.87 1304.3
2 2750 0.76 2079.4
3 4000 0.66 2630.1
4 5700 0.57 3259.0
5 7500 0.50 3728.8
Sum total of discounted cash
flows 13001.6
less: Initial investment 15000
NPV -1998.4
Interpretation- The above analysis represents that further investment for buying the
new machine tend to generate loss for the firm as the value of NPV resulted as -1998.4. It has
been analyzed that positive NPV reflects that the project would be profitable; however,
negative net present value means as making investment in such project would incur losses for
the company.
Internal rate of return: The IRR concept is used in capital budgeting to calculate the
profitability aspect of potential investments. IRR is a discounted rate which makes the NPV
of all cash flows equal to zero (Jibril and Jagun, 2018). Higher the IRR, greater the amount
through which it exceeds cost of capital and more the net cash flows in the company. It is
preferred to adopt a large project with low IRR because it generates more cash flows for the
company.
Years
Net
cash
flow
0 -15000
1 1500
2 2750
3 4000
4 5700
5 7500
IRR 10%
Paraphrase This Document
Need a fresh take? Get an instant paraphrase of this document with our AI Paraphraser
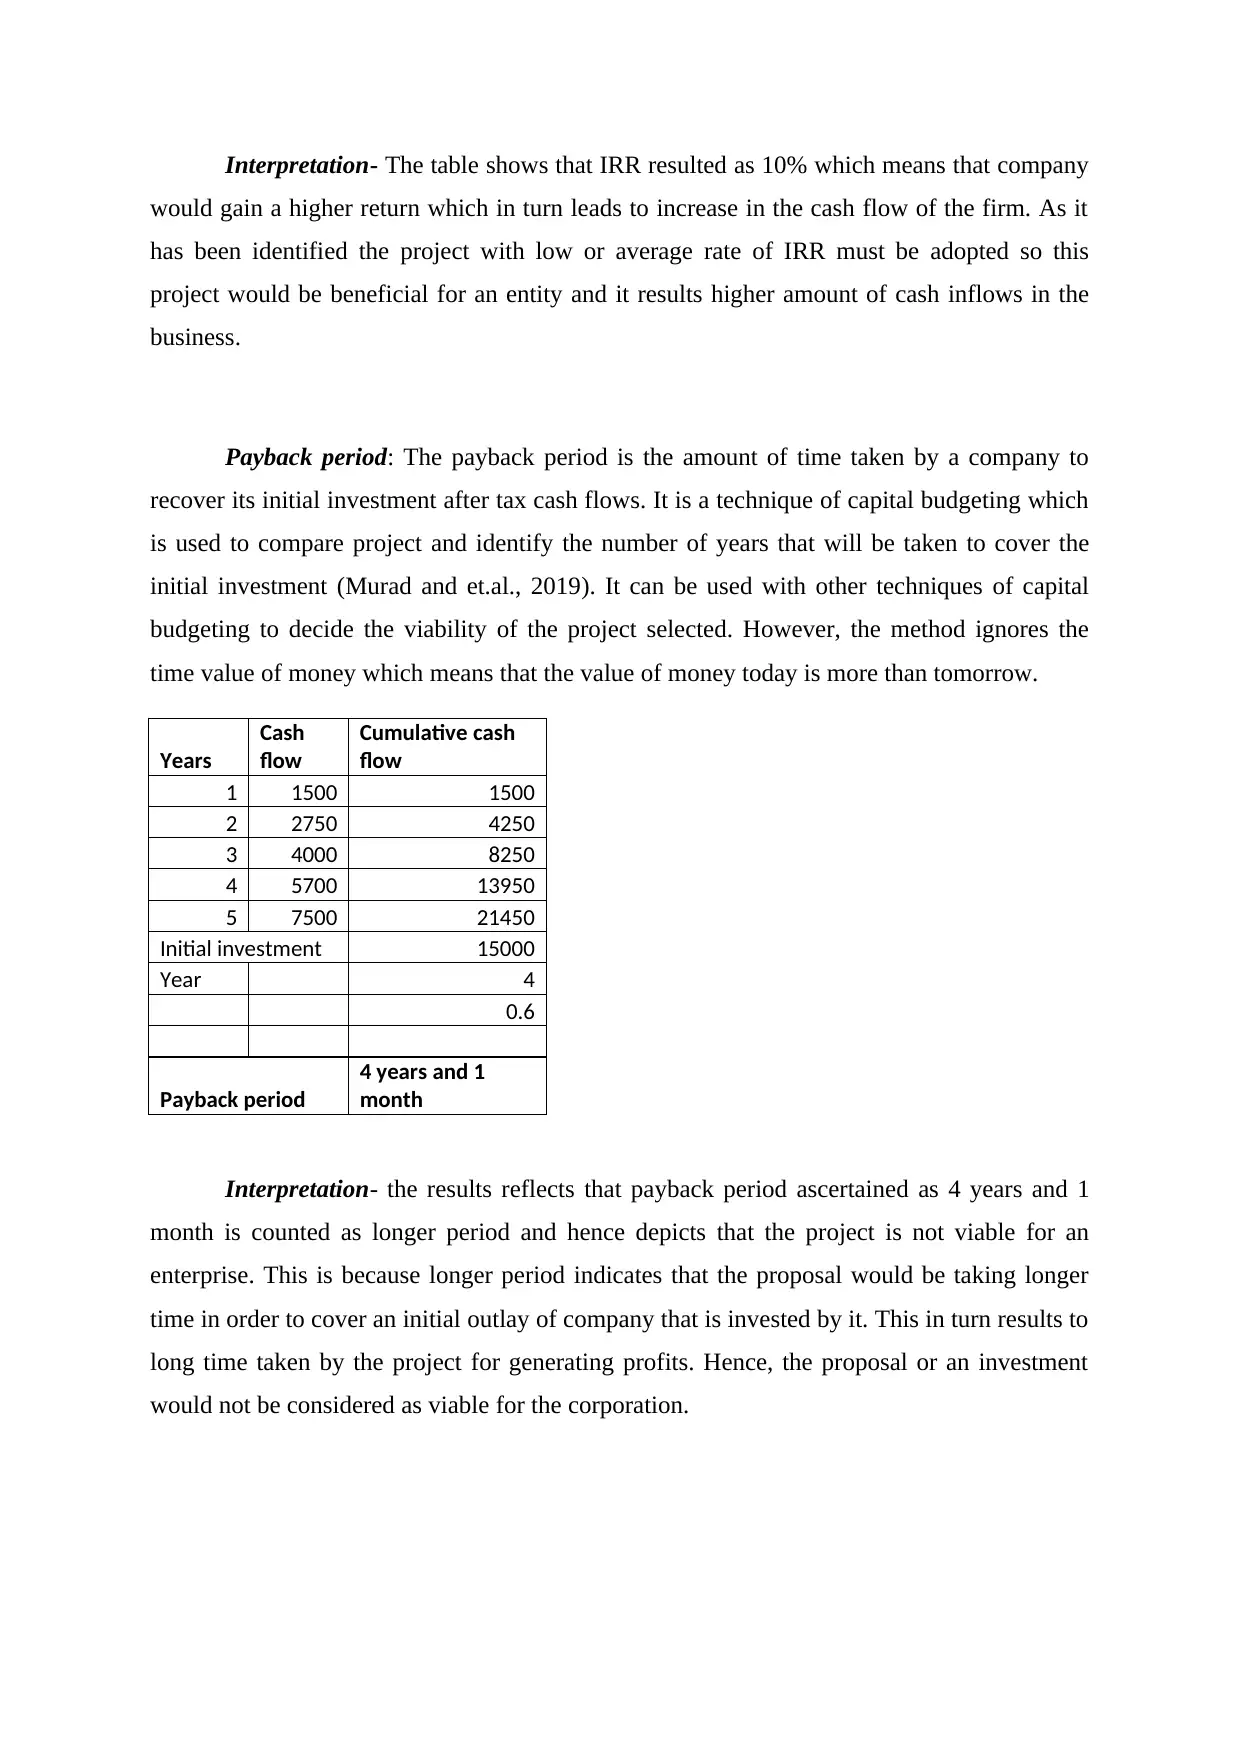
Interpretation- The table shows that IRR resulted as 10% which means that company
would gain a higher return which in turn leads to increase in the cash flow of the firm. As it
has been identified the project with low or average rate of IRR must be adopted so this
project would be beneficial for an entity and it results higher amount of cash inflows in the
business.
Payback period: The payback period is the amount of time taken by a company to
recover its initial investment after tax cash flows. It is a technique of capital budgeting which
is used to compare project and identify the number of years that will be taken to cover the
initial investment (Murad and et.al., 2019). It can be used with other techniques of capital
budgeting to decide the viability of the project selected. However, the method ignores the
time value of money which means that the value of money today is more than tomorrow.
Years
Cash
flow
Cumulative cash
flow
1 1500 1500
2 2750 4250
3 4000 8250
4 5700 13950
5 7500 21450
Initial investment 15000
Year 4
0.6
Payback period
4 years and 1
month
Interpretation- the results reflects that payback period ascertained as 4 years and 1
month is counted as longer period and hence depicts that the project is not viable for an
enterprise. This is because longer period indicates that the proposal would be taking longer
time in order to cover an initial outlay of company that is invested by it. This in turn results to
long time taken by the project for generating profits. Hence, the proposal or an investment
would not be considered as viable for the corporation.
TASK 2
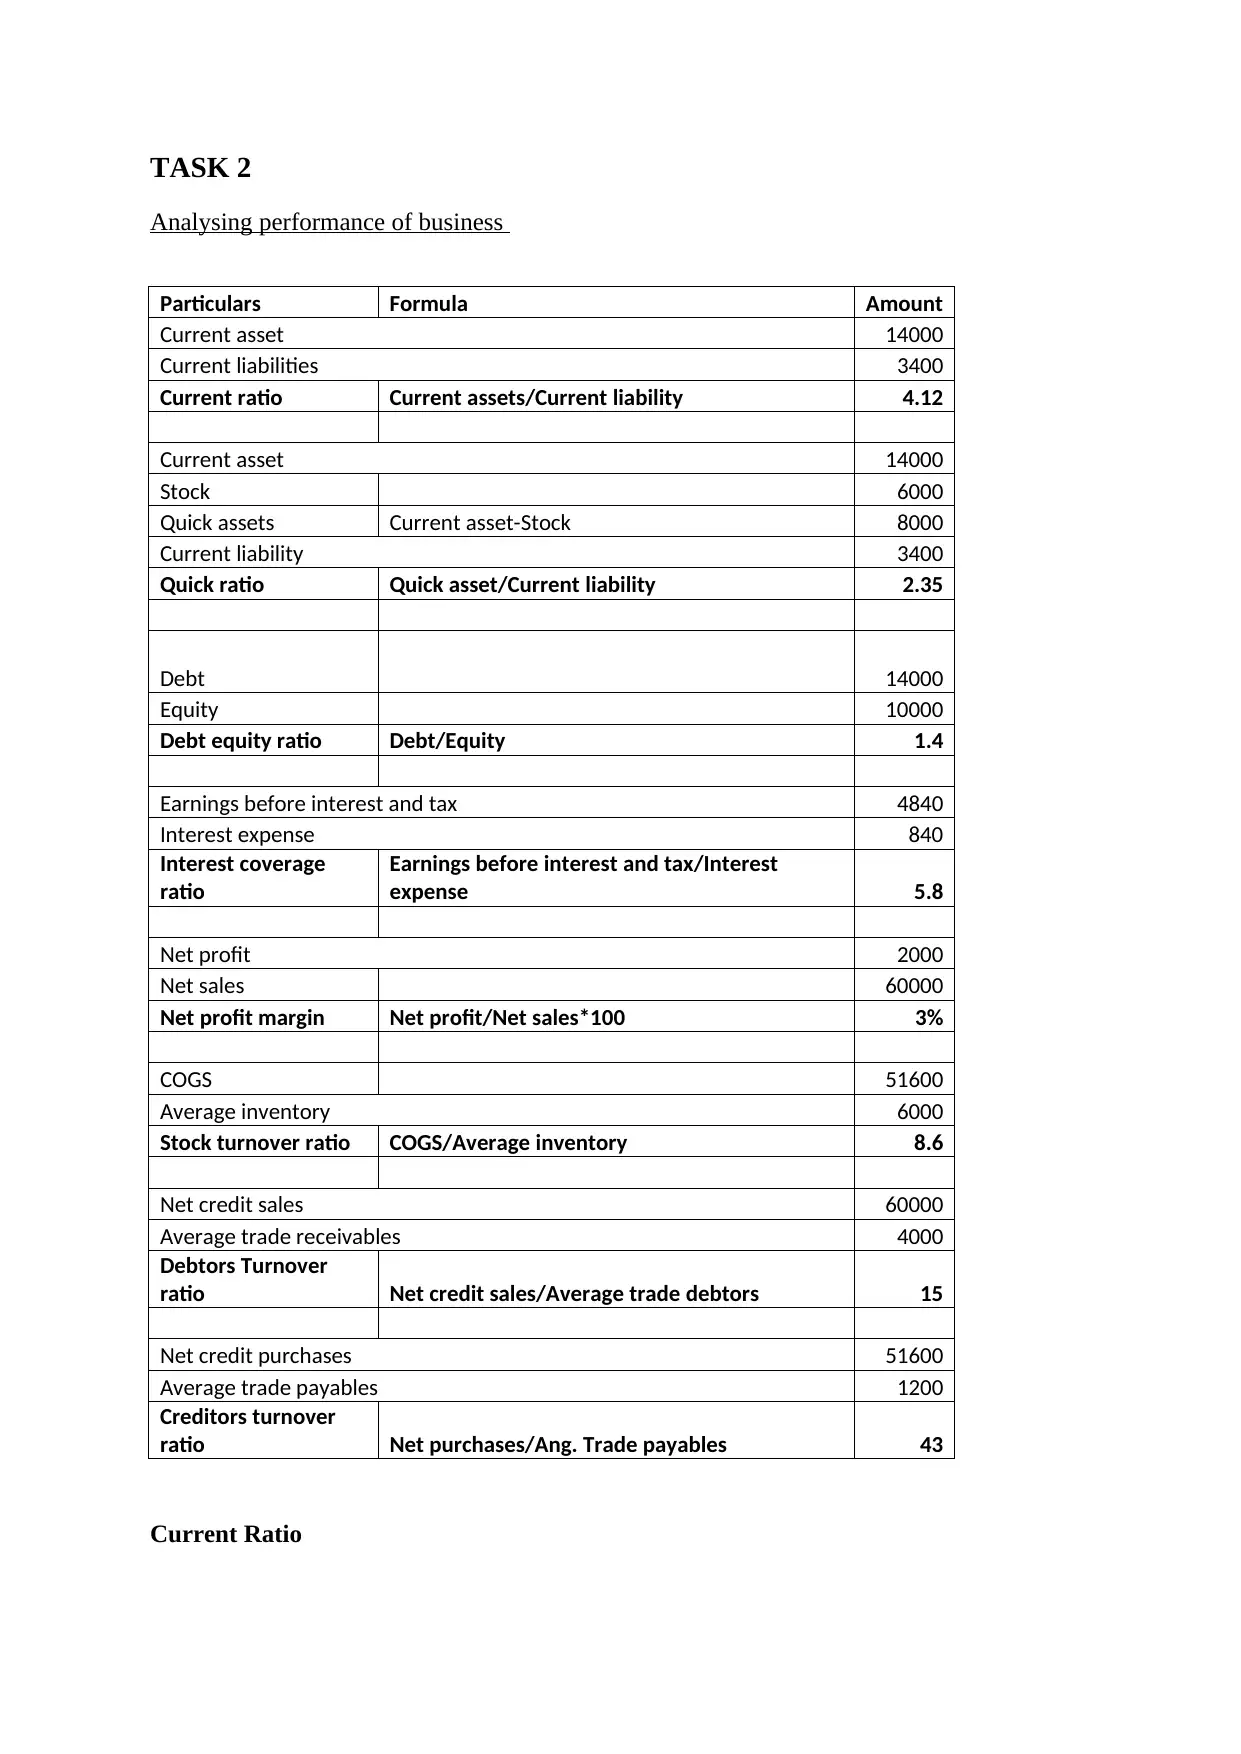
Analysing performance of business
Particulars Formula Amount
Current asset 14000
Current liabilities 3400
Current ratio Current assets/Current liability 4.12
Current asset 14000
Stock 6000
Quick assets Current asset-Stock 8000
Current liability 3400
Quick ratio Quick asset/Current liability 2.35
Debt 14000
Equity 10000
Debt equity ratio Debt/Equity 1.4
Earnings before interest and tax 4840
Interest expense 840
Interest coverage
ratio
Earnings before interest and tax/Interest
expense 5.8
Net profit 2000
Net sales 60000
Net profit margin Net profit/Net sales*100 3%
COGS 51600
Average inventory 6000
Stock turnover ratio COGS/Average inventory 8.6
Net credit sales 60000
Average trade receivables 4000
Debtors Turnover
ratio Net credit sales/Average trade debtors 15
Net credit purchases 51600
Average trade payables 1200
Creditors turnover
ratio Net purchases/Ang. Trade payables 43
Current Ratio
⊘ This is a preview!⊘
Do you want full access?
Subscribe today to unlock all pages.
Trusted by 1+ million students worldwide
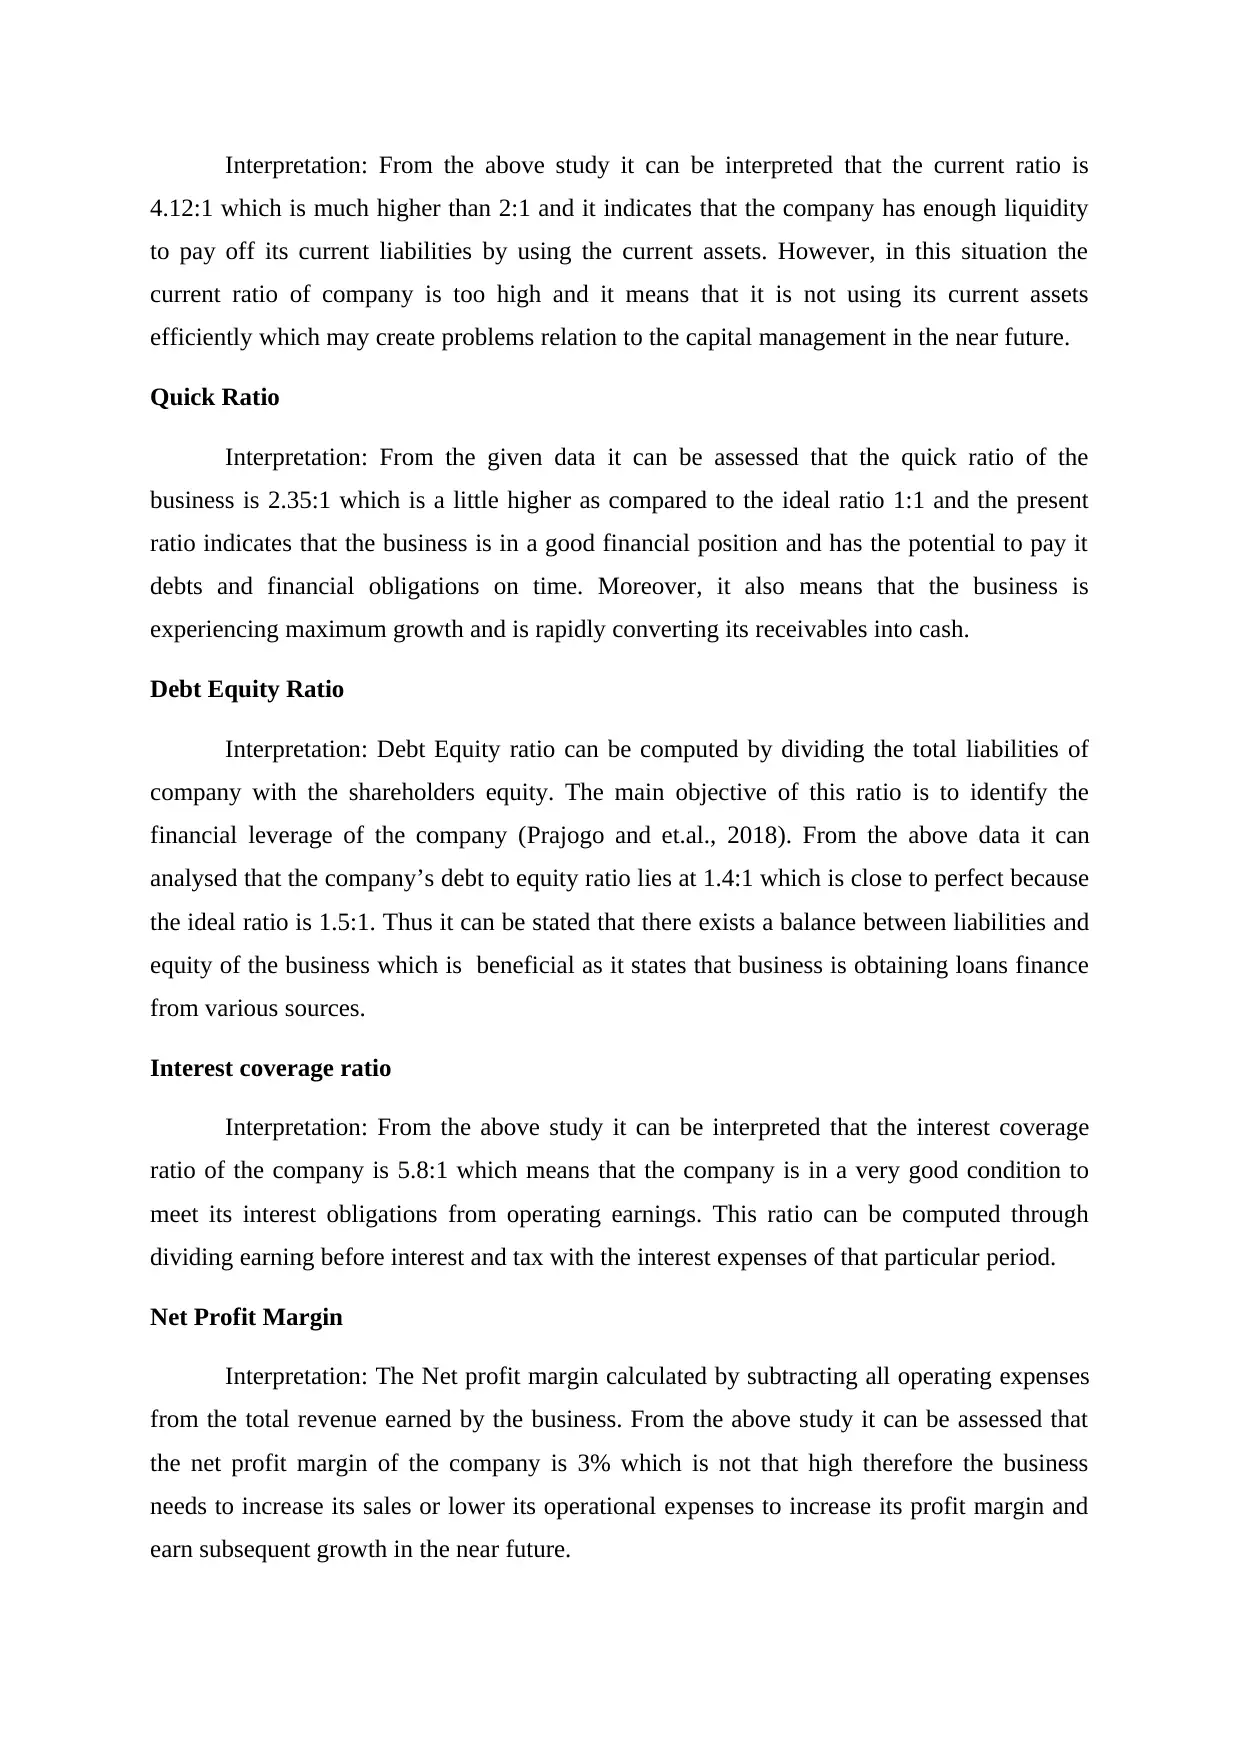
Interpretation: From the above study it can be interpreted that the current ratio is
4.12:1 which is much higher than 2:1 and it indicates that the company has enough liquidity
to pay off its current liabilities by using the current assets. However, in this situation the
current ratio of company is too high and it means that it is not using its current assets
efficiently which may create problems relation to the capital management in the near future.
Quick Ratio
Interpretation: From the given data it can be assessed that the quick ratio of the
business is 2.35:1 which is a little higher as compared to the ideal ratio 1:1 and the present
ratio indicates that the business is in a good financial position and has the potential to pay it
debts and financial obligations on time. Moreover, it also means that the business is
experiencing maximum growth and is rapidly converting its receivables into cash.
Debt Equity Ratio
Interpretation: Debt Equity ratio can be computed by dividing the total liabilities of
company with the shareholders equity. The main objective of this ratio is to identify the
financial leverage of the company (Prajogo and et.al., 2018). From the above data it can
analysed that the company’s debt to equity ratio lies at 1.4:1 which is close to perfect because
the ideal ratio is 1.5:1. Thus it can be stated that there exists a balance between liabilities and
equity of the business which is beneficial as it states that business is obtaining loans finance
from various sources.
Interest coverage ratio
Interpretation: From the above study it can be interpreted that the interest coverage
ratio of the company is 5.8:1 which means that the company is in a very good condition to
meet its interest obligations from operating earnings. This ratio can be computed through
dividing earning before interest and tax with the interest expenses of that particular period.
Net Profit Margin
Interpretation: The Net profit margin calculated by subtracting all operating expenses
from the total revenue earned by the business. From the above study it can be assessed that
the net profit margin of the company is 3% which is not that high therefore the business
needs to increase its sales or lower its operational expenses to increase its profit margin and
earn subsequent growth in the near future.
Paraphrase This Document
Need a fresh take? Get an instant paraphrase of this document with our AI Paraphraser
Stock Turnover Ratio:
Interpretation: Stock turnover ratio is also called as inventory turnover ratio and it
indicates the number of times a company can sell and replace its inventory during a course of
time. It can be derived by dividing the cost of goods sold with average inventory of the same
period. The business has a good stock turnover ratio of 8.6:1 which means that the rate at
which inventory is restocked is very well balanced with the sales and the company has a good
sales turnover.
Debtors Turnover Ratio
Interpretation: From the above study it can be interpreted that the debtor turnover
ratio of the firm is in the ratio of 15:1 which is very high and it indicates that the company’s
collection of accounts receivable is efficient and the customers pay their debt very quickly. It
also suggests that the company does not provide easy credit facility to its consumers (Jibril
and Jagun, 2018). It can be calculated by dividing the net credit sales of company with its
average accounts receivable.
Creditors Turnover Ratio
Interpretation: It can be assessed with the given information that the creditors turnover
ratio is computed at 43:1 and is extremely high that means that the business is making quick
repayments to its suppliers and lenders to maintain the creditworthiness of the company.Good
creditors turnover ratio will also help the firm in obtaining easy finance from the banks and
financial institutions.
TASK 3
Analysing & comparing internal and the external performance measures and pricing role on
performance of business
KPIs are counted as the metrics which is been used by the firm for tracking and
evaluating performance of the business periodically towards achievement of the specific
goals. They are been used for gauging an overall performance of an enterprise over the other
competitive firms within an entire industry (Prajogo and et.al., 2018). It could be either
internal or external where internal KPIs are been used for attaining internal goals within the
sections or departments but would also affect achieving core goals of an entity. Key
performance indicator enables in mobilizing the employees for working towards achieving
the core objectives of the business. On the other hand, external KPIs are utilized for reaching
or achieving departmental performance with regards to overall core or main objectives of an
entity.
Role of pricing
Pricing plays a crucial role in increasing the profitability of the company as if the
company sets high prices it will gain higher profits but sometimes it results to reduction in
sales which indirectly lowers down the profits. However, lower prices facilitates lower rate of
return per item with increase in the level of revenue with high pace that in turn leads to
increase in the profits (KanKam-Kwarteng and et.al., 2018). Moreover, it brings out value
that for the company’s products and the services offered and also secured the amount of
profits that a individual needs to invest in the growth and the change. Pricing plays an
important role in increasing the efficiency within the sales of an organization and thus
company need to take initiatives relating to cost cutting on regular basis. Hence, the firm
should set up or seek for setting up reasonable price which all the individuals can affords and
this helps an enterprise in gaining market share and large customer base.
⊘ This is a preview!⊘
Do you want full access?
Subscribe today to unlock all pages.
Trusted by 1+ million students worldwide
REFERENCES
Books and journal
Alkaraan, F., 2017. Strategic investment appraisal: multidisciplinary perspectives. Advances
in Mergers and Acquisitions. p.67.
Harris, E., 2017. Strategic project risk appraisal and management. Routledge.
Jibril, J. D. and Jagun, Z. T., 2018. Risk Identification Techniques in Valuation and
Investment Appraisal. International Journal of Engineering & Technology. 7(3.30).
pp.70-73.
KanKam-Kwarteng, C. and et.al., 2018. Service Innovation and Firm Performance of SMEs
auto service: the mediating role of Pricing Capability. Archives of Business
Research. 6(8).
Murad, M. H. and et.al., 2019. When continuous outcomes are measured using different
scales: guide for meta-analysis and interpretation. Bmj. 364. p.k4817.
Prajogo, D. and et.al., 2018. The relationships between information management, process
management and operational performance: Internal and external
contexts. International Journal of Production Economics. 199. pp.95-103.
1 out of 10
Related Documents


Your All-in-One AI-Powered Toolkit for Academic Success.
+13062052269
info@desklib.com
Available 24*7 on WhatsApp / Email
![[object Object]](/_next/static/media/star-bottom.7253800d.svg)
Unlock your academic potential
Copyright © 2020–2026 A2Z Services. All Rights Reserved. Developed and managed by ZUCOL.