Homework on Hypothesis Testing: P-Values and Test Statistics
VerifiedAdded on 2023/06/11
|8
|1499
|478
Homework Assignment
AI Summary
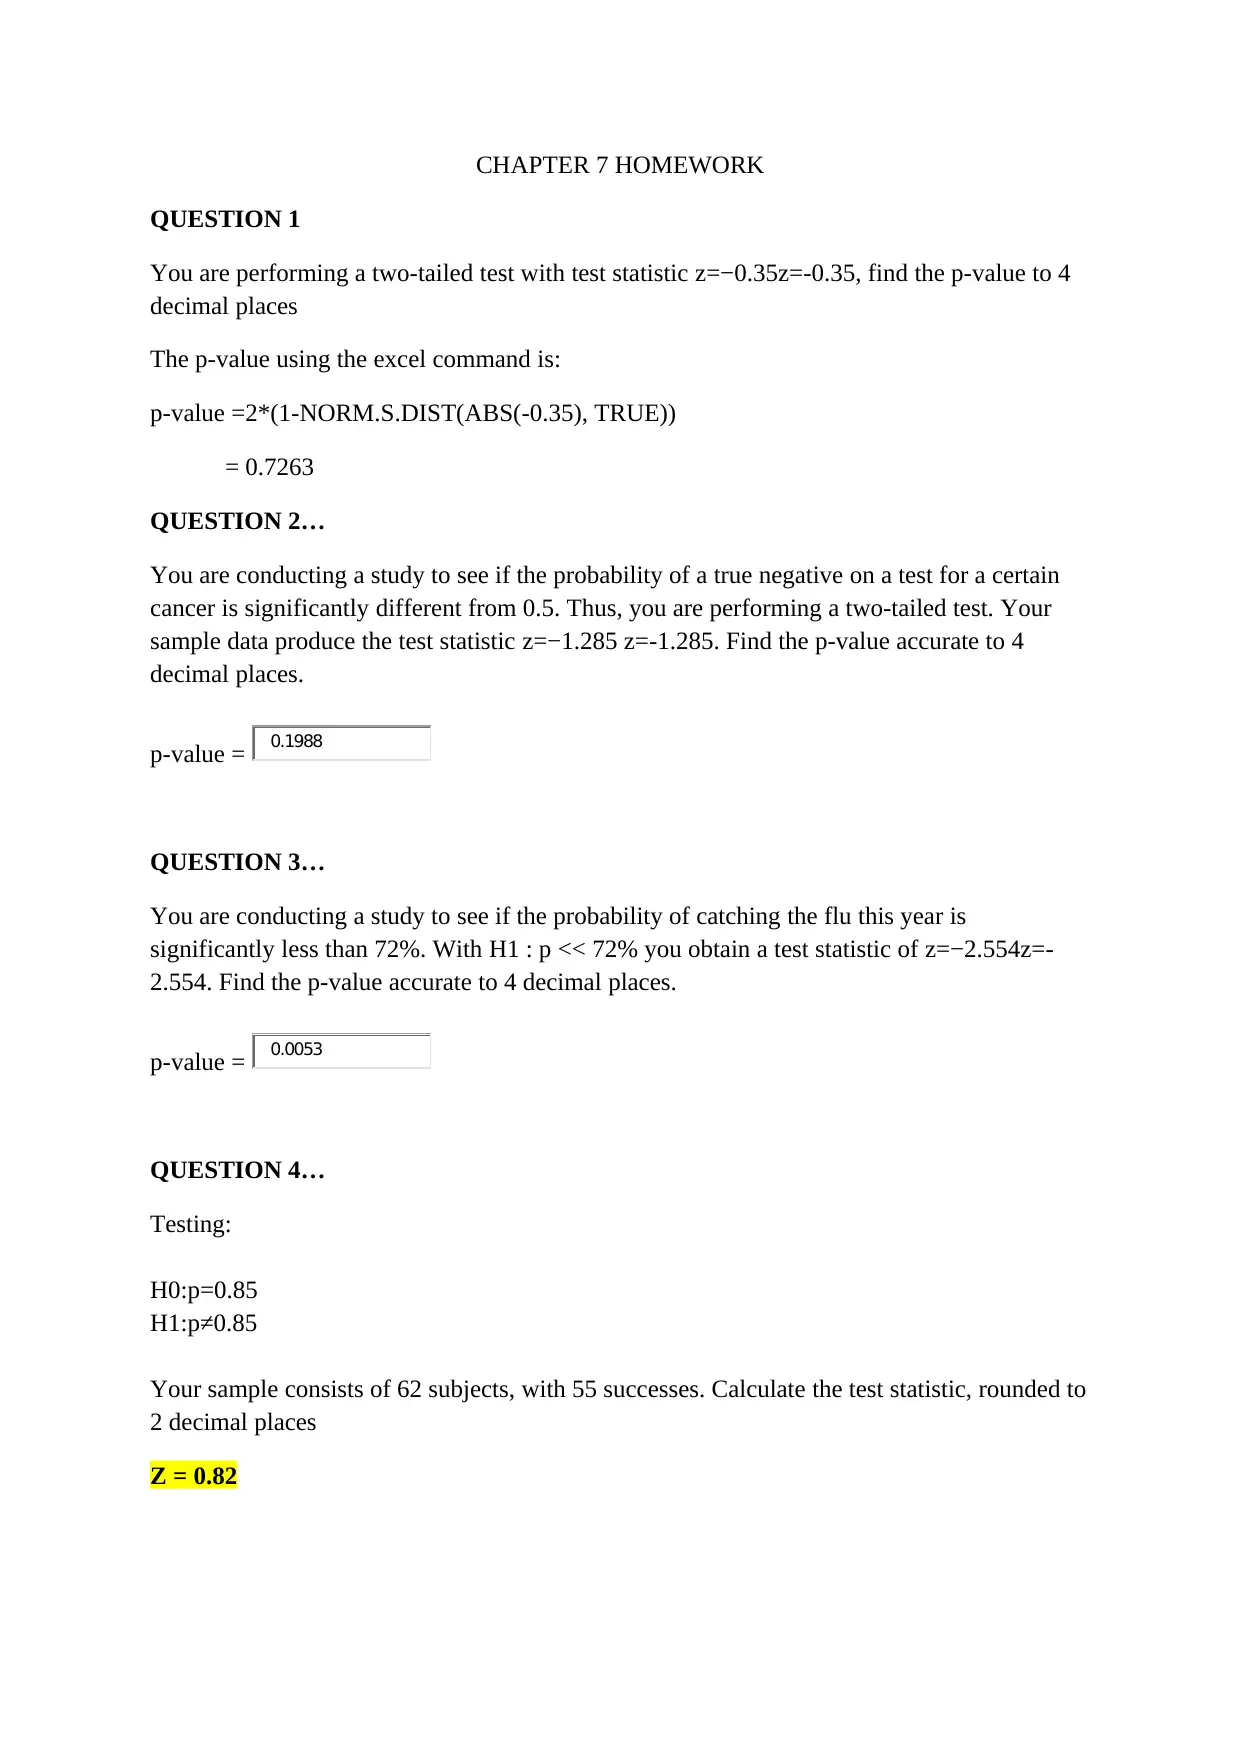
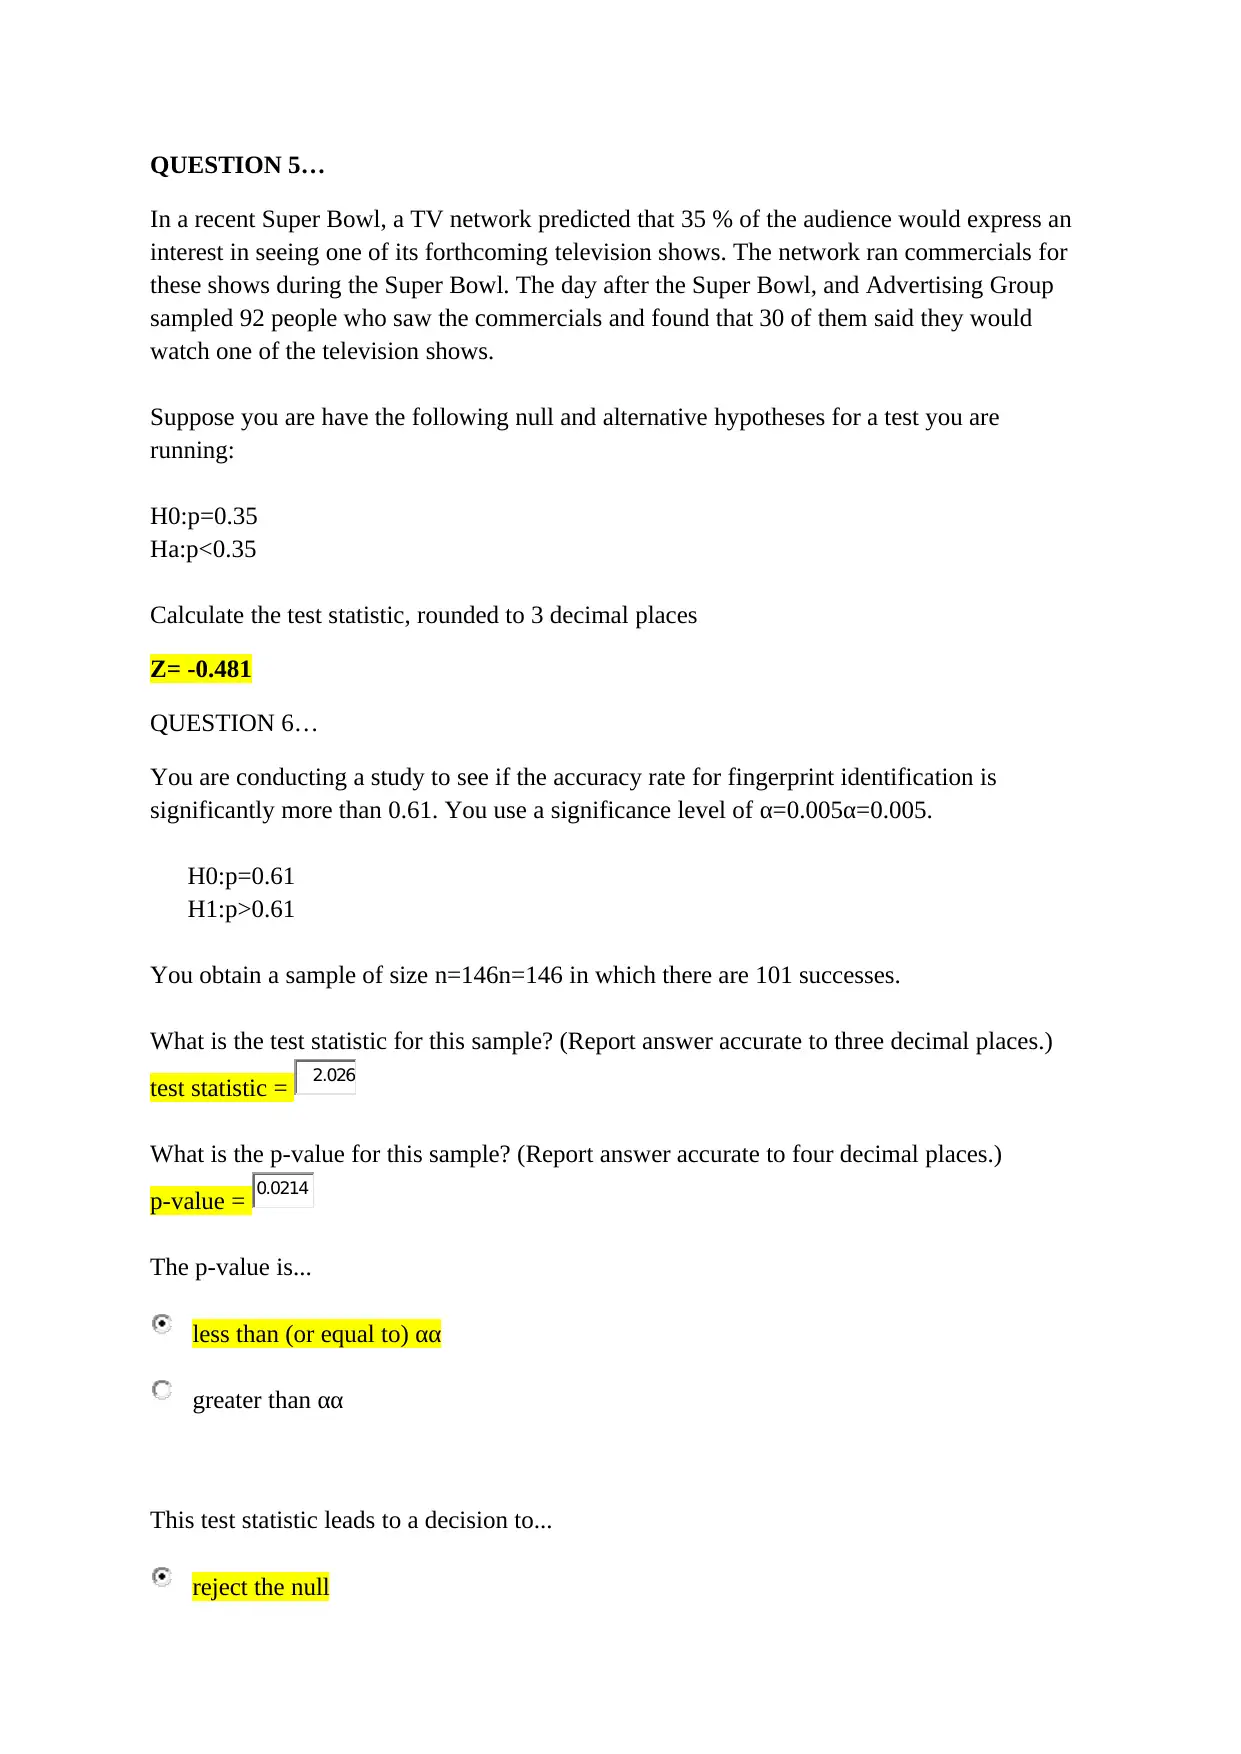
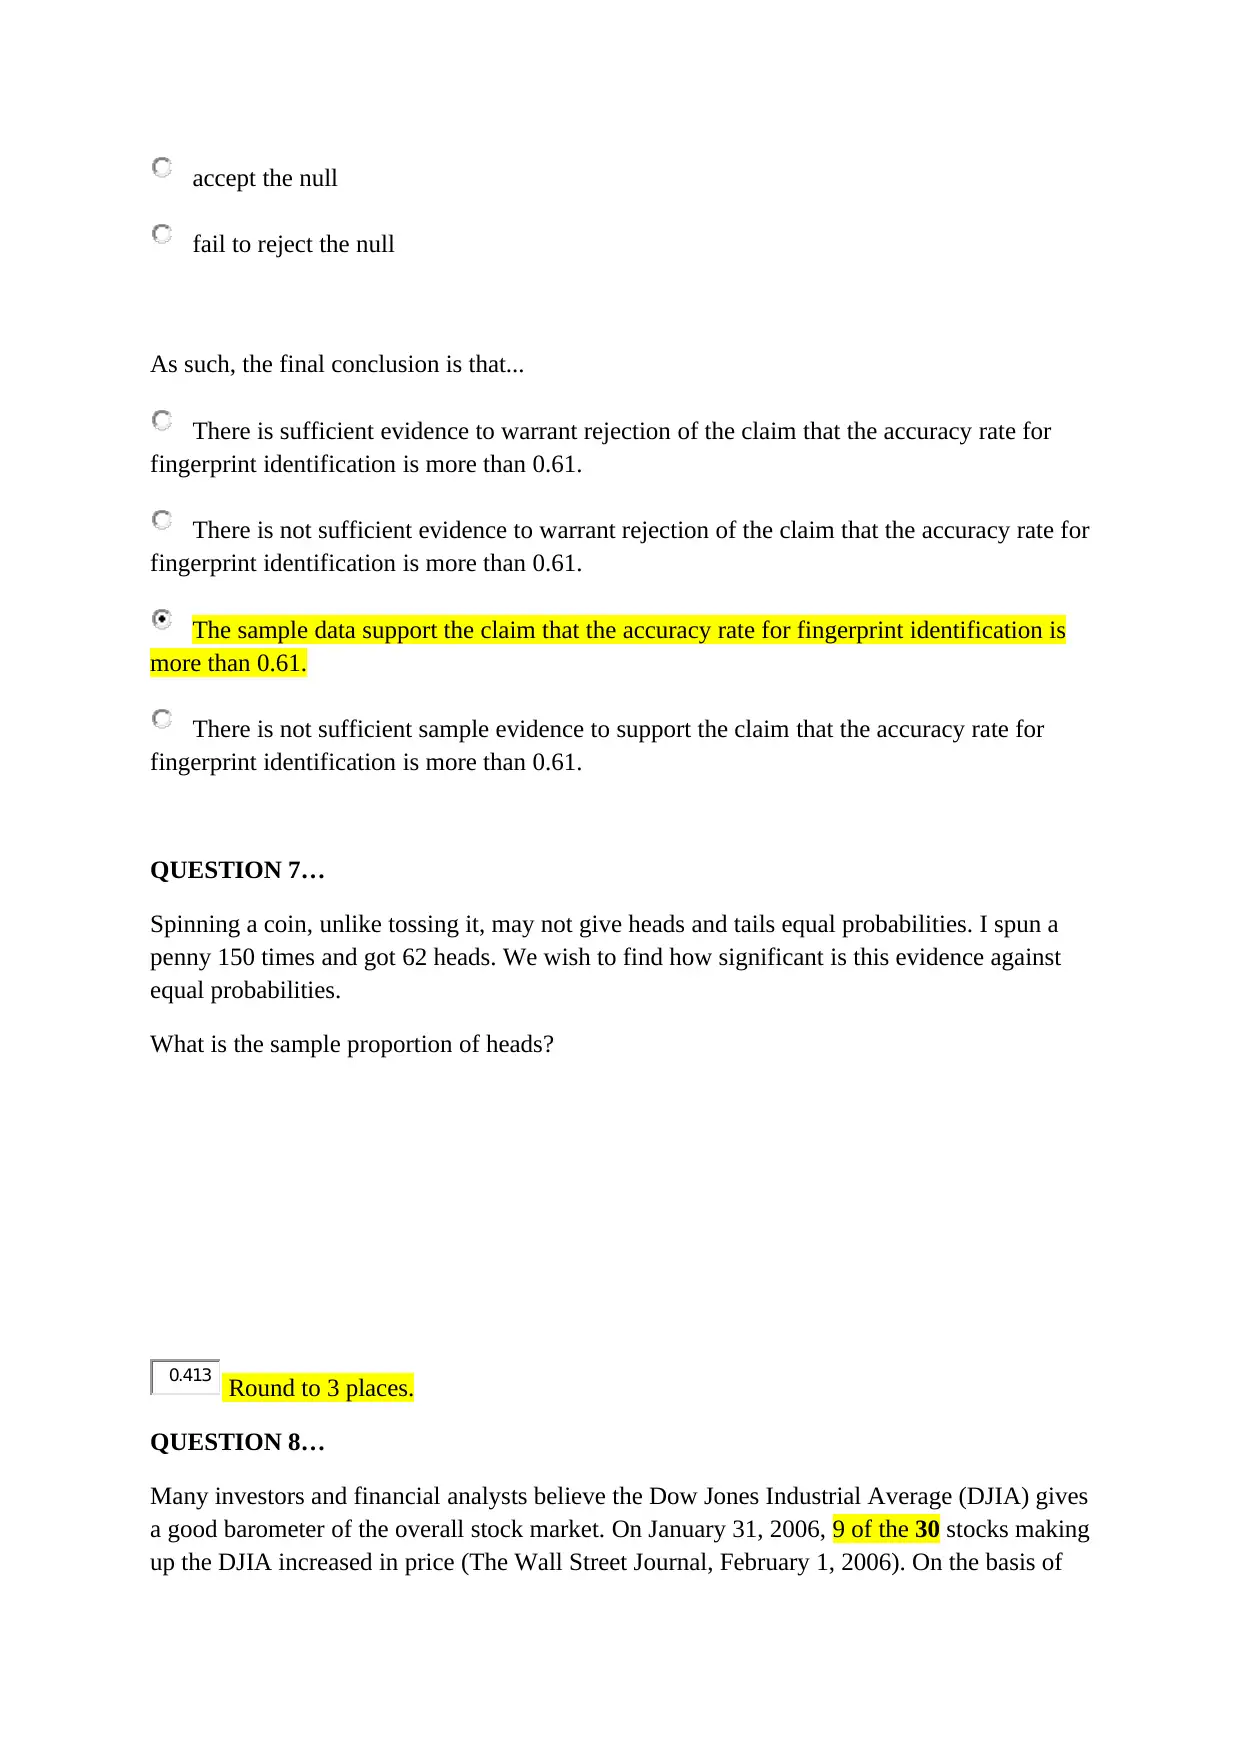
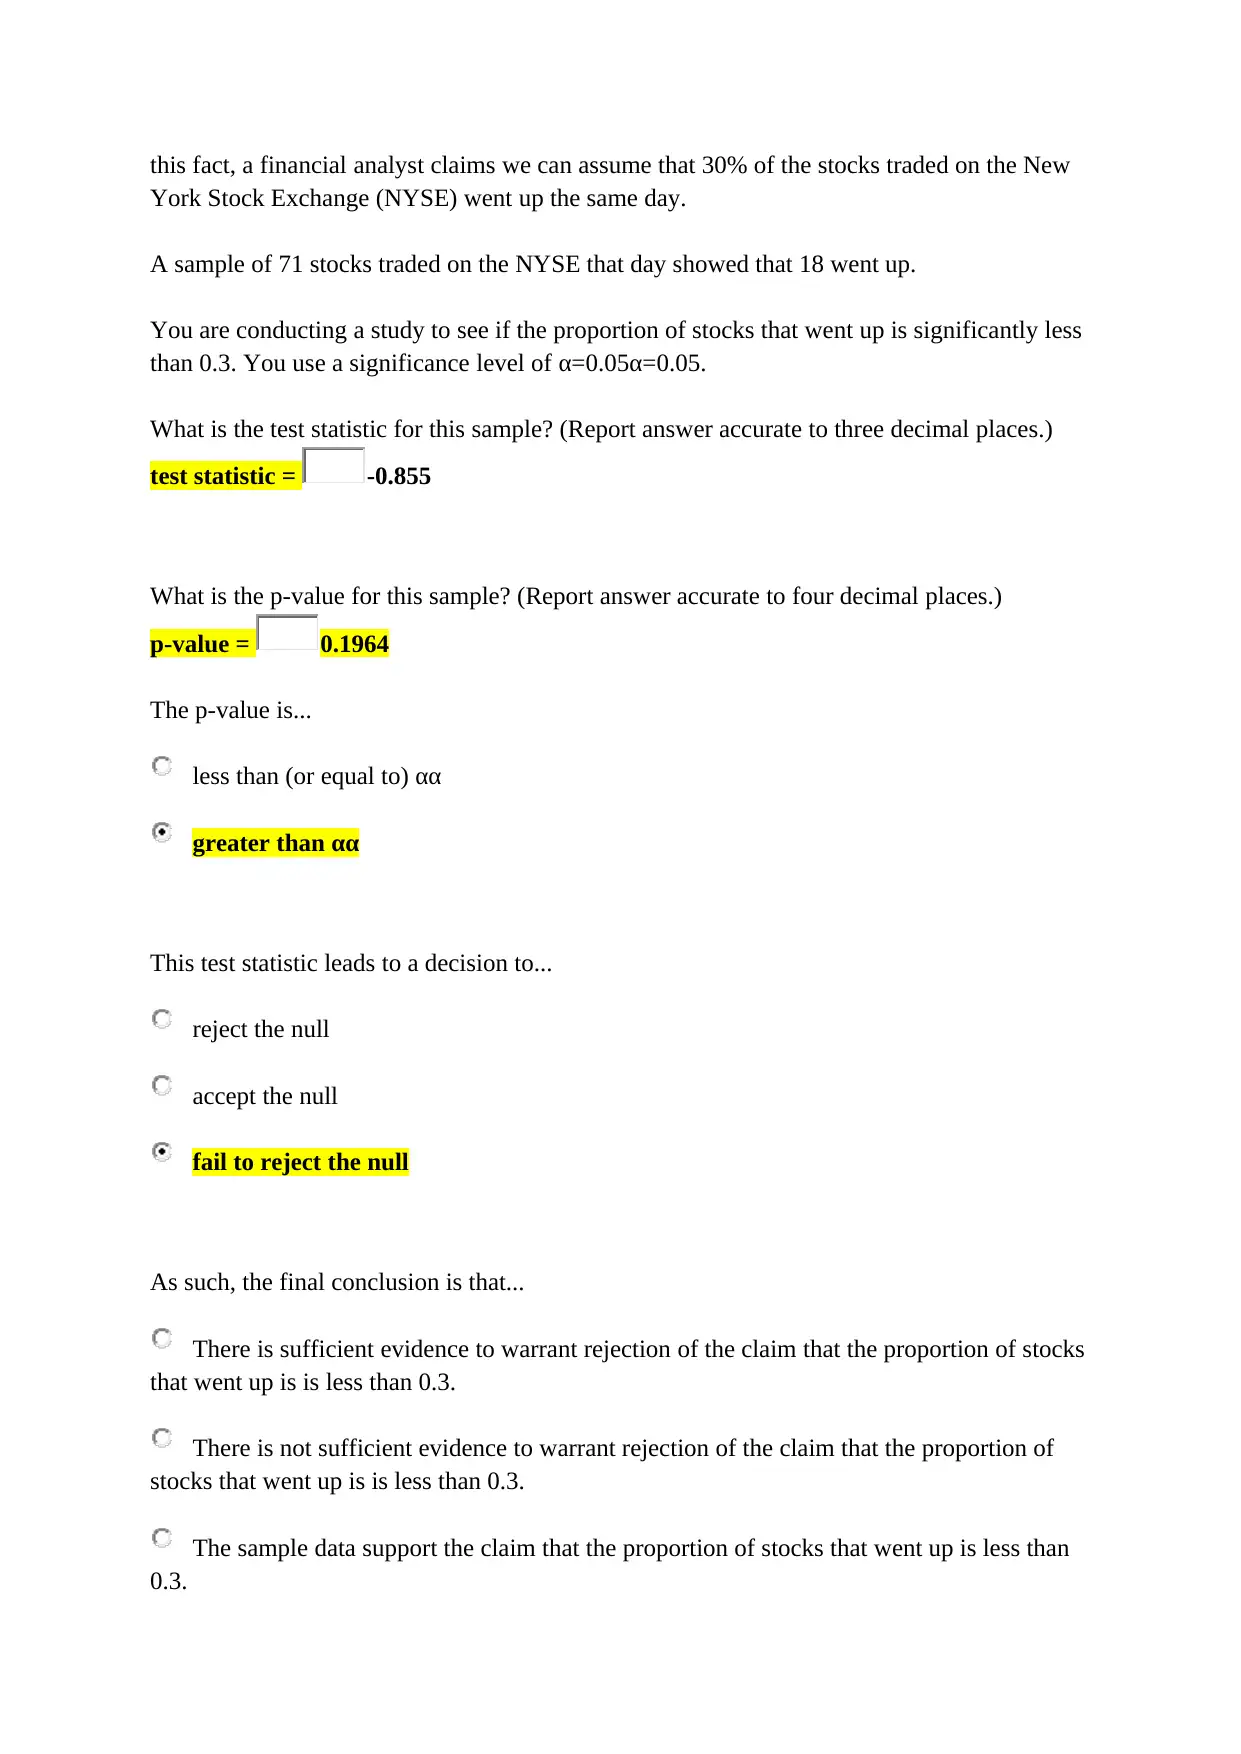
This assignment provides solutions to a statistics homework focusing on hypothesis testing and p-values. It covers various scenarios, including two-tailed tests, tests for proportions, and tests for means. The solutions demonstrate how to calculate test statistics, p-values, and make decisions based on significance levels. Specific questions address topics such as determining p-values from test statistics, calculating test statistics for sample proportions, and conducting hypothesis tests for population means with unknown standard deviations. The homework also includes problems involving confidence intervals and probability calculations. Each question provides a step-by-step solution, concluding with an interpretation of the results in the context of the hypothesis being tested.

CHAPTER 7 HOMEWORK
QUESTION 1
You are performing a two-tailed test with test statistic z=−0.35z=-0.35, find the p-value to 4
decimal places
The p-value using the excel command is:
p-value =2*(1-NORM.S.DIST(ABS(-0.35), TRUE))
= 0.7263
QUESTION 2…
You are conducting a study to see if the probability of a true negative on a test for a certain
cancer is significantly different from 0.5. Thus, you are performing a two-tailed test. Your
sample data produce the test statistic z=−1.285 z=-1.285. Find the p-value accurate to 4
decimal places.
p-value =
QUESTION 3…
You are conducting a study to see if the probability of catching the flu this year is
significantly less than 72%. With H1 : p << 72% you obtain a test statistic of z=−2.554z=-
2.554. Find the p-value accurate to 4 decimal places.
p-value =
QUESTION 4…
Testing:
H0:p=0.85
H1:p≠0.85
Your sample consists of 62 subjects, with 55 successes. Calculate the test statistic, rounded to
2 decimal places
Z = 0.82
0.1988
0.0053
Paraphrase This Document
Need a fresh take? Get an instant paraphrase of this document with our AI Paraphraser

QUESTION 5…
In a recent Super Bowl, a TV network predicted that 35 % of the audience would express an
interest in seeing one of its forthcoming television shows. The network ran commercials for
these shows during the Super Bowl. The day after the Super Bowl, and Advertising Group
sampled 92 people who saw the commercials and found that 30 of them said they would
watch one of the television shows.
Suppose you are have the following null and alternative hypotheses for a test you are
running:
H0:p=0.35
Ha:p<0.35
Calculate the test statistic, rounded to 3 decimal places
Z= -0.481
QUESTION 6…
You are conducting a study to see if the accuracy rate for fingerprint identification is
significantly more than 0.61. You use a significance level of α=0.005α=0.005.
H0:p=0.61
H1:p>0.61
You obtain a sample of size n=146n=146 in which there are 101 successes.
What is the test statistic for this sample? (Report answer accurate to three decimal places.)
test statistic =
What is the p-value for this sample? (Report answer accurate to four decimal places.)
p-value =
The p-value is...
less than (or equal to) αα
greater than αα
This test statistic leads to a decision to...
reject the null
2.026
0.0214

accept the null
fail to reject the null
As such, the final conclusion is that...
There is sufficient evidence to warrant rejection of the claim that the accuracy rate for
fingerprint identification is more than 0.61.
There is not sufficient evidence to warrant rejection of the claim that the accuracy rate for
fingerprint identification is more than 0.61.
The sample data support the claim that the accuracy rate for fingerprint identification is
more than 0.61.
There is not sufficient sample evidence to support the claim that the accuracy rate for
fingerprint identification is more than 0.61.
QUESTION 7…
Spinning a coin, unlike tossing it, may not give heads and tails equal probabilities. I spun a
penny 150 times and got 62 heads. We wish to find how significant is this evidence against
equal probabilities.
What is the sample proportion of heads?
Round to 3 places.
QUESTION 8…
Many investors and financial analysts believe the Dow Jones Industrial Average (DJIA) gives
a good barometer of the overall stock market. On January 31, 2006, 9 of the 30 stocks making
up the DJIA increased in price (The Wall Street Journal, February 1, 2006). On the basis of
0.413
⊘ This is a preview!⊘
Do you want full access?
Subscribe today to unlock all pages.

Trusted by 1+ million students worldwide

this fact, a financial analyst claims we can assume that 30% of the stocks traded on the New
York Stock Exchange (NYSE) went up the same day.
A sample of 71 stocks traded on the NYSE that day showed that 18 went up.
You are conducting a study to see if the proportion of stocks that went up is significantly less
than 0.3. You use a significance level of α=0.05α=0.05.
What is the test statistic for this sample? (Report answer accurate to three decimal places.)
test statistic = -0.855
What is the p-value for this sample? (Report answer accurate to four decimal places.)
p-value = 0.1964
The p-value is...
less than (or equal to) αα
greater than αα
This test statistic leads to a decision to...
reject the null
accept the null
fail to reject the null
As such, the final conclusion is that...
There is sufficient evidence to warrant rejection of the claim that the proportion of stocks
that went up is is less than 0.3.
There is not sufficient evidence to warrant rejection of the claim that the proportion of
stocks that went up is is less than 0.3.
The sample data support the claim that the proportion of stocks that went up is less than
0.3.
Paraphrase This Document
Need a fresh take? Get an instant paraphrase of this document with our AI Paraphraser

There is not sufficient sample evidence to support the claim that the proportion of
stocks that went up is less than 0.3.
QUESTION 9…
Testing:
H0:μ=57.2
H1:μ<57.2
Your sample consists of 45 subjects, with a mean of 57.1 and standard deviation of 1.28.
Calculate the test statistic, rounded to 2 decimal places.
t= -0.52
QUESTION 10…
You wish to test the following claim (HaHa) at a significance level of α=0.002α=0.002.
Ho:μ=88.6
Ha:μ<88.6
You believe the population is normally distributed, but you do not know the standard
deviation. You obtain a sample of size n=28n=28 with mean M=84M=84 and a standard
deviation of SD=8.4SD=8.4.
What is the test statistic for this sample? (Report answer accurate to three decimal places.)
test statistic =
= -2.898
What is the p-value for this sample? (Report answer accurate to four decimal places.)
p-value = 0.0037
The p-value is...
less than (or equal to) α
greater than α
This test statistic leads to a decision to...
reject the null

accept the null
fail to reject the null
As such, the final conclusion is that...
There is sufficient evidence to warrant rejection of the claim that the population mean is
less than 88.6.
There is not sufficient evidence to warrant rejection of the claim that the population mean
is less than 88.6.
The sample data support the claim that the population mean is less than 88.6.
There is not sufficient sample evidence to support the claim that the population
mean is less than 88.6.
QUESTION 11
You wish to test the following claim (HaHa) at a significance level of α=0.10α=0.10.
Ho:μ=75.4
Ha:μ≠75.4
You believe the population is normally distributed, but you do not know the standard
deviation. You obtain a sample of size n=107n=107 with mean M=73M=73 and a standard
deviation of SD=8.4SD=8.4.
What is the test statistic for this sample? (Report answer accurate to three decimal places.)
test statistic = -2.955
What is the p-value for this sample? (Report answer accurate to four decimal places.)
p-value = 0.0038
The p-value is...
less than (or equal to) αα
greater than αα
This test statistic leads to a decision to...
⊘ This is a preview!⊘
Do you want full access?
Subscribe today to unlock all pages.

Trusted by 1+ million students worldwide

reject the null
accept the null
fail to reject the null
As such, the final conclusion is that...
There is sufficient evidence to warrant rejection of the claim that the population
mean is not equal to 75.4.
There is not sufficient evidence to warrant rejection of the claim that the population mean
is not equal to 75.4.
The sample data support the claim that the population mean is not equal to 75.4.
There is not sufficient sample evidence to support the claim that the population mean is
not equal to 75.4.
QUESTION 12
You wish to test the following claim (Ha) at a significance level of α=0.002α=0.002.
Ho: μ = 68.1
Ha: μ ≠ 68.1
You believe the population is normally distributed, but you do not know the standard
deviation. You obtain the following sample of data:
data
106.4
94
89.6
88
What is the test statistic for this sample? (Report answer accurate to three decimal places.)
test statistic = 6.339
Paraphrase This Document
Need a fresh take? Get an instant paraphrase of this document with our AI Paraphraser

What is the p-value for this sample? (Report answer accurate to four decimal places.)
p-value = 0.0079
p-value = 0.0079
1 out of 8
Related Documents
Your All-in-One AI-Powered Toolkit for Academic Success.
+13062052269
info@desklib.com
Available 24*7 on WhatsApp / Email
Unlock your academic potential
Copyright © 2020–2026 A2Z Services. All Rights Reserved. Developed and managed by ZUCOL.


