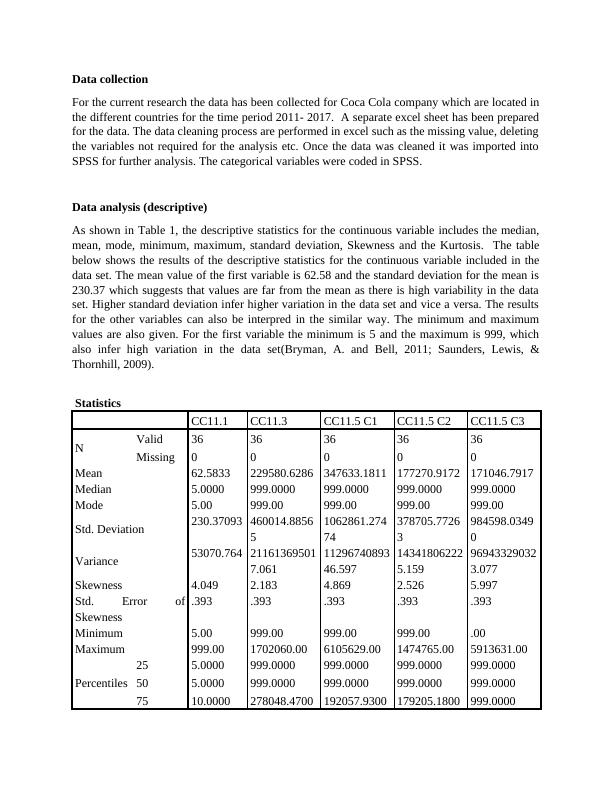
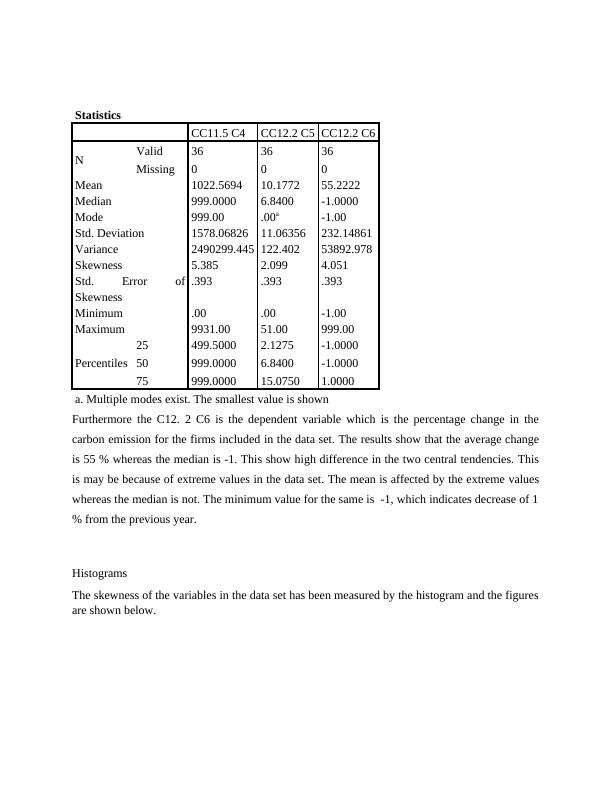
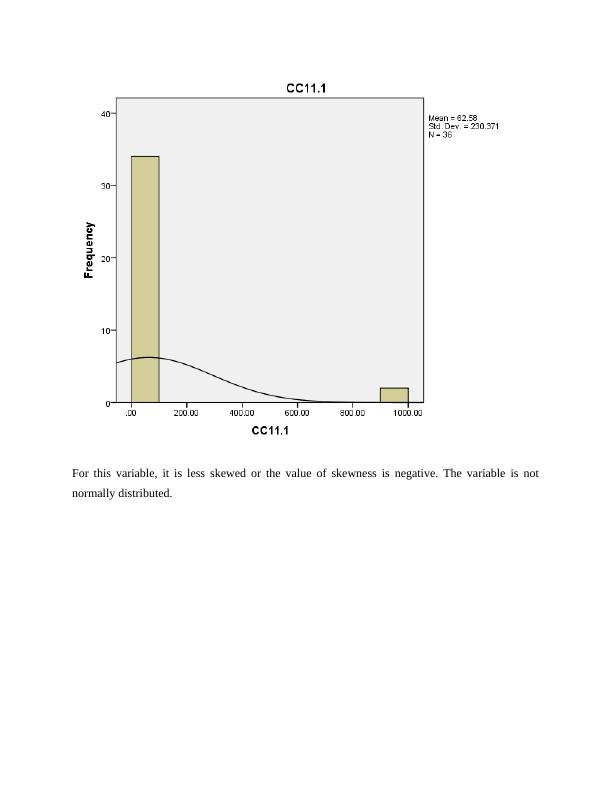
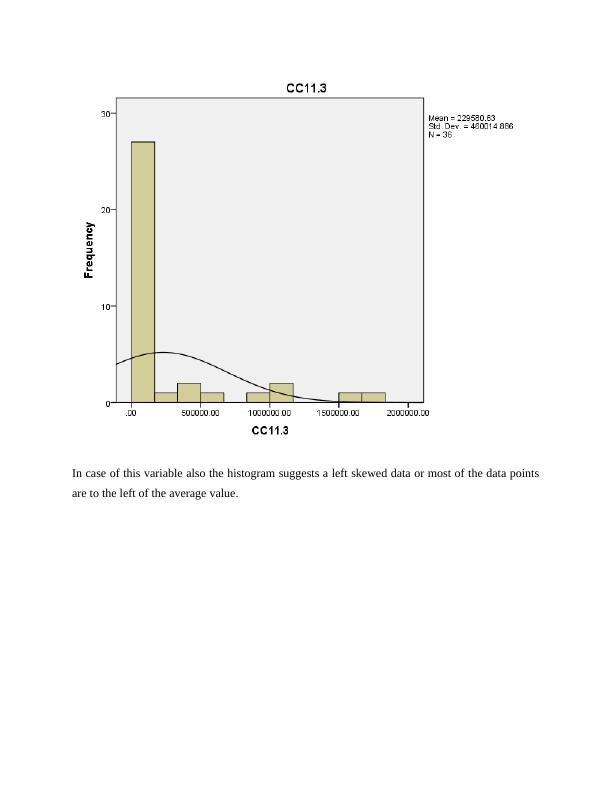
Data Collection and Descriptive Analysis of Coca Cola's Carbon Emission Data from 2011-2017
Added on 2023-06-12
13 Pages1877 Words456 Views
End of preview
Want to access all the pages? Upload your documents or become a member.
SPSS Data Collection - Assignment
|11
|1734
|19
Frequencies and T-Test Analysis for Climate Change Management Incentives
|9
|564
|401
Statistical Analysis of Gold Coast
|7
|1589
|235
The Stem And Leaf Plot For The Bread Prices In Baltimore | Assignment
|4
|483
|546
North South Divide in England: Analysis using Living Standards and Food Costs Survey
|7
|1302
|427
Data collection Assignment PDF
|8
|1681
|100