Financial Analysis of Company Valuation using DDM and DuPont Approach
VerifiedAdded on 2020/12/10
|44
|14181
|485
Project
AI Summary
This assignment presents a comprehensive company valuation analysis, employing the Dividend Discount Model (DDM) and DuPont analysis to assess financial performance and determine intrinsic value. The project begins with an examination of the DuPont model, calculating Return on Equity (ROE) for Flight Centre Travel Group (FLT), Webjet, and Hello World from 2014 to 2018. This includes detailed calculations of profit margin, asset turnover, and financial leverage. The second part of the assignment focuses on estimating share price using the DDM, calculating the cost of equity and the current stock value. The analysis includes dividend forecasting and sensitivity analysis to evaluate the impact of uncertainties on the valuation. The appendix provides detailed financial data and sensitivity analysis results. The assignment aims to provide a thorough understanding of valuation methodologies and their application in financial analysis.

Company Valuation
Paraphrase This Document
Need a fresh take? Get an instant paraphrase of this document with our AI Paraphraser
TABLE OF CONTENTS
TABLE OF CONTENTS................................................................................................................2
PART 1............................................................................................................................................1
Q.4 Estimating the ROE of the company for five years by using DU PONT ROE approach....1
PART 2............................................................................................................................................2
Q.2 Estimating share price using dividend discount model (DDM) for estimating intrinsic
value of the company...................................................................................................................2
REFERENCES................................................................................................................................4
APPENDIX......................................................................................................................................5
PART 1
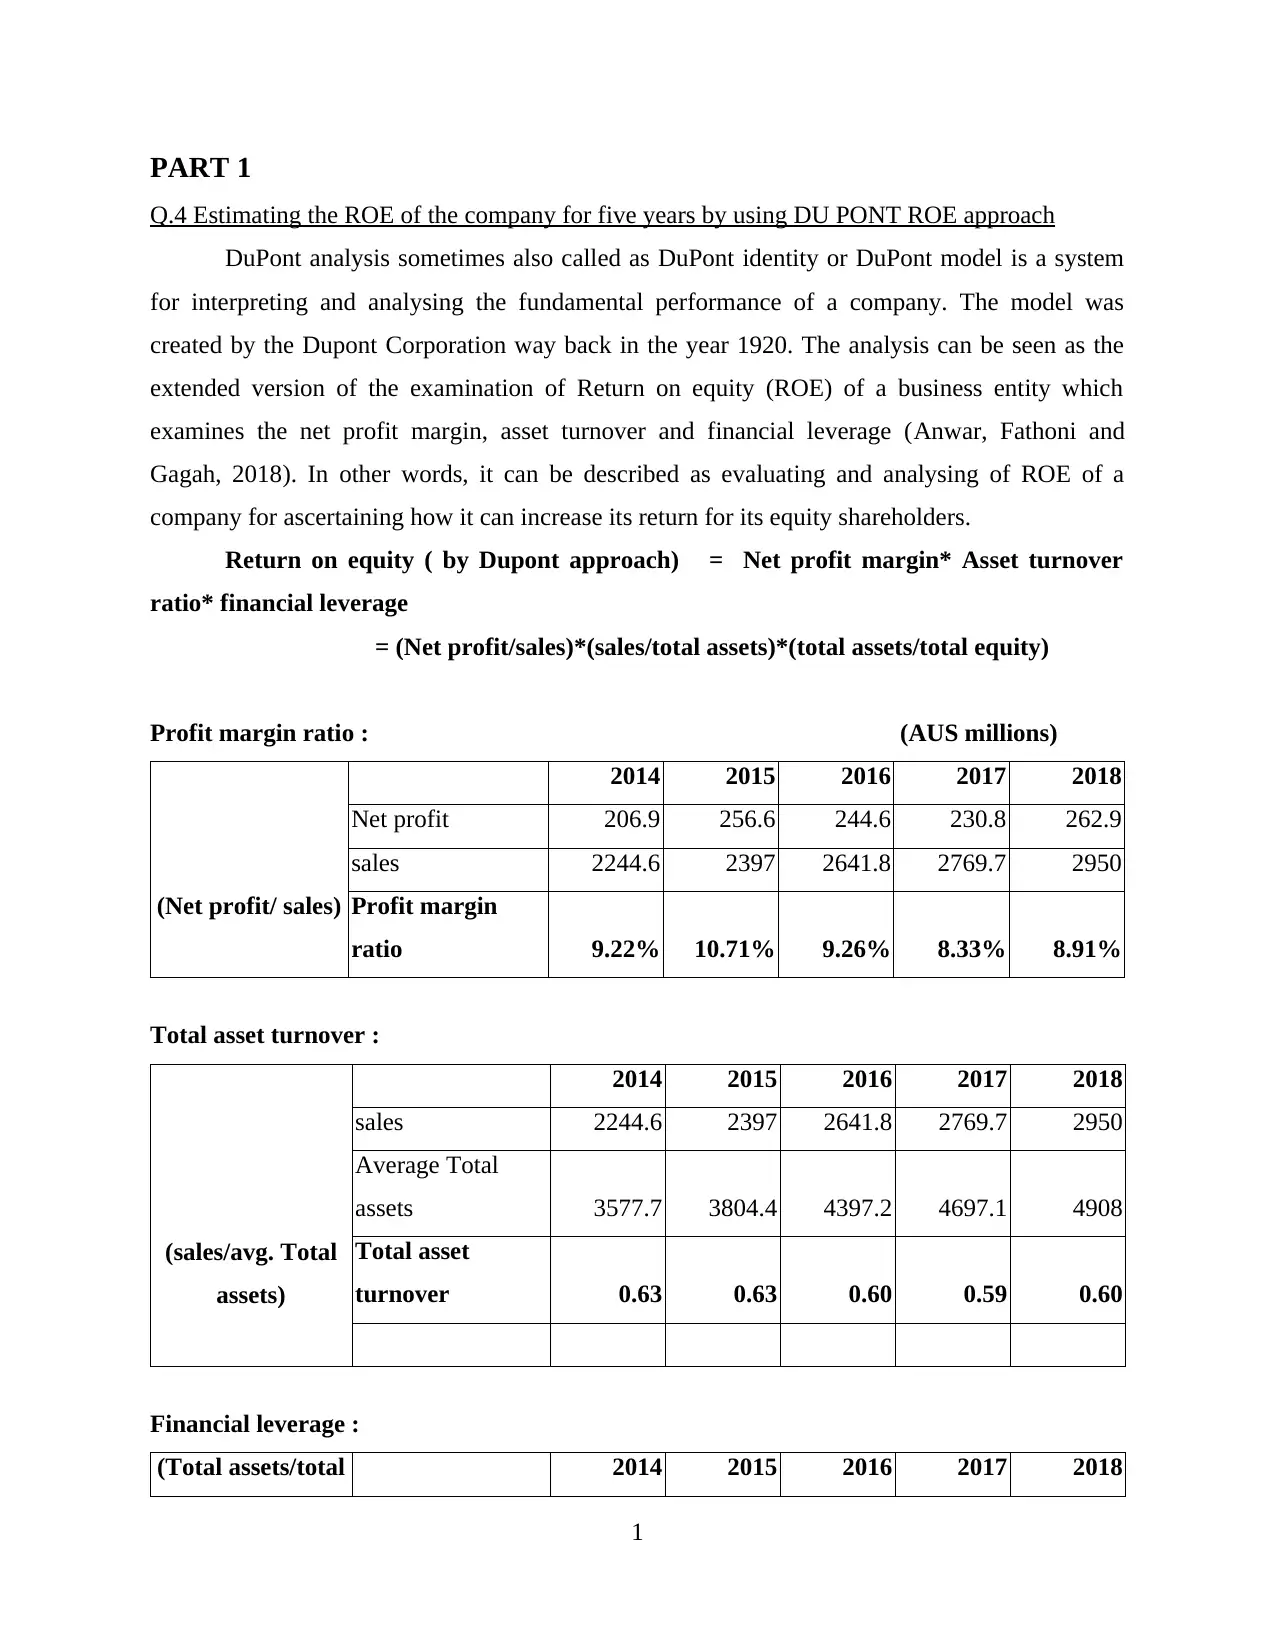
Q.4 Estimating the ROE of the company for five years by using DU PONT ROE approach
DuPont analysis sometimes also called as DuPont identity or DuPont model is a system
for interpreting and analysing the fundamental performance of a company. The model was
created by the Dupont Corporation way back in the year 1920. The analysis can be seen as the
extended version of the examination of Return on equity (ROE) of a business entity which
examines the net profit margin, asset turnover and financial leverage (Anwar, Fathoni and
Gagah, 2018). In other words, it can be described as evaluating and analysing of ROE of a
company for ascertaining how it can increase its return for its equity shareholders.
Return on equity ( by Dupont approach) = Net profit margin* Asset turnover
ratio* financial leverage
= (Net profit/sales)*(sales/total assets)*(total assets/total equity)
Profit margin ratio : (AUS millions)
(Net profit/ sales)
2014 2015 2016 2017 2018
Net profit 206.9 256.6 244.6 230.8 262.9
sales 2244.6 2397 2641.8 2769.7 2950
Profit margin
ratio 9.22% 10.71% 9.26% 8.33% 8.91%
Total asset turnover :
(sales/avg. Total
assets)
2014 2015 2016 2017 2018
sales 2244.6 2397 2641.8 2769.7 2950
Average Total
assets 3577.7 3804.4 4397.2 4697.1 4908
Total asset
turnover 0.63 0.63 0.60 0.59 0.60
Financial leverage :
(Total assets/total 2014 2015 2016 2017 2018
1
⊘ This is a preview!⊘
Do you want full access?
Subscribe today to unlock all pages.
Trusted by 1+ million students worldwide
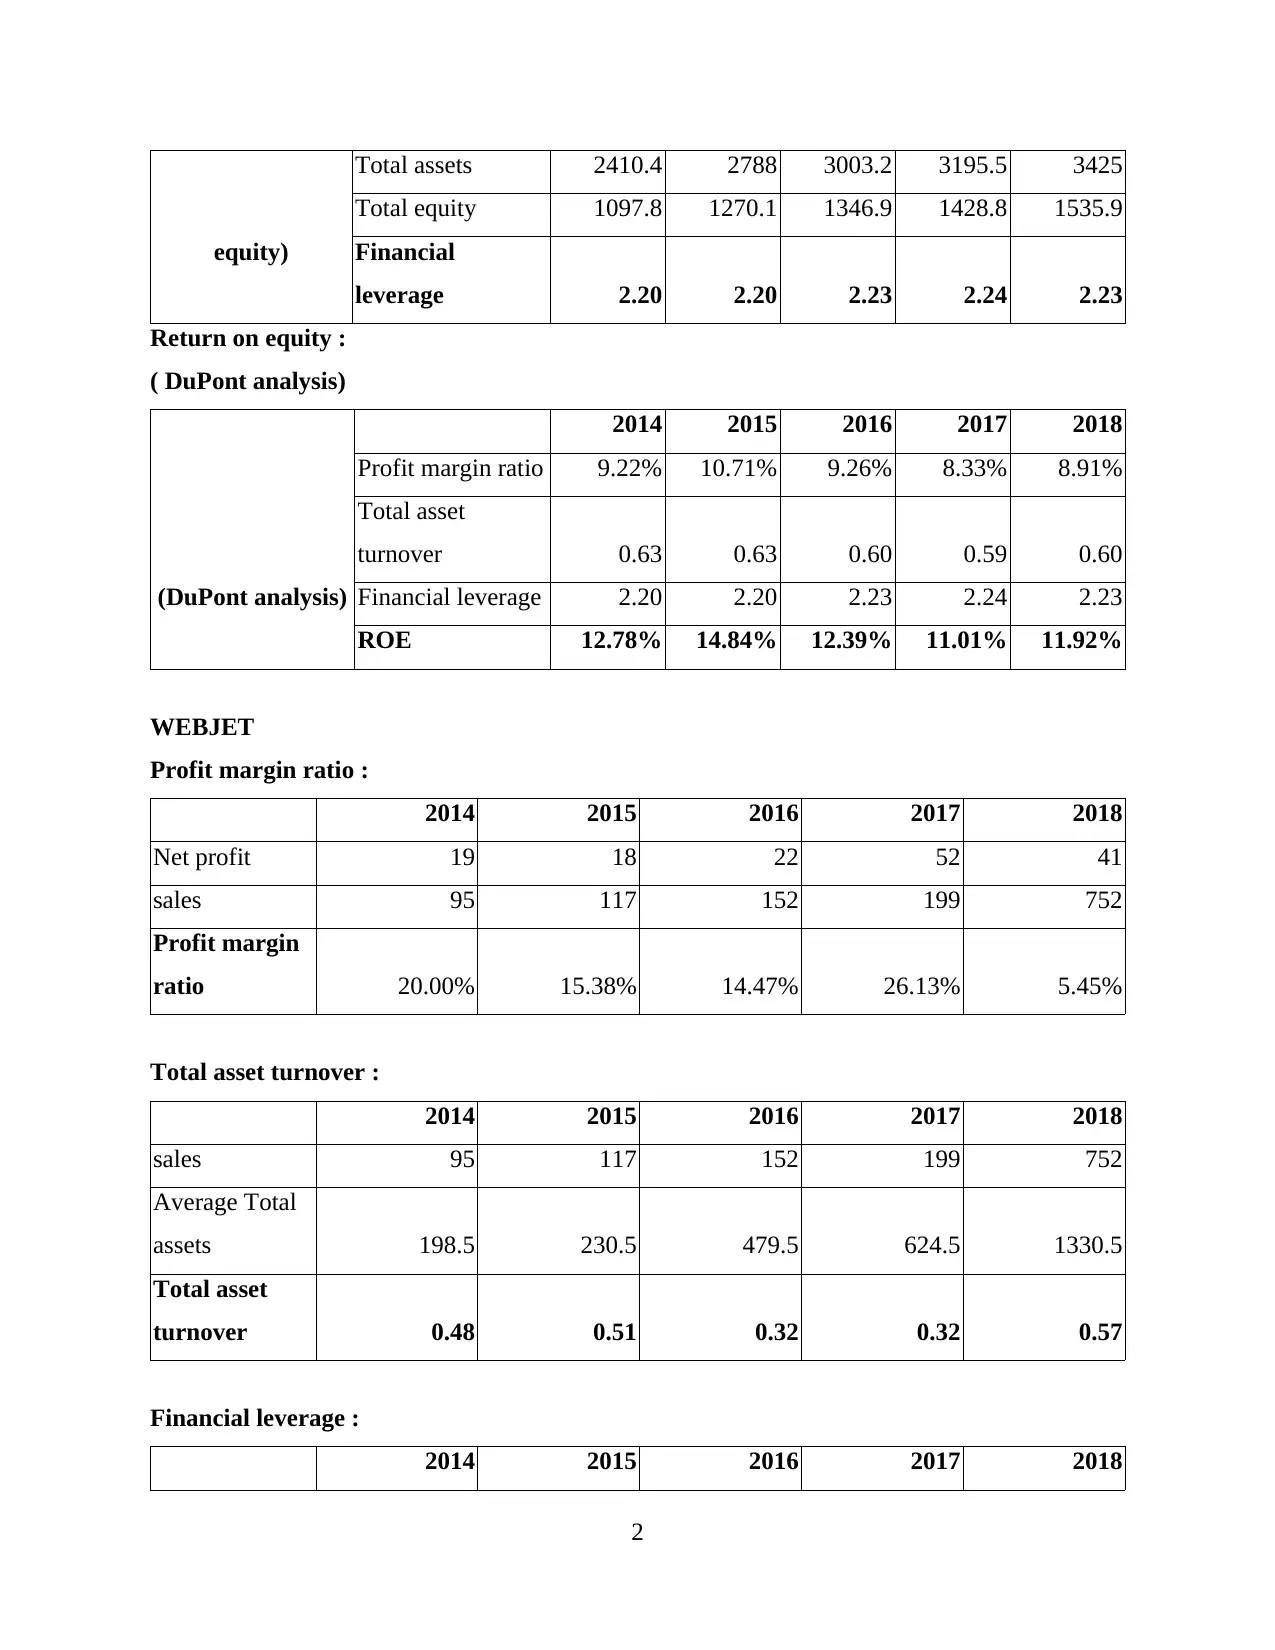
equity)
Total assets 2410.4 2788 3003.2 3195.5 3425
Total equity 1097.8 1270.1 1346.9 1428.8 1535.9
Financial
leverage 2.20 2.20 2.23 2.24 2.23
Return on equity :
( DuPont analysis)
(DuPont analysis)
2014 2015 2016 2017 2018
Profit margin ratio 9.22% 10.71% 9.26% 8.33% 8.91%
Total asset
turnover 0.63 0.63 0.60 0.59 0.60
Financial leverage 2.20 2.20 2.23 2.24 2.23
ROE 12.78% 14.84% 12.39% 11.01% 11.92%
WEBJET
Profit margin ratio :
2014 2015 2016 2017 2018
Net profit 19 18 22 52 41
sales 95 117 152 199 752
Profit margin
ratio 20.00% 15.38% 14.47% 26.13% 5.45%
Total asset turnover :
2014 2015 2016 2017 2018
sales 95 117 152 199 752
Average Total
assets 198.5 230.5 479.5 624.5 1330.5
Total asset
turnover 0.48 0.51 0.32 0.32 0.57
Financial leverage :
2014 2015 2016 2017 2018
2
Paraphrase This Document
Need a fresh take? Get an instant paraphrase of this document with our AI Paraphraser
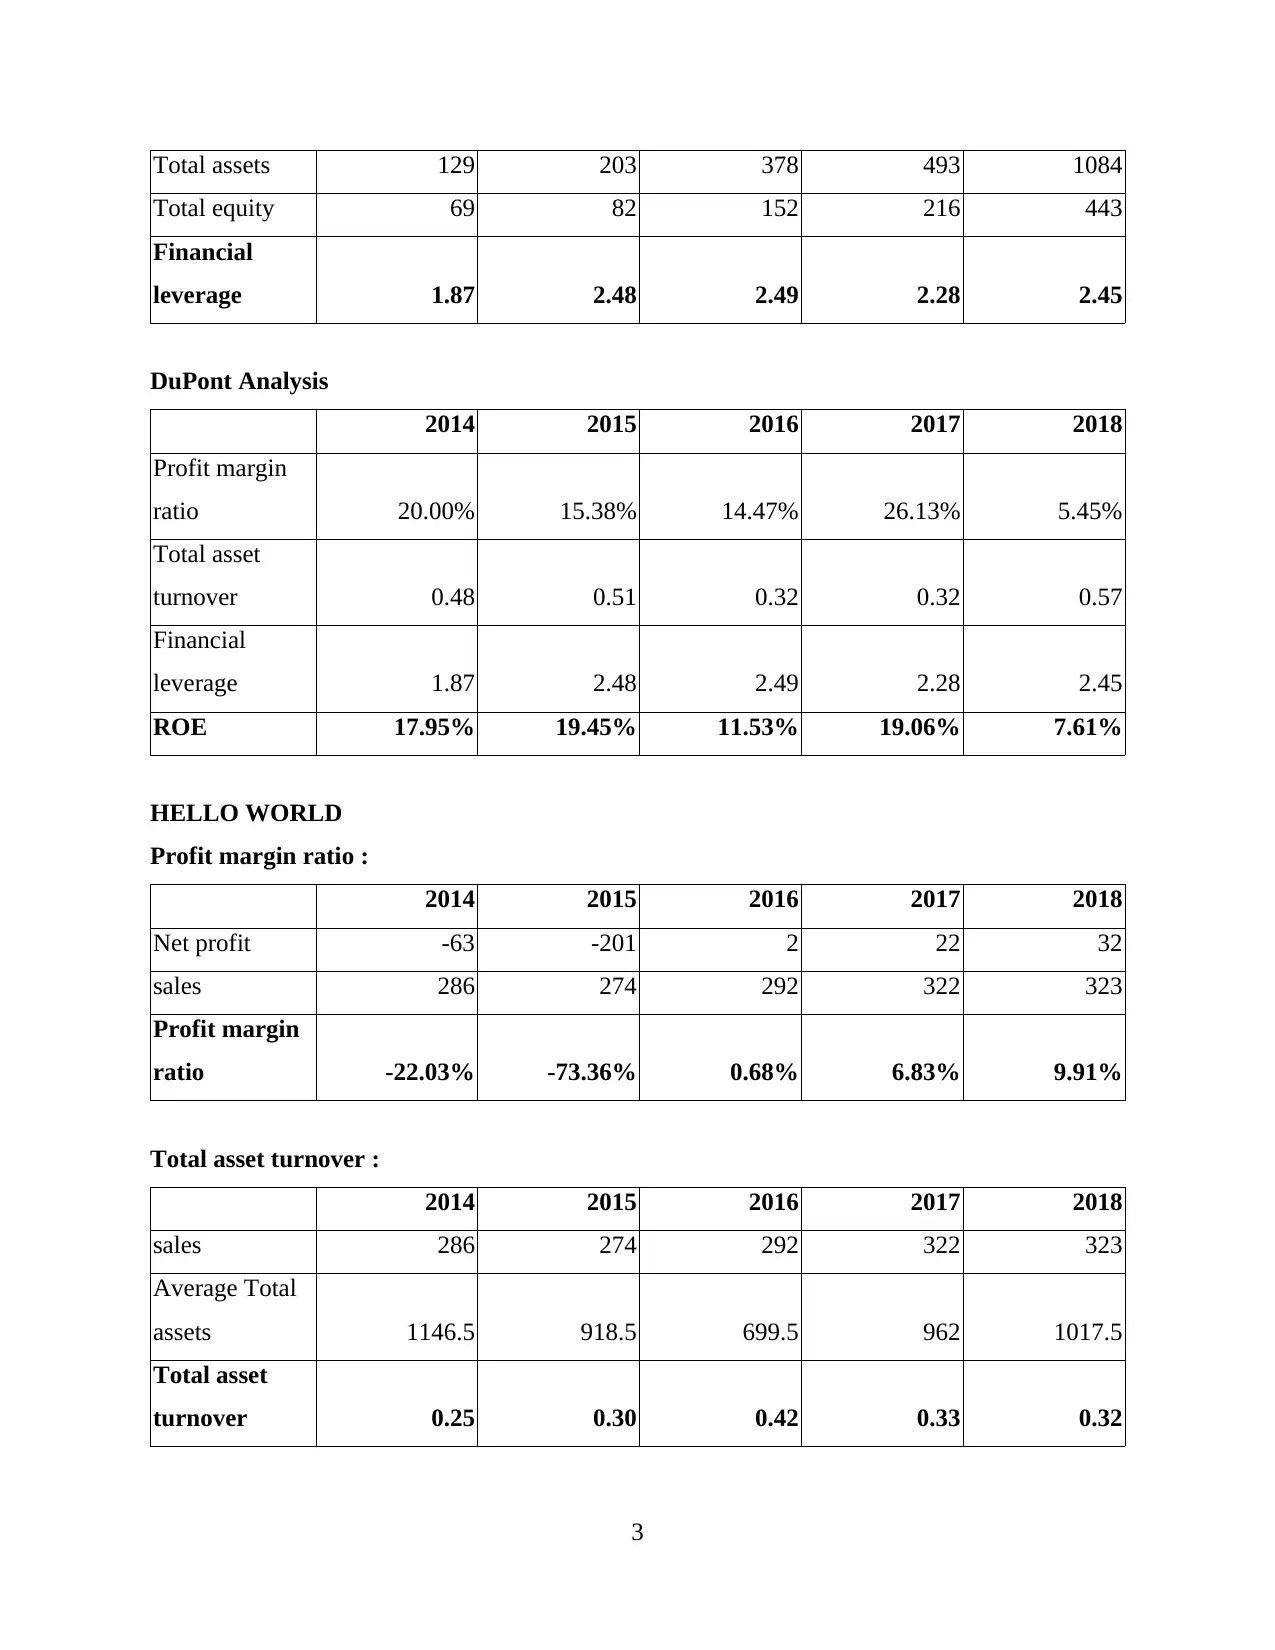
Total assets 129 203 378 493 1084
Total equity 69 82 152 216 443
Financial
leverage 1.87 2.48 2.49 2.28 2.45
DuPont Analysis
2014 2015 2016 2017 2018
Profit margin
ratio 20.00% 15.38% 14.47% 26.13% 5.45%
Total asset
turnover 0.48 0.51 0.32 0.32 0.57
Financial
leverage 1.87 2.48 2.49 2.28 2.45
ROE 17.95% 19.45% 11.53% 19.06% 7.61%
HELLO WORLD
Profit margin ratio :
2014 2015 2016 2017 2018
Net profit -63 -201 2 22 32
sales 286 274 292 322 323
Profit margin
ratio -22.03% -73.36% 0.68% 6.83% 9.91%
Total asset turnover :
2014 2015 2016 2017 2018
sales 286 274 292 322 323
Average Total
assets 1146.5 918.5 699.5 962 1017.5
Total asset
turnover 0.25 0.30 0.42 0.33 0.32
3
Financial leverage :
2014 2015 2016 2017 2018
Total assets 683 471 646 639 698
Total equity 377 177 266 279 301
Financial
leverage 1.81 2.66 2.43 2.29 2.32
DuPont Analysis :
2014 2015 2016 2017 2018
Profit margin
ratio -22.03% -73.36% 0.68% 6.83% 9.91%
Total asset
turnover 0.25 0.3 0.42 0.33 0.32
Financial
leverage 1.81 2.66 2.43 2.29 2.32
ROE -9.97% -58.54% 0.69% 5.16% 7.36%
DuPont Analysis of FLT, Hello World and Webjet
Companies
(ROE)
2014 2015 2016 2017 2018
FLT 12.78% 14.84% 12.39% 11.01% 11.92%
Webjet 17.95% 19.45% 11.53% 19.06% 7.61%
Hello World -9.97% -58.54% 0.69% 5.16% 7.36%
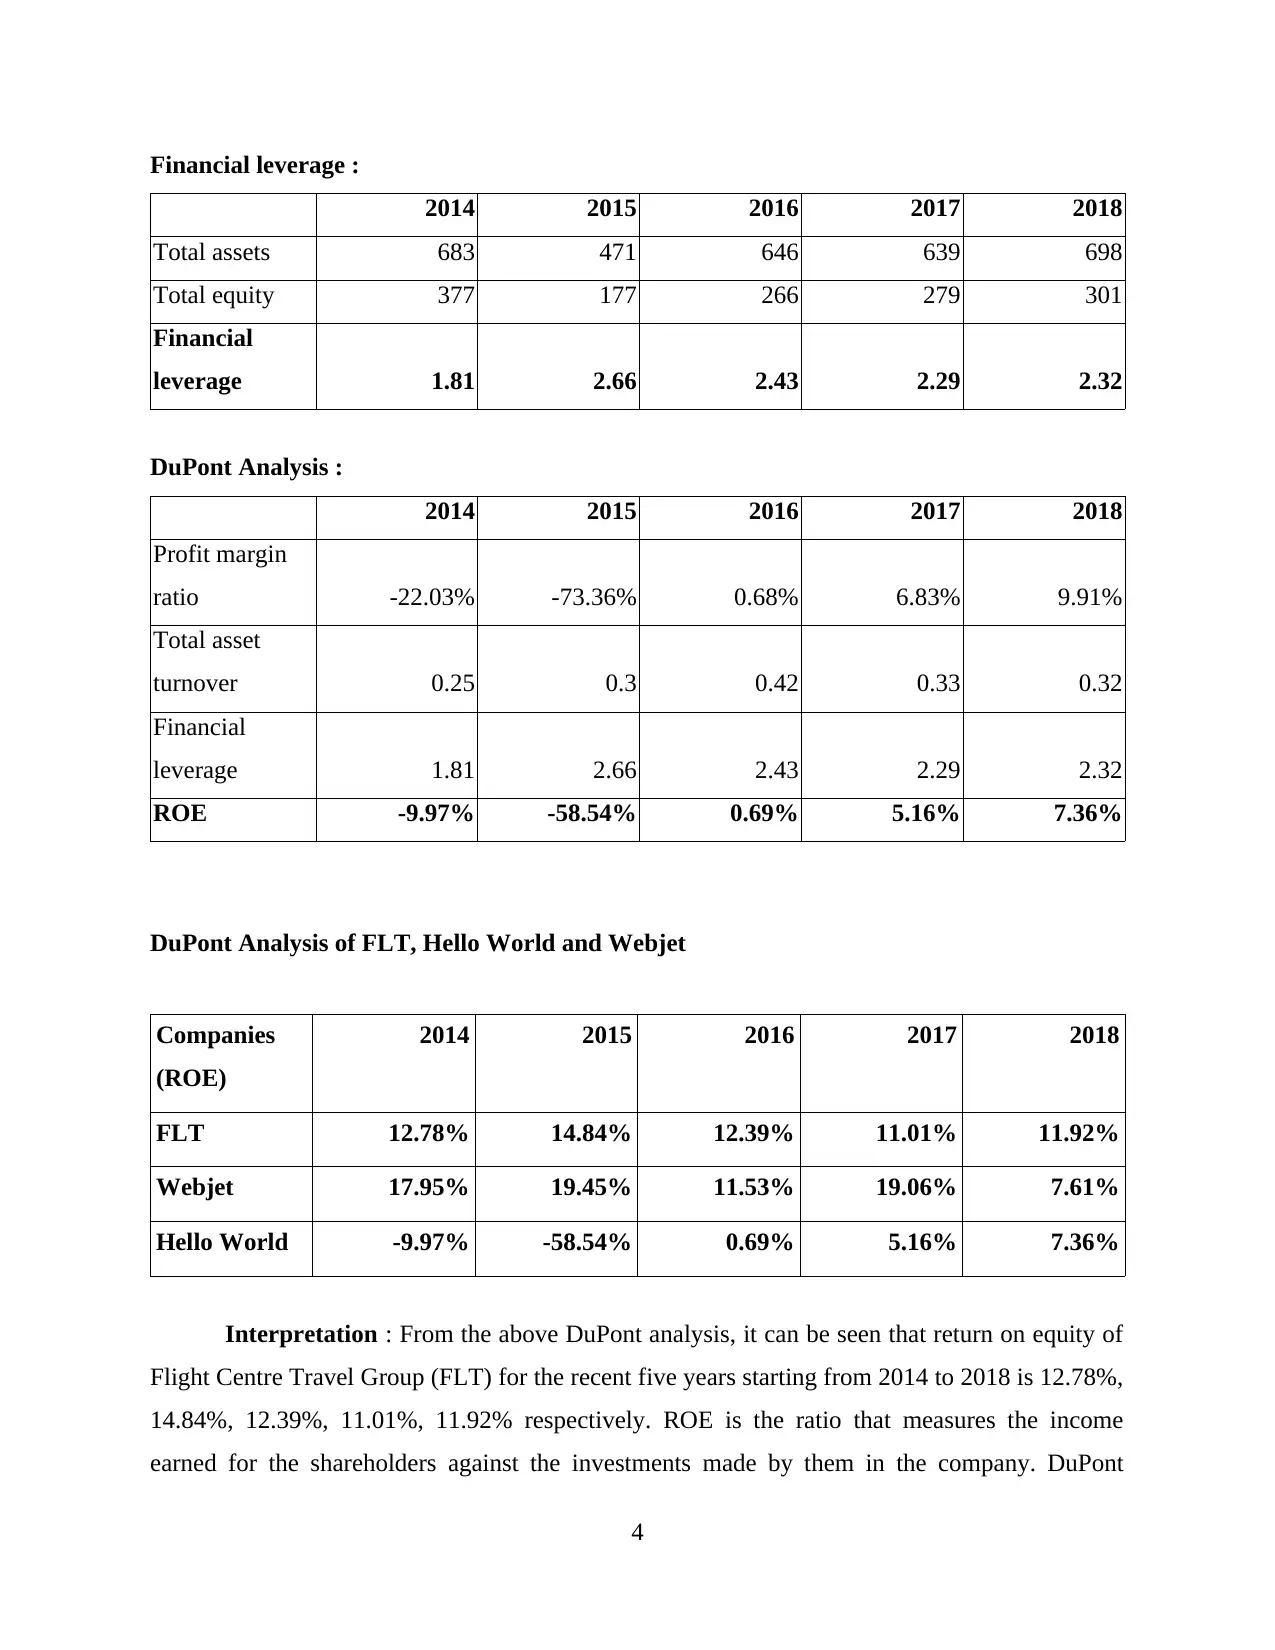
Interpretation : From the above DuPont analysis, it can be seen that return on equity of
Flight Centre Travel Group (FLT) for the recent five years starting from 2014 to 2018 is 12.78%,
14.84%, 12.39%, 11.01%, 11.92% respectively. ROE is the ratio that measures the income
earned for the shareholders against the investments made by them in the company. DuPont
4
2014 2015 2016 2017 2018
Total assets 683 471 646 639 698
Total equity 377 177 266 279 301
Financial
leverage 1.81 2.66 2.43 2.29 2.32
DuPont Analysis :
2014 2015 2016 2017 2018
Profit margin
ratio -22.03% -73.36% 0.68% 6.83% 9.91%
Total asset
turnover 0.25 0.3 0.42 0.33 0.32
Financial
leverage 1.81 2.66 2.43 2.29 2.32
ROE -9.97% -58.54% 0.69% 5.16% 7.36%
DuPont Analysis of FLT, Hello World and Webjet
Companies
(ROE)
2014 2015 2016 2017 2018
FLT 12.78% 14.84% 12.39% 11.01% 11.92%
Webjet 17.95% 19.45% 11.53% 19.06% 7.61%
Hello World -9.97% -58.54% 0.69% 5.16% 7.36%
Interpretation : From the above DuPont analysis, it can be seen that return on equity of
Flight Centre Travel Group (FLT) for the recent five years starting from 2014 to 2018 is 12.78%,
14.84%, 12.39%, 11.01%, 11.92% respectively. ROE is the ratio that measures the income
earned for the shareholders against the investments made by them in the company. DuPont
4
⊘ This is a preview!⊘
Do you want full access?
Subscribe today to unlock all pages.
Trusted by 1+ million students worldwide
analysis shows the ability of company to increase its return on equity. Operational efficiency is
reflected from this analysis which could be used by investors in assessing the financial efficiency
of the company. ROE was highest in 2015 at 14.84% which means that company earned
impressive income on the investments of the shareholders as compared to other years. After the
2015, ROE has decreased to 11 % approx which depicts that company's income has decreased
owing to high cost of revenue which in turn has reduced the income attributed to the
shareholders in the respective years.
PART 2
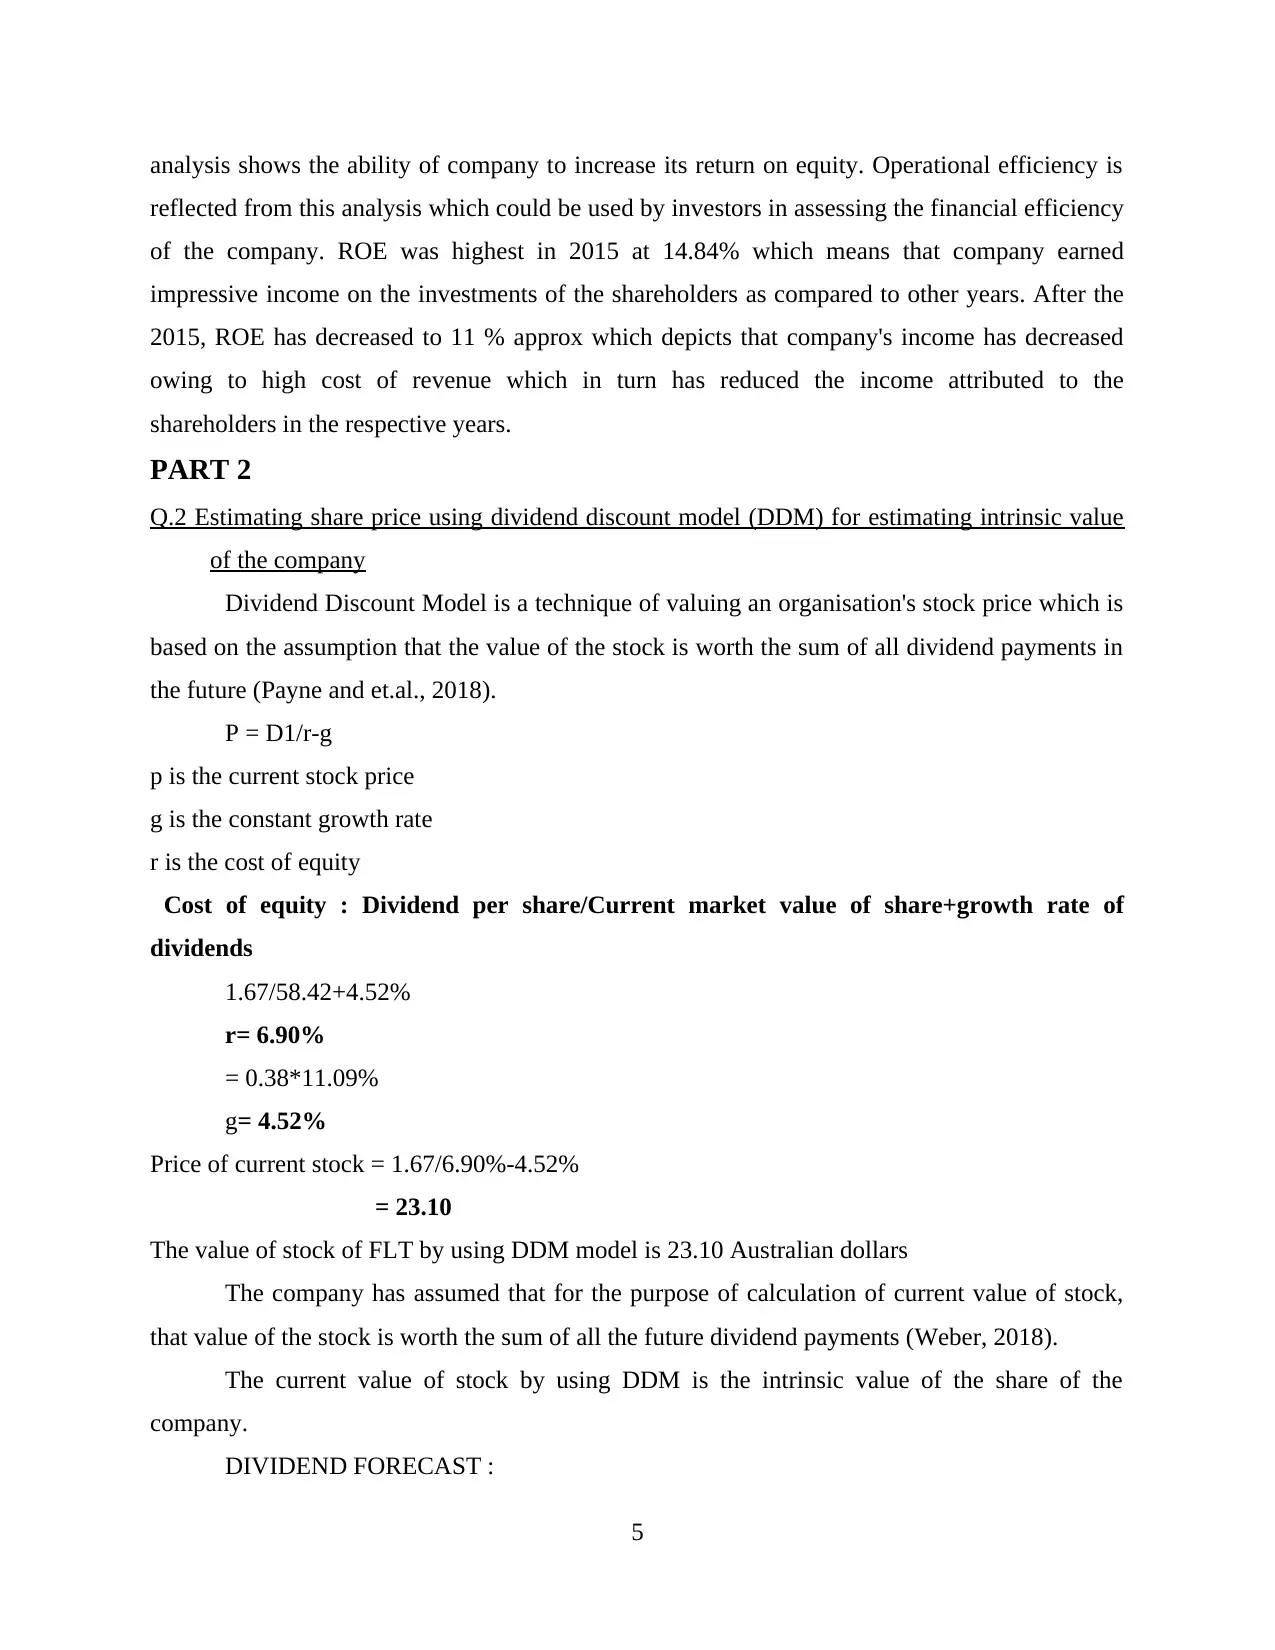
Q.2 Estimating share price using dividend discount model (DDM) for estimating intrinsic value
of the company
Dividend Discount Model is a technique of valuing an organisation's stock price which is
based on the assumption that the value of the stock is worth the sum of all dividend payments in
the future (Payne and et.al., 2018).
P = D1/r-g
p is the current stock price
g is the constant growth rate
r is the cost of equity
Cost of equity : Dividend per share/Current market value of share+growth rate of
dividends
1.67/58.42+4.52%
r= 6.90%
= 0.38*11.09%
g= 4.52%
Price of current stock = 1.67/6.90%-4.52%
= 23.10
The value of stock of FLT by using DDM model is 23.10 Australian dollars
The company has assumed that for the purpose of calculation of current value of stock,
that value of the stock is worth the sum of all the future dividend payments (Weber, 2018).
The current value of stock by using DDM is the intrinsic value of the share of the
company.
DIVIDEND FORECAST :
5
reflected from this analysis which could be used by investors in assessing the financial efficiency
of the company. ROE was highest in 2015 at 14.84% which means that company earned
impressive income on the investments of the shareholders as compared to other years. After the
2015, ROE has decreased to 11 % approx which depicts that company's income has decreased
owing to high cost of revenue which in turn has reduced the income attributed to the
shareholders in the respective years.
PART 2
Q.2 Estimating share price using dividend discount model (DDM) for estimating intrinsic value
of the company
Dividend Discount Model is a technique of valuing an organisation's stock price which is
based on the assumption that the value of the stock is worth the sum of all dividend payments in
the future (Payne and et.al., 2018).
P = D1/r-g
p is the current stock price
g is the constant growth rate
r is the cost of equity
Cost of equity : Dividend per share/Current market value of share+growth rate of
dividends
1.67/58.42+4.52%
r= 6.90%
= 0.38*11.09%
g= 4.52%
Price of current stock = 1.67/6.90%-4.52%
= 23.10
The value of stock of FLT by using DDM model is 23.10 Australian dollars
The company has assumed that for the purpose of calculation of current value of stock,
that value of the stock is worth the sum of all the future dividend payments (Weber, 2018).
The current value of stock by using DDM is the intrinsic value of the share of the
company.
DIVIDEND FORECAST :
5
Paraphrase This Document
Need a fresh take? Get an instant paraphrase of this document with our AI Paraphraser
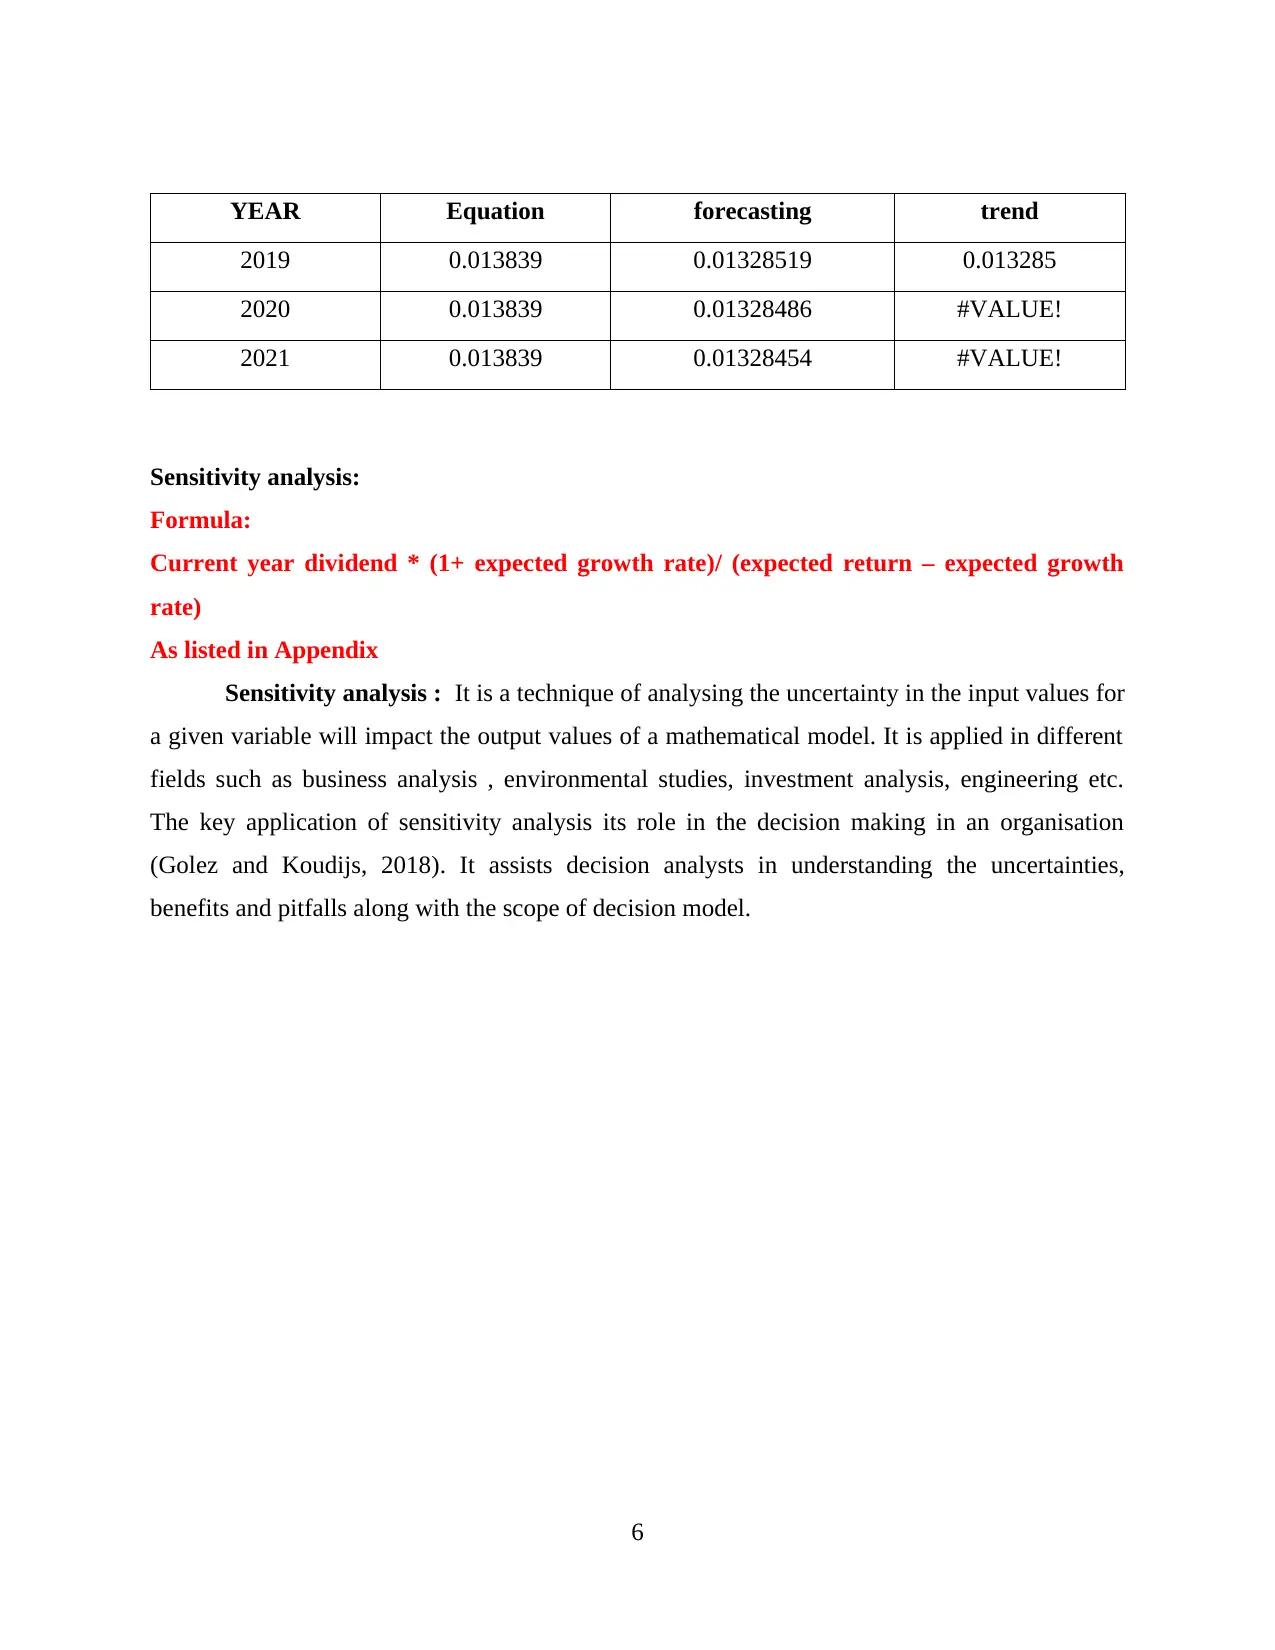
YEAR Equation forecasting trend
2019 0.013839 0.01328519 0.013285
2020 0.013839 0.01328486 #VALUE!
2021 0.013839 0.01328454 #VALUE!
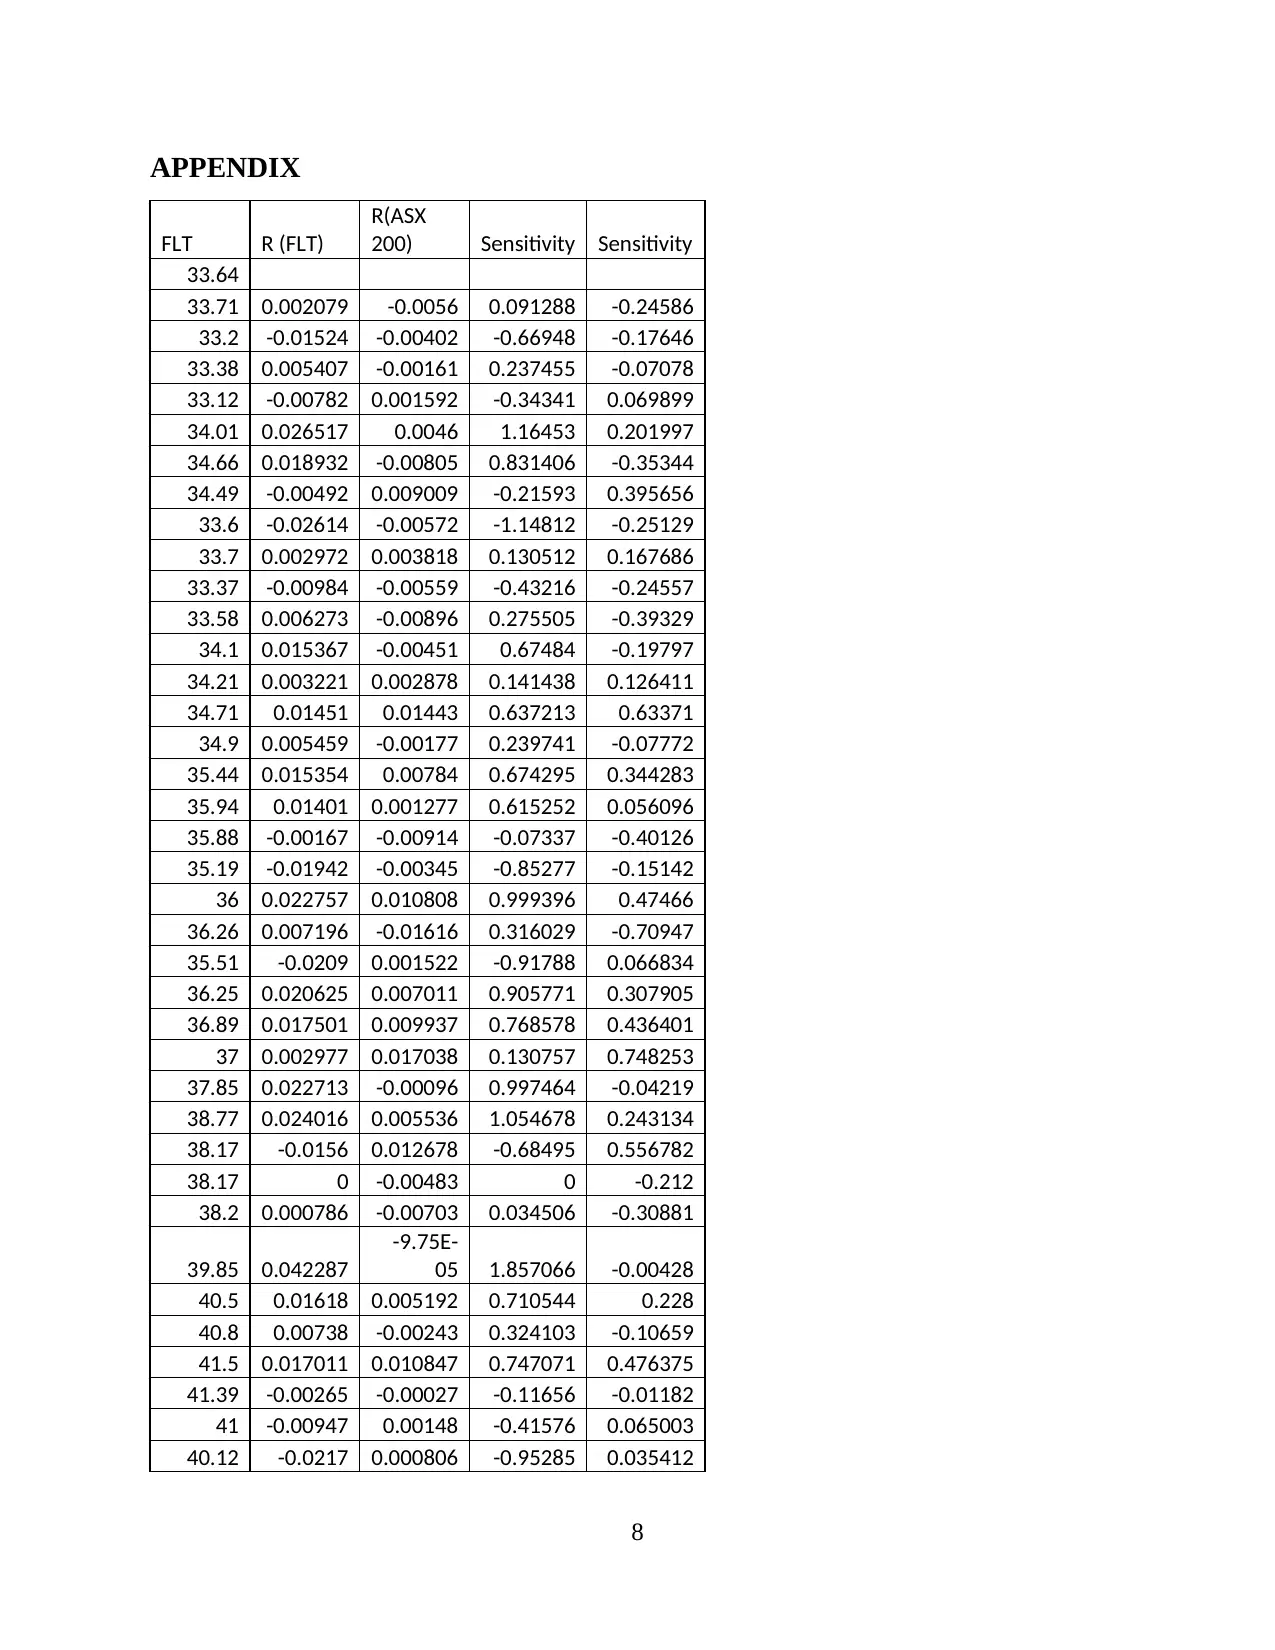
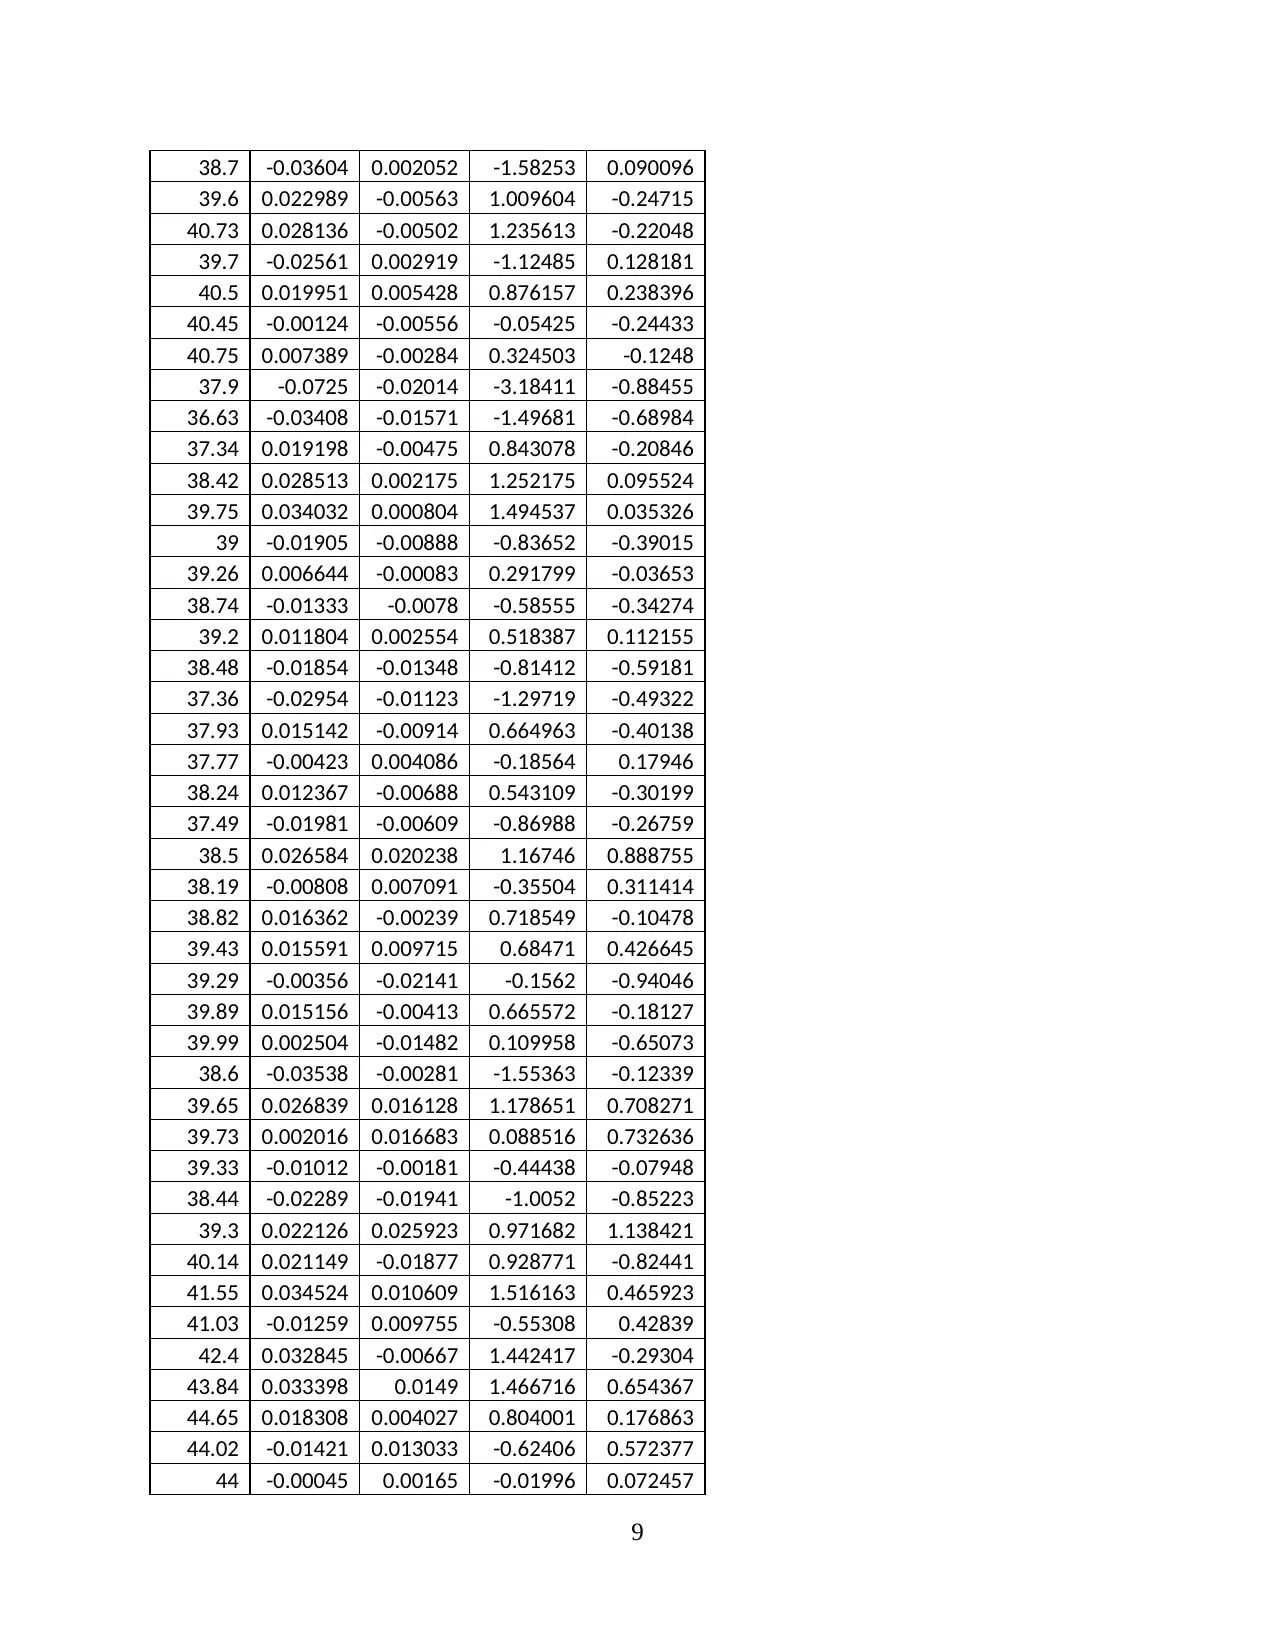
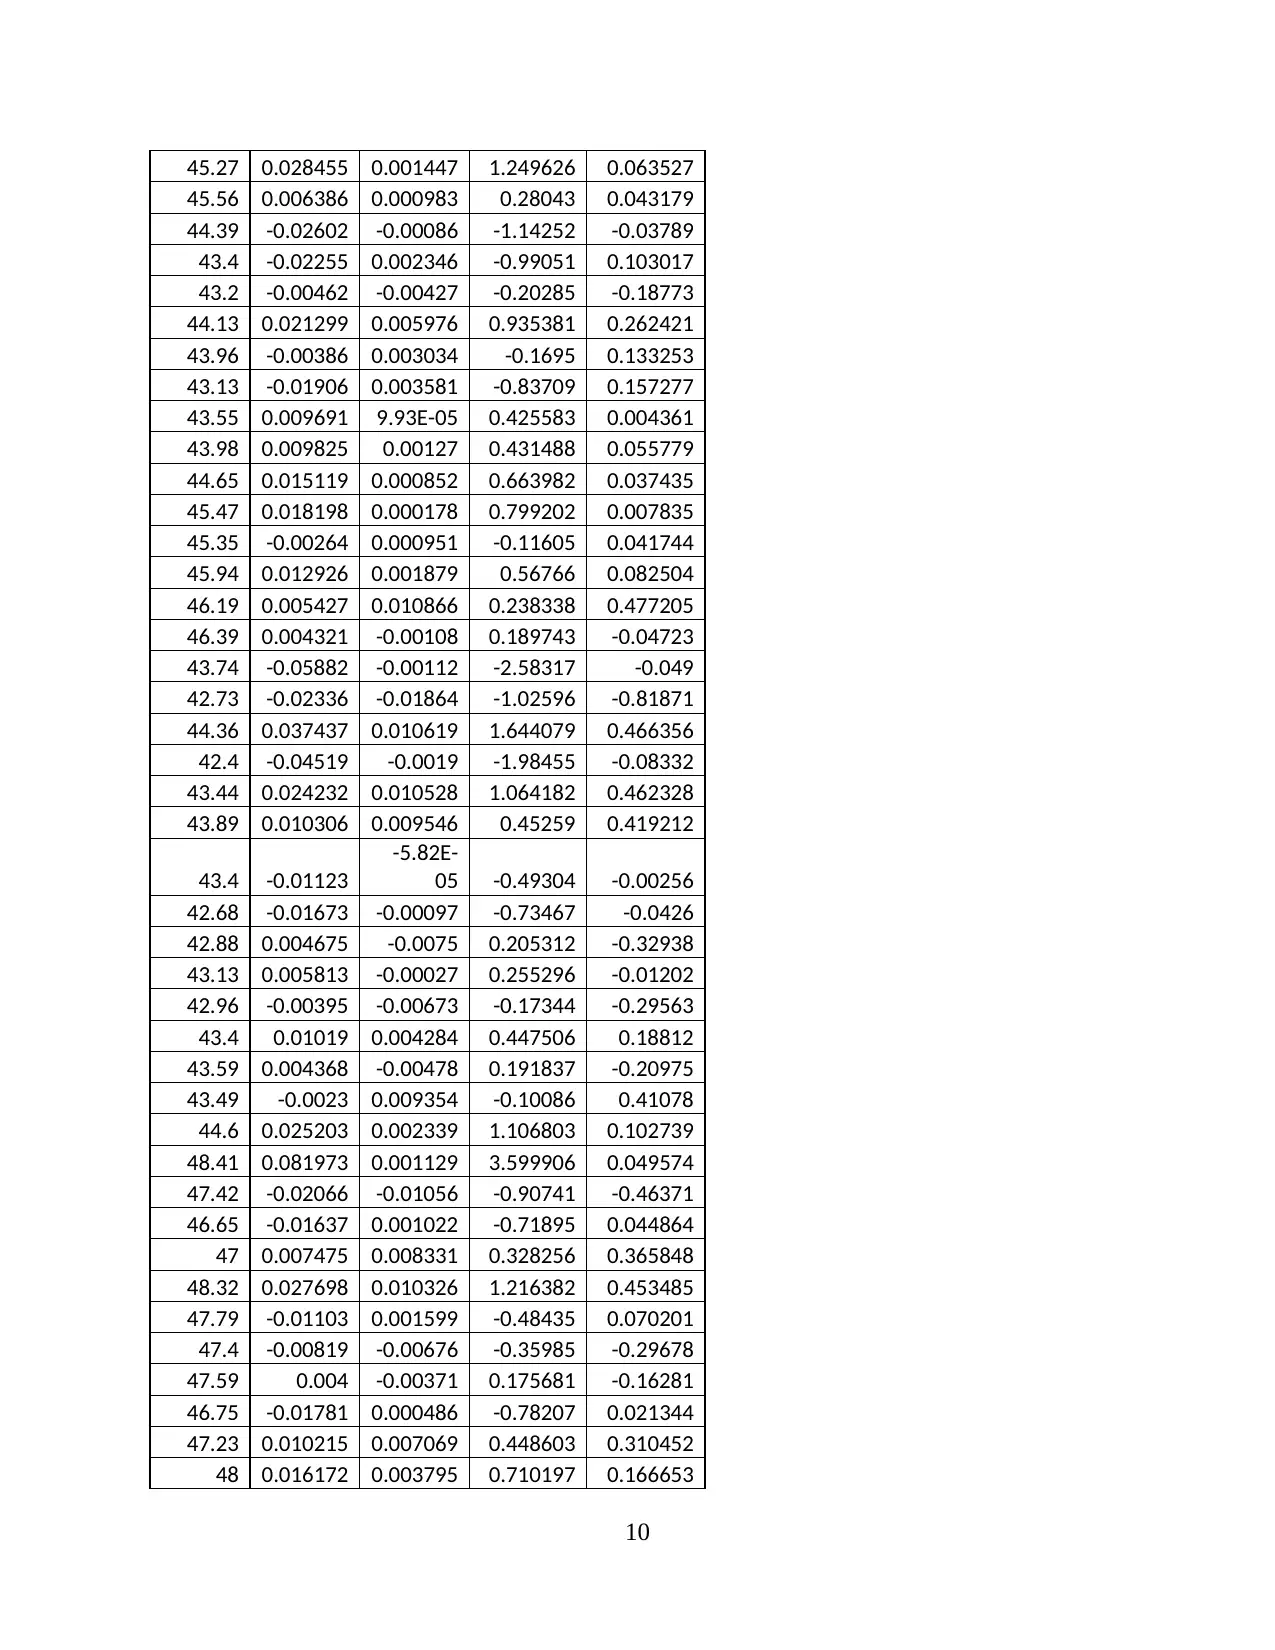
Sensitivity analysis:
Formula:
Current year dividend * (1+ expected growth rate)/ (expected return – expected growth
rate)
As listed in Appendix
Sensitivity analysis : It is a technique of analysing the uncertainty in the input values for
a given variable will impact the output values of a mathematical model. It is applied in different
fields such as business analysis , environmental studies, investment analysis, engineering etc.
The key application of sensitivity analysis its role in the decision making in an organisation
(Golez and Koudijs, 2018). It assists decision analysts in understanding the uncertainties,
benefits and pitfalls along with the scope of decision model.
6
2019 0.013839 0.01328519 0.013285
2020 0.013839 0.01328486 #VALUE!
2021 0.013839 0.01328454 #VALUE!
Sensitivity analysis:
Formula:
Current year dividend * (1+ expected growth rate)/ (expected return – expected growth
rate)
As listed in Appendix
Sensitivity analysis : It is a technique of analysing the uncertainty in the input values for
a given variable will impact the output values of a mathematical model. It is applied in different
fields such as business analysis , environmental studies, investment analysis, engineering etc.
The key application of sensitivity analysis its role in the decision making in an organisation
(Golez and Koudijs, 2018). It assists decision analysts in understanding the uncertainties,
benefits and pitfalls along with the scope of decision model.
6
REFERENCES
Books and Journals
Anwar, S., Fathoni, A. and Gagah, E., 2018. ANALYSIS OF THE EFFECT OF CURRENT
RATIO, TOTAL TURN OVER ASSETS, DEBT TO EQUITY RATIO AND NET
PROFIT MAGRIN ON CHANGES OF PROFIT WITH ON EQUITY RETURN AS
INTERVENING VARIABLES ON PHARMACEUTICAL COMPANIES LISTED IN
INDONESIA STOCK EXCHANGE (BEI) 2013-2017 PERIOD. Journal of
Management. 4(4).
Golez, B. and Koudijs, P., 2018. Four centuries of return predictability. Journal of Financial
Economics. 127(2). pp.248-263.
Payne, B. C. and et.al., 2018. A FINANCIAL PROFILE OF THOSE FIRMS WITH THE
LOWEST COST OF EQUITY FUNDS, AND A CANONICAL RANKING OF THE
RISK–RETURN FACTORS. Southeast Asia Review of Economics and Business. 1(1).
Weber, M., 2018. Cash flow duration and the term structure of equity returns. Journal of
Financial Economics. 128(3). pp.486-503.
7
⊘ This is a preview!⊘
Do you want full access?
Subscribe today to unlock all pages.
Trusted by 1+ million students worldwide
APPENDIX
FLT R (FLT)
R(ASX
200) Sensitivity Sensitivity
33.64
33.71 0.002079 -0.0056 0.091288 -0.24586
33.2 -0.01524 -0.00402 -0.66948 -0.17646
33.38 0.005407 -0.00161 0.237455 -0.07078
33.12 -0.00782 0.001592 -0.34341 0.069899
34.01 0.026517 0.0046 1.16453 0.201997
34.66 0.018932 -0.00805 0.831406 -0.35344
34.49 -0.00492 0.009009 -0.21593 0.395656
33.6 -0.02614 -0.00572 -1.14812 -0.25129
33.7 0.002972 0.003818 0.130512 0.167686
33.37 -0.00984 -0.00559 -0.43216 -0.24557
33.58 0.006273 -0.00896 0.275505 -0.39329
34.1 0.015367 -0.00451 0.67484 -0.19797
34.21 0.003221 0.002878 0.141438 0.126411
34.71 0.01451 0.01443 0.637213 0.63371
34.9 0.005459 -0.00177 0.239741 -0.07772
35.44 0.015354 0.00784 0.674295 0.344283
35.94 0.01401 0.001277 0.615252 0.056096
35.88 -0.00167 -0.00914 -0.07337 -0.40126
35.19 -0.01942 -0.00345 -0.85277 -0.15142
36 0.022757 0.010808 0.999396 0.47466
36.26 0.007196 -0.01616 0.316029 -0.70947
35.51 -0.0209 0.001522 -0.91788 0.066834
36.25 0.020625 0.007011 0.905771 0.307905
36.89 0.017501 0.009937 0.768578 0.436401
37 0.002977 0.017038 0.130757 0.748253
37.85 0.022713 -0.00096 0.997464 -0.04219
38.77 0.024016 0.005536 1.054678 0.243134
38.17 -0.0156 0.012678 -0.68495 0.556782
38.17 0 -0.00483 0 -0.212
38.2 0.000786 -0.00703 0.034506 -0.30881
39.85 0.042287
-9.75E-
05 1.857066 -0.00428
40.5 0.01618 0.005192 0.710544 0.228
40.8 0.00738 -0.00243 0.324103 -0.10659
41.5 0.017011 0.010847 0.747071 0.476375
41.39 -0.00265 -0.00027 -0.11656 -0.01182
41 -0.00947 0.00148 -0.41576 0.065003
40.12 -0.0217 0.000806 -0.95285 0.035412
8
Paraphrase This Document
Need a fresh take? Get an instant paraphrase of this document with our AI Paraphraser
38.7 -0.03604 0.002052 -1.58253 0.090096
39.6 0.022989 -0.00563 1.009604 -0.24715
40.73 0.028136 -0.00502 1.235613 -0.22048
39.7 -0.02561 0.002919 -1.12485 0.128181
40.5 0.019951 0.005428 0.876157 0.238396
40.45 -0.00124 -0.00556 -0.05425 -0.24433
40.75 0.007389 -0.00284 0.324503 -0.1248
37.9 -0.0725 -0.02014 -3.18411 -0.88455
36.63 -0.03408 -0.01571 -1.49681 -0.68984
37.34 0.019198 -0.00475 0.843078 -0.20846
38.42 0.028513 0.002175 1.252175 0.095524
39.75 0.034032 0.000804 1.494537 0.035326
39 -0.01905 -0.00888 -0.83652 -0.39015
39.26 0.006644 -0.00083 0.291799 -0.03653
38.74 -0.01333 -0.0078 -0.58555 -0.34274
39.2 0.011804 0.002554 0.518387 0.112155
38.48 -0.01854 -0.01348 -0.81412 -0.59181
37.36 -0.02954 -0.01123 -1.29719 -0.49322
37.93 0.015142 -0.00914 0.664963 -0.40138
37.77 -0.00423 0.004086 -0.18564 0.17946
38.24 0.012367 -0.00688 0.543109 -0.30199
37.49 -0.01981 -0.00609 -0.86988 -0.26759
38.5 0.026584 0.020238 1.16746 0.888755
38.19 -0.00808 0.007091 -0.35504 0.311414
38.82 0.016362 -0.00239 0.718549 -0.10478
39.43 0.015591 0.009715 0.68471 0.426645
39.29 -0.00356 -0.02141 -0.1562 -0.94046
39.89 0.015156 -0.00413 0.665572 -0.18127
39.99 0.002504 -0.01482 0.109958 -0.65073
38.6 -0.03538 -0.00281 -1.55363 -0.12339
39.65 0.026839 0.016128 1.178651 0.708271
39.73 0.002016 0.016683 0.088516 0.732636
39.33 -0.01012 -0.00181 -0.44438 -0.07948
38.44 -0.02289 -0.01941 -1.0052 -0.85223
39.3 0.022126 0.025923 0.971682 1.138421
40.14 0.021149 -0.01877 0.928771 -0.82441
41.55 0.034524 0.010609 1.516163 0.465923
41.03 -0.01259 0.009755 -0.55308 0.42839
42.4 0.032845 -0.00667 1.442417 -0.29304
43.84 0.033398 0.0149 1.466716 0.654367
44.65 0.018308 0.004027 0.804001 0.176863
44.02 -0.01421 0.013033 -0.62406 0.572377
44 -0.00045 0.00165 -0.01996 0.072457
9
45.27 0.028455 0.001447 1.249626 0.063527
45.56 0.006386 0.000983 0.28043 0.043179
44.39 -0.02602 -0.00086 -1.14252 -0.03789
43.4 -0.02255 0.002346 -0.99051 0.103017
43.2 -0.00462 -0.00427 -0.20285 -0.18773
44.13 0.021299 0.005976 0.935381 0.262421
43.96 -0.00386 0.003034 -0.1695 0.133253
43.13 -0.01906 0.003581 -0.83709 0.157277
43.55 0.009691 9.93E-05 0.425583 0.004361
43.98 0.009825 0.00127 0.431488 0.055779
44.65 0.015119 0.000852 0.663982 0.037435
45.47 0.018198 0.000178 0.799202 0.007835
45.35 -0.00264 0.000951 -0.11605 0.041744
45.94 0.012926 0.001879 0.56766 0.082504
46.19 0.005427 0.010866 0.238338 0.477205
46.39 0.004321 -0.00108 0.189743 -0.04723
43.74 -0.05882 -0.00112 -2.58317 -0.049
42.73 -0.02336 -0.01864 -1.02596 -0.81871
44.36 0.037437 0.010619 1.644079 0.466356
42.4 -0.04519 -0.0019 -1.98455 -0.08332
43.44 0.024232 0.010528 1.064182 0.462328
43.89 0.010306 0.009546 0.45259 0.419212
43.4 -0.01123
-5.82E-
05 -0.49304 -0.00256
42.68 -0.01673 -0.00097 -0.73467 -0.0426
42.88 0.004675 -0.0075 0.205312 -0.32938
43.13 0.005813 -0.00027 0.255296 -0.01202
42.96 -0.00395 -0.00673 -0.17344 -0.29563
43.4 0.01019 0.004284 0.447506 0.18812
43.59 0.004368 -0.00478 0.191837 -0.20975
43.49 -0.0023 0.009354 -0.10086 0.41078
44.6 0.025203 0.002339 1.106803 0.102739
48.41 0.081973 0.001129 3.599906 0.049574
47.42 -0.02066 -0.01056 -0.90741 -0.46371
46.65 -0.01637 0.001022 -0.71895 0.044864
47 0.007475 0.008331 0.328256 0.365848
48.32 0.027698 0.010326 1.216382 0.453485
47.79 -0.01103 0.001599 -0.48435 0.070201
47.4 -0.00819 -0.00676 -0.35985 -0.29678
47.59 0.004 -0.00371 0.175681 -0.16281
46.75 -0.01781 0.000486 -0.78207 0.021344
47.23 0.010215 0.007069 0.448603 0.310452
48 0.016172 0.003795 0.710197 0.166653
10
⊘ This is a preview!⊘
Do you want full access?
Subscribe today to unlock all pages.
Trusted by 1+ million students worldwide
1 out of 44
Related Documents


Your All-in-One AI-Powered Toolkit for Academic Success.
+13062052269
info@desklib.com
Available 24*7 on WhatsApp / Email
![[object Object]](/_next/static/media/star-bottom.7253800d.svg)
Unlock your academic potential
Copyright © 2020–2026 A2Z Services. All Rights Reserved. Developed and managed by ZUCOL.