Financial Performance Analysis of Qantas Airways
Added on 2023-06-07
20 Pages4490 Words470 Views
Running Head: FINANCE 0
Finance
Finance
FINANCE 1
Table of Contents
Introduction................................................................................................................................2
Financial Performance Analysis................................................................................................4
Solvency and Liquidity...........................................................................................................5
Solvency ratios.......................................................................................................................5
Debt to equity......................................................................................................................6
Total debt to Total assets....................................................................................................7
Interest coverage Ratio.......................................................................................................8
Return on Financial leverage..............................................................................................9
Liquidity ratios.....................................................................................................................10
Current Ratio.....................................................................................................................11
Quick Ratio.......................................................................................................................11
Working capital.................................................................................................................13
Operating cash flow with the current liabilities................................................................14
Operating cash flow with the capital expenditures...........................................................14
Free cash flow...................................................................................................................14
Quality of the financial statements...........................................................................................15
References................................................................................................................................17
FINANCE 2
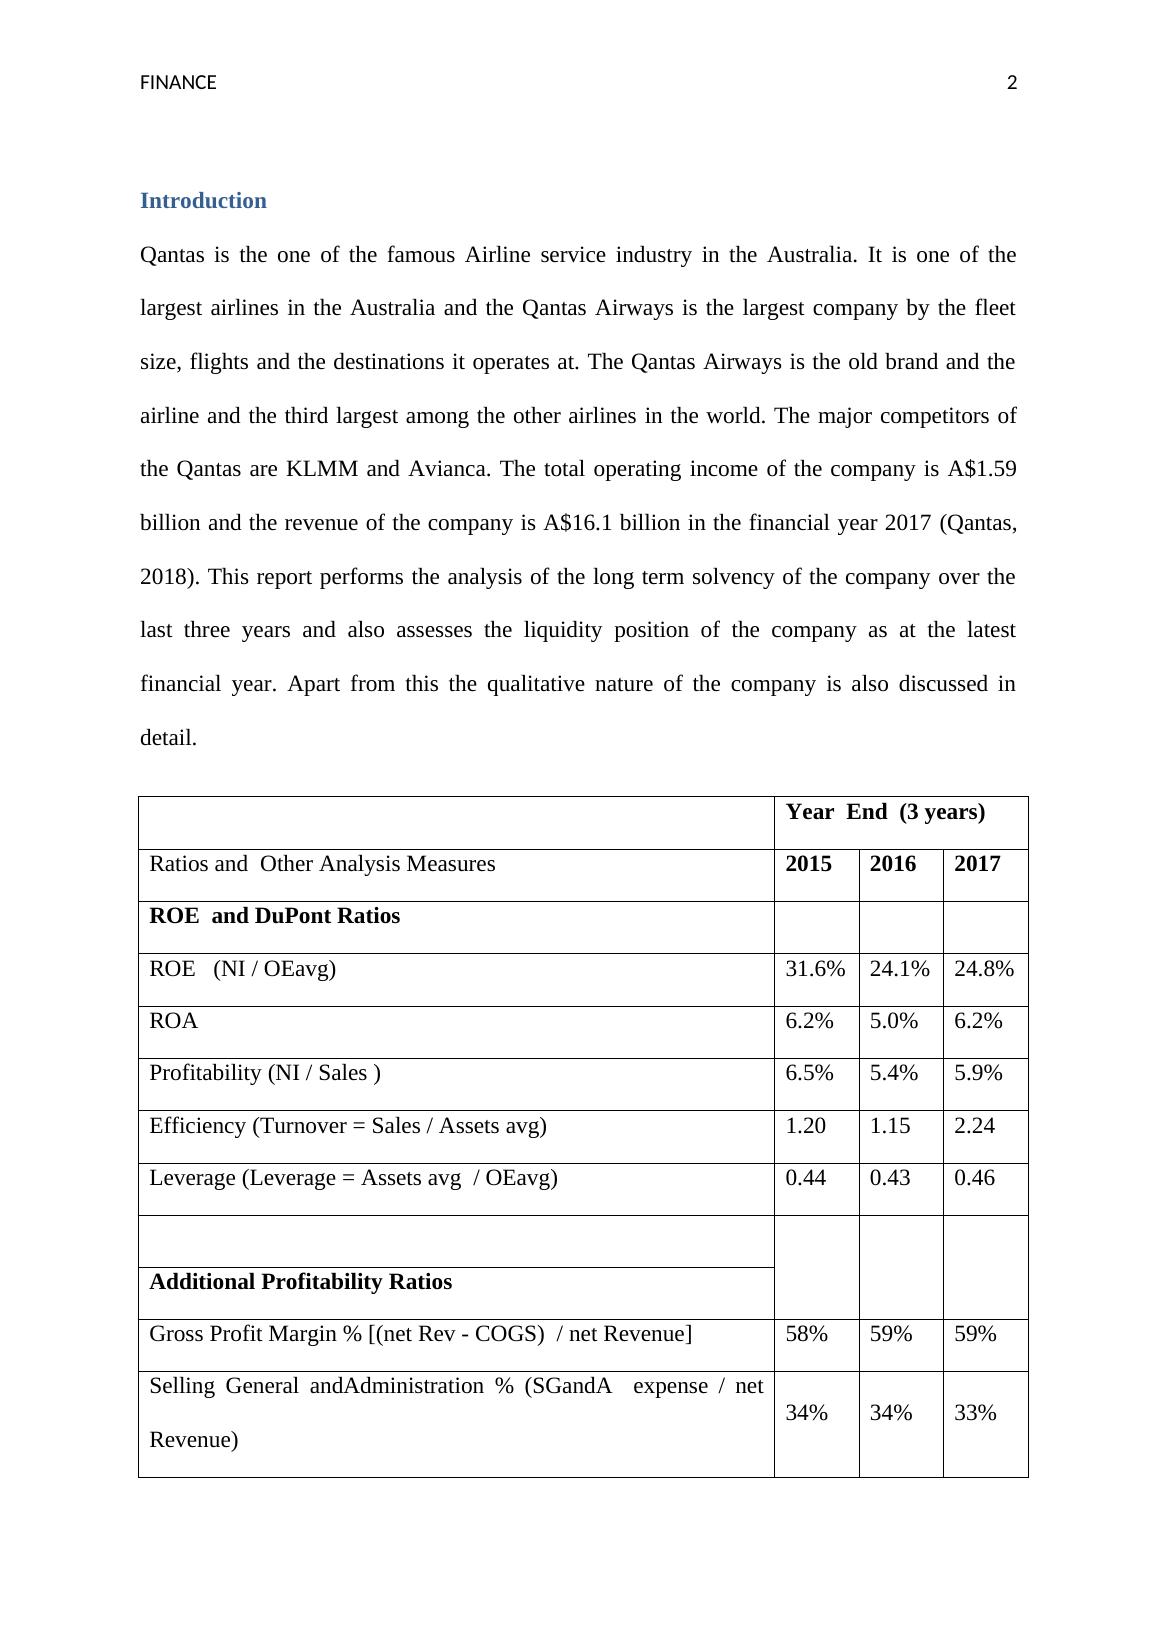
Introduction
Qantas is the one of the famous Airline service industry in the Australia. It is one of the
largest airlines in the Australia and the Qantas Airways is the largest company by the fleet
size, flights and the destinations it operates at. The Qantas Airways is the old brand and the
airline and the third largest among the other airlines in the world. The major competitors of
the Qantas are KLMM and Avianca. The total operating income of the company is A$1.59
billion and the revenue of the company is A$16.1 billion in the financial year 2017 (Qantas,
2018). This report performs the analysis of the long term solvency of the company over the
last three years and also assesses the liquidity position of the company as at the latest
financial year. Apart from this the qualitative nature of the company is also discussed in
detail.
Year End (3 years)
Ratios and Other Analysis Measures 2015 2016 2017
ROE and DuPont Ratios
ROE (NI / OEavg) 31.6% 24.1% 24.8%
ROA 6.2% 5.0% 6.2%
Profitability (NI / Sales ) 6.5% 5.4% 5.9%
Efficiency (Turnover = Sales / Assets avg) 1.20 1.15 2.24
Leverage (Leverage = Assets avg / OEavg) 0.44 0.43 0.46
Additional Profitability Ratios
Gross Profit Margin % [(net Rev - COGS) / net Revenue] 58% 59% 59%
Selling General andAdministration % (SGandA expense / net
Revenue)
34% 34% 33%
FINANCE 3
Important Expense Percentage* (Important Expense / net
Revenue)
8% 9% 9%
Additional Efficiency Ratios
AR Turnover (Sales / ARavg) 11.49 11.17 23.69
Days Receivables Outstanding (DRO) [ARavg / (Sales /365)] 18.26 19.69 9.97
Inventory Turnover (COGS / Inventoryavg) 4.81 4.61 9.73
Days Inventory (DI) [Inventoryavg / (COGS/365)] 18.55 19.79 18.76
AP Turnover (Purchases / APavg) 0.82 0.74 1.49
Days Payables Outstanding (DPO) [365 / (Purchases / Accts
Payableavg)]
447.4
7
491.7
8
245.3
6
CASH CONVERSION CYCLE (DI - DPO + DRO)
-
410.6
7
-
452.3
0
-
216.6
4
PPE Turnover (Sales / Net PPEavg) 0.16 0.20 0.65
Additional Leverage Ratios
Debt-to-Equity (total Liabilities / total OE) 0.94 0.89 1.10
Times Interest Earned (Earnings before Interest Expense and
Taxes / Interest Exp)
5.01 5.03 6.05
Return on Financial Leverage (ROE - ROA) 25.5% 19.2% 18.5%
LT Debt-to-Assets (LT Debt, including current portion / total
Assets )
0.60 0.59 0.76
Cash Liquidity and Cash Sources and Uses
Working Capital (CA - CL) - - -
End of preview
Want to access all the pages? Upload your documents or become a member.
Related Documents
Hospitality Finance And Revenue (pdf)lg...
|15
|3343
|18
MBA Accounting Ratios for 2016 and 2017lg...
|4
|679
|83
Report | Comparison Of NEXT Plc & Morrison | Profitability, Liquiditylg...
|14
|2058
|80
Financial Performance Analysis of Barkes Computerslg...
|12
|3137
|293
International Finance: Proposal Evaluation and Cost of Capitallg...
|14
|3865
|88
Financial and Economical Interpretation and Communication - Qantas Airwayslg...
|3
|1294
|166