logo

Comparison of VAS Results at Rest and During Breath for Three Groups

35 Pages7484 Words412 Views
   

Added on  2023-06-01

About This Document

The aim of this research study was to investigate the comparison between VAS results at rest and during breath for three groups; 1, 2 and 3. To make such comparisons, descriptive statistics and independent samples t tests were employed. We tried to answer the research question on whether there existed differences in VAS results at rest and during breath among the three groups under study.

Comparison of VAS Results at Rest and During Breath for Three Groups

   Added on 2023-06-01

ShareRelated Documents
Introduction.
The aim of this research study was to investigate the comparison between VAS results at rest and
during breath for three groups; 1, 2 and 3. To make such comparisons, descriptive statistics and
independent samples t tests were employed.
We tried to answer the research question on whether there existed differences in VAS results at
rest and during breath among the three groups under study.
The hypothesis that guided our study was;
H 0 :Thereis no differenceVAS results at rest duringbreath amongthe three groups .
H 1:There is difference VAS results at rest during breath among thethree groups .
Comparison of VAS Results at Rest and During Breath for Three Groups_1
Descriptive statistics
Comparison between VAS score means at Q 15 min
The figure below shows the comparison between VAS score means at rest and during breath for
groups 1, 2 and 3 for Q 15 minutes. The results show that group 2 has the highest means for VAS
at rest and during breath, followed by group 1 then group 3.
Comparison between VAS score means at Q 30 min
The results in the figure show that group 2 has the highest means for VAS at rest and during
breath, followed by group 1 then group 3.
VAS rest VAS DB VAS rest VAS DB VAS rest VAS DB
1 2 3
0
0.5
1
1.5
2
2.5
Comparison between VAS score
means
group
mean
Comparison of VAS Results at Rest and During Breath for Three Groups_2
V A S r e s t V A S D B V A S r e s t V A S D B V A S r e s t V A S D B
1 2 3
0.1
0.8 0.7
2
0
0.25
Group
mean
Comparison between VAS score means at Q 45 min
The results in the figure show that group 2 has the highest means for VAS at rest and during
breath, followed by group 1 then group 3.
V A S r e s t V A S D B V A S r e s t V A S D B V A S r e s t V A S D B
1 2 3
0.05
0.4 0.5
1.75
0
0.2
Mean
group
Mean
Comparison of VAS Results at Rest and During Breath for Three Groups_3
Comparison between VAS score means at Q 60 min
VAS rest VAS DB VAS rest VAS DB VAS rest VAS DB
1 2 3
0.2
0.55 0.45
1.75
0.15
0.5
Mean
Mean
The results in the figure show that group 2 has the highest means for VAS at rest and during
breath, followed by group 1 then group 3.
Comparison between VAS score means at Q 2 Hrs.
V A S r e s t V A S D B V A S r e s t V A S D B V A S r e s t V A S D B
1 2 3
0.05
0.6
0.1
1
0.05
0.3
Mean
The results in the figure show that group 2 has the highest means for VAS at rest and during
breath, followed by group 1 then group 3.
Comparison of VAS Results at Rest and During Breath for Three Groups_4
Comparison between VAS score means at Q 4 Hrs.
The results in the figure show that group 1 has the highest means for VAS at rest and during
breath, followed by group 2 then group 3.
VAS rest VAS DB VAS rest VAS DB VAS rest VAS DB
1 2 3
0
0.1
0.2
0.3
0.4
0.5
0.6
0.7
Mean
Comparison between VAS score means at Q 8 Hrs.
The results in the figure show that group 2 has the highest means for VAS at rest and during
breath, followed by group 1 then group 3.
VAS rest VAS DB VAS rest VAS DB VAS rest VAS DB
1 2 3
0
0.1
0.2
0.3
0.4
0.5
0.6
0.7
0.8
0.9
Mean
Comparison of VAS Results at Rest and During Breath for Three Groups_5
Comparison between VAS score means at Q 12 Hrs.
The results in the figure show that group 2 has the highest means for VAS at rest and during
breath, followed by group 1 then group 3.
VAS rest VAS DB VAS rest VAS DB VAS rest VAS DB
1 2 3
0
0.1
0.2
0.3
0.4
0.5
0.6
0.7
0.8
0.9
Mean
Comparison between VAS score means at Q 18 Hrs.
The results in the figure show that group 1 has the highest means for VAS at rest and during
breath, followed by group 2 then group 3.
V A S r e s t V A S D B V A S r e s t V A S D B V A S r e s t V A S D B
1 2 3
0.25
1.15
0.1
0.6
0 0.1
Mean
Comparison of VAS Results at Rest and During Breath for Three Groups_6
Comparison between VAS score means at Q 24 Hrs.
The results in the figure show that group 1 has the highest means for VAS at rest and during
breath, followed by group 2 then group 3.
V A S r e s t V A S D B V A S r e s t V A S D B V A S r e s t V A S D B
1 2 3
0.15
1.2
0.35
0.9
0.25
0.8
Mean
Comparison between VAS score means at Q 24 Hrs.
The results in the figure show that group 1 has the highest means for VAS at rest and during
breath, followed by group 2 then group 3.
V A S r e s t V A S D B V A S r e s t V A S D B V A S r e s t V A S D B
1 2 3
0.16
1.47
0.15
0.75
0.1
0.6
Mean
Comparison of VAS Results at Rest and During Breath for Three Groups_7
Comparison between VAS score means at Q 24 Hrs.
The results in the figure show that group 1 has the highest means for VAS at rest and during
breath, followed by groups 2 and 3.
V A S r e s t V A S D B V A S r e s t V A S D B V A S r e s t V A S D B
1 2 3
0.25
1.25
0.05
0.35
0.05
0.35
Mean
Comparison of VAS Results at Rest and During Breath for Three Groups_8

End of preview

Want to access all the pages? Upload your documents or become a member.

Related Documents
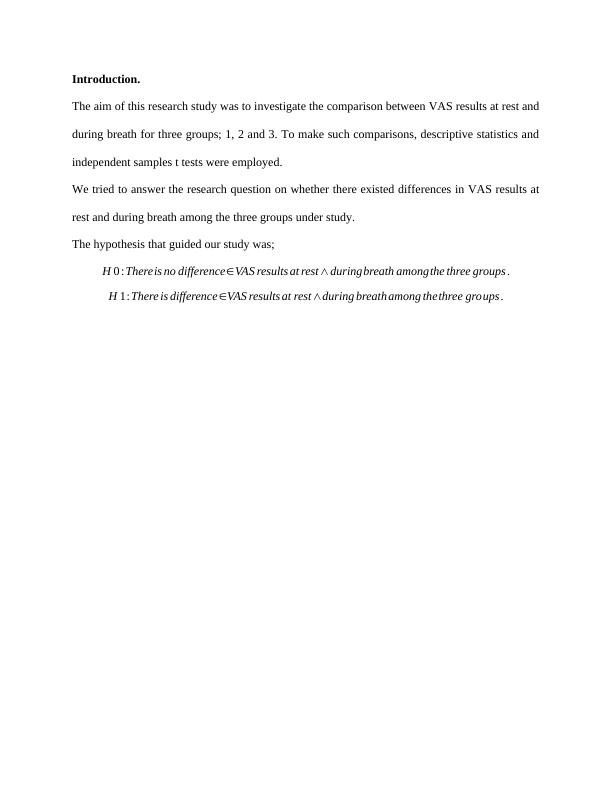
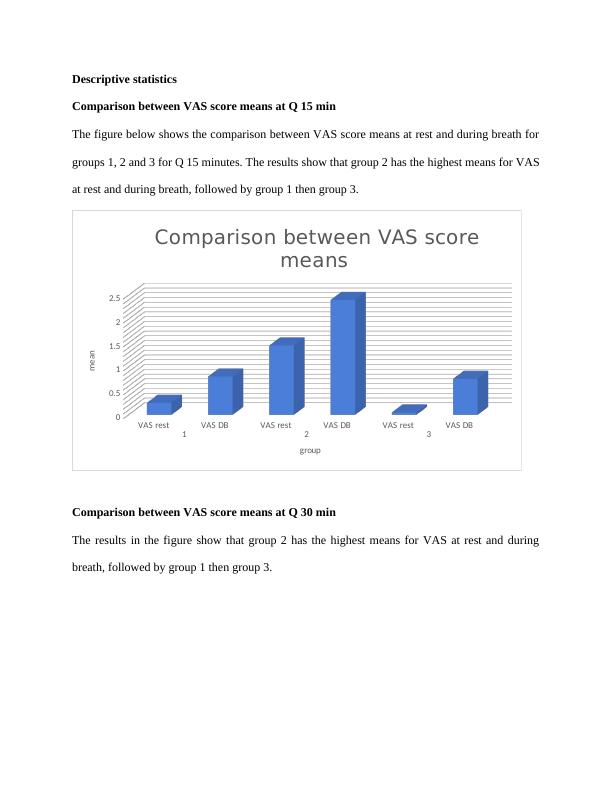
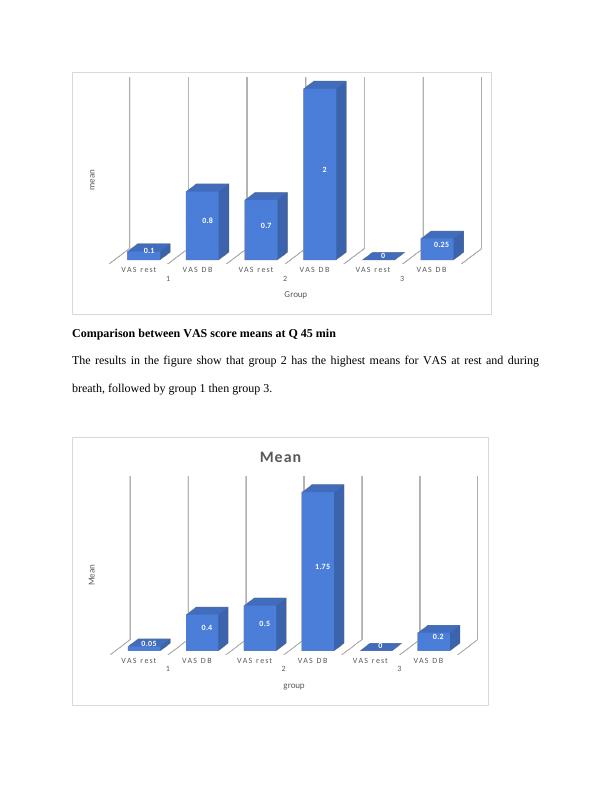
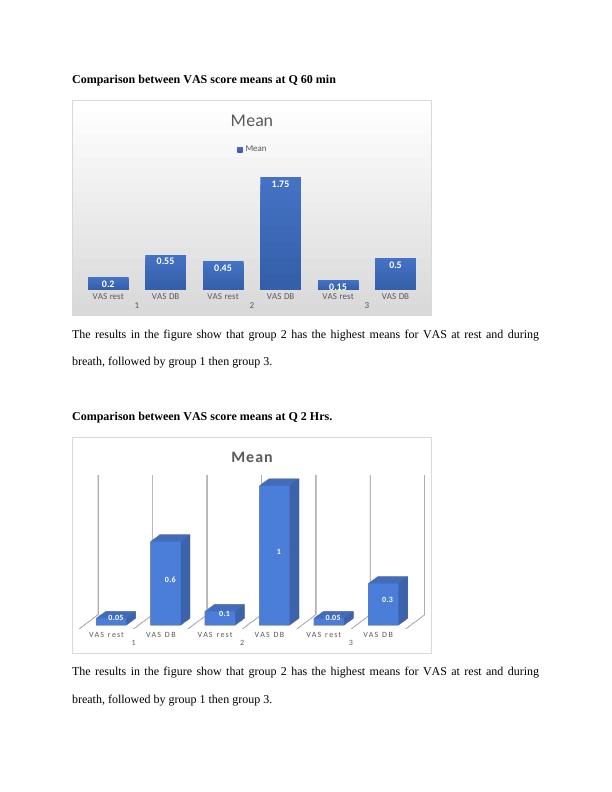
Descriptive statistics Comparison of VAS Results at Rest and During Breath for Three Groups
|35
|7068
|71

Statistics for Business Decisions - Desklib
|6
|775
|444

Data Analysis: Assignment
|16
|2057
|325

Statistics Exam: Frequency Distribution, Regression Analysis, ANOVA, and Sales Data
|7
|1353
|141

Statistics for Business Decision Making
|7
|985
|83

Statistics: ANOVA, Regression Analysis and Frequency Distribution Table
|5
|939
|123