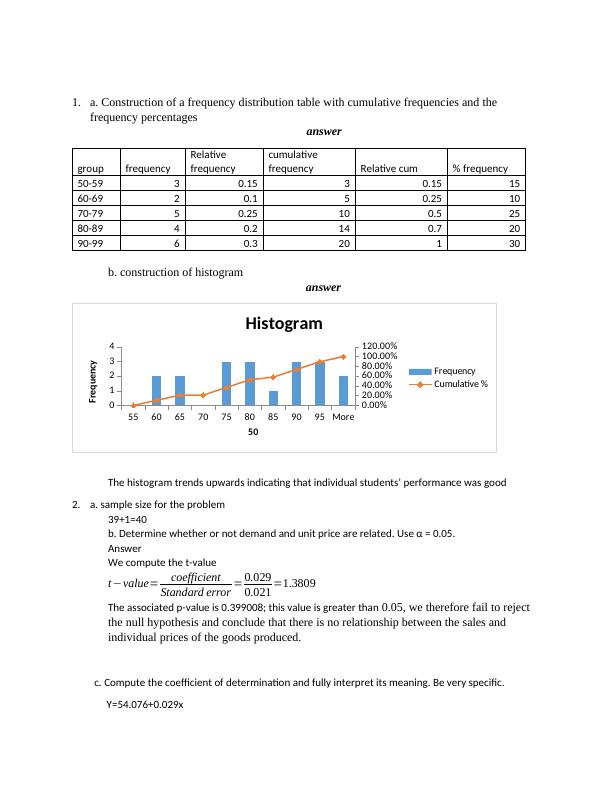
Statistics: ANOVA, Regression Analysis and Frequency Distribution Table
Added on 2023-06-07
5 Pages939 Words123 Views
End of preview
Want to access all the pages? Upload your documents or become a member.
Statistics Exam: Frequency Distribution, Regression Analysis, ANOVA, and Sales Data
|7
|1353
|141
Data Analysis for Desklib Online Library
|6
|725
|444
Statistics for Business Decisions - Desklib
|6
|836
|321
Statistics Assignment Solutions | Desklib
|8
|1150
|326
Statistics for Business Decision Making
|7
|985
|83
Statistics: ANOVA, Regression Analysis and Hypothesis Testing
|10
|1103
|376