2201AFE Corporate Finance: Wesfarmers Stock Analysis Case Study
VerifiedAdded on 2023/06/12
|9
|1427
|498
Case Study
AI Summary
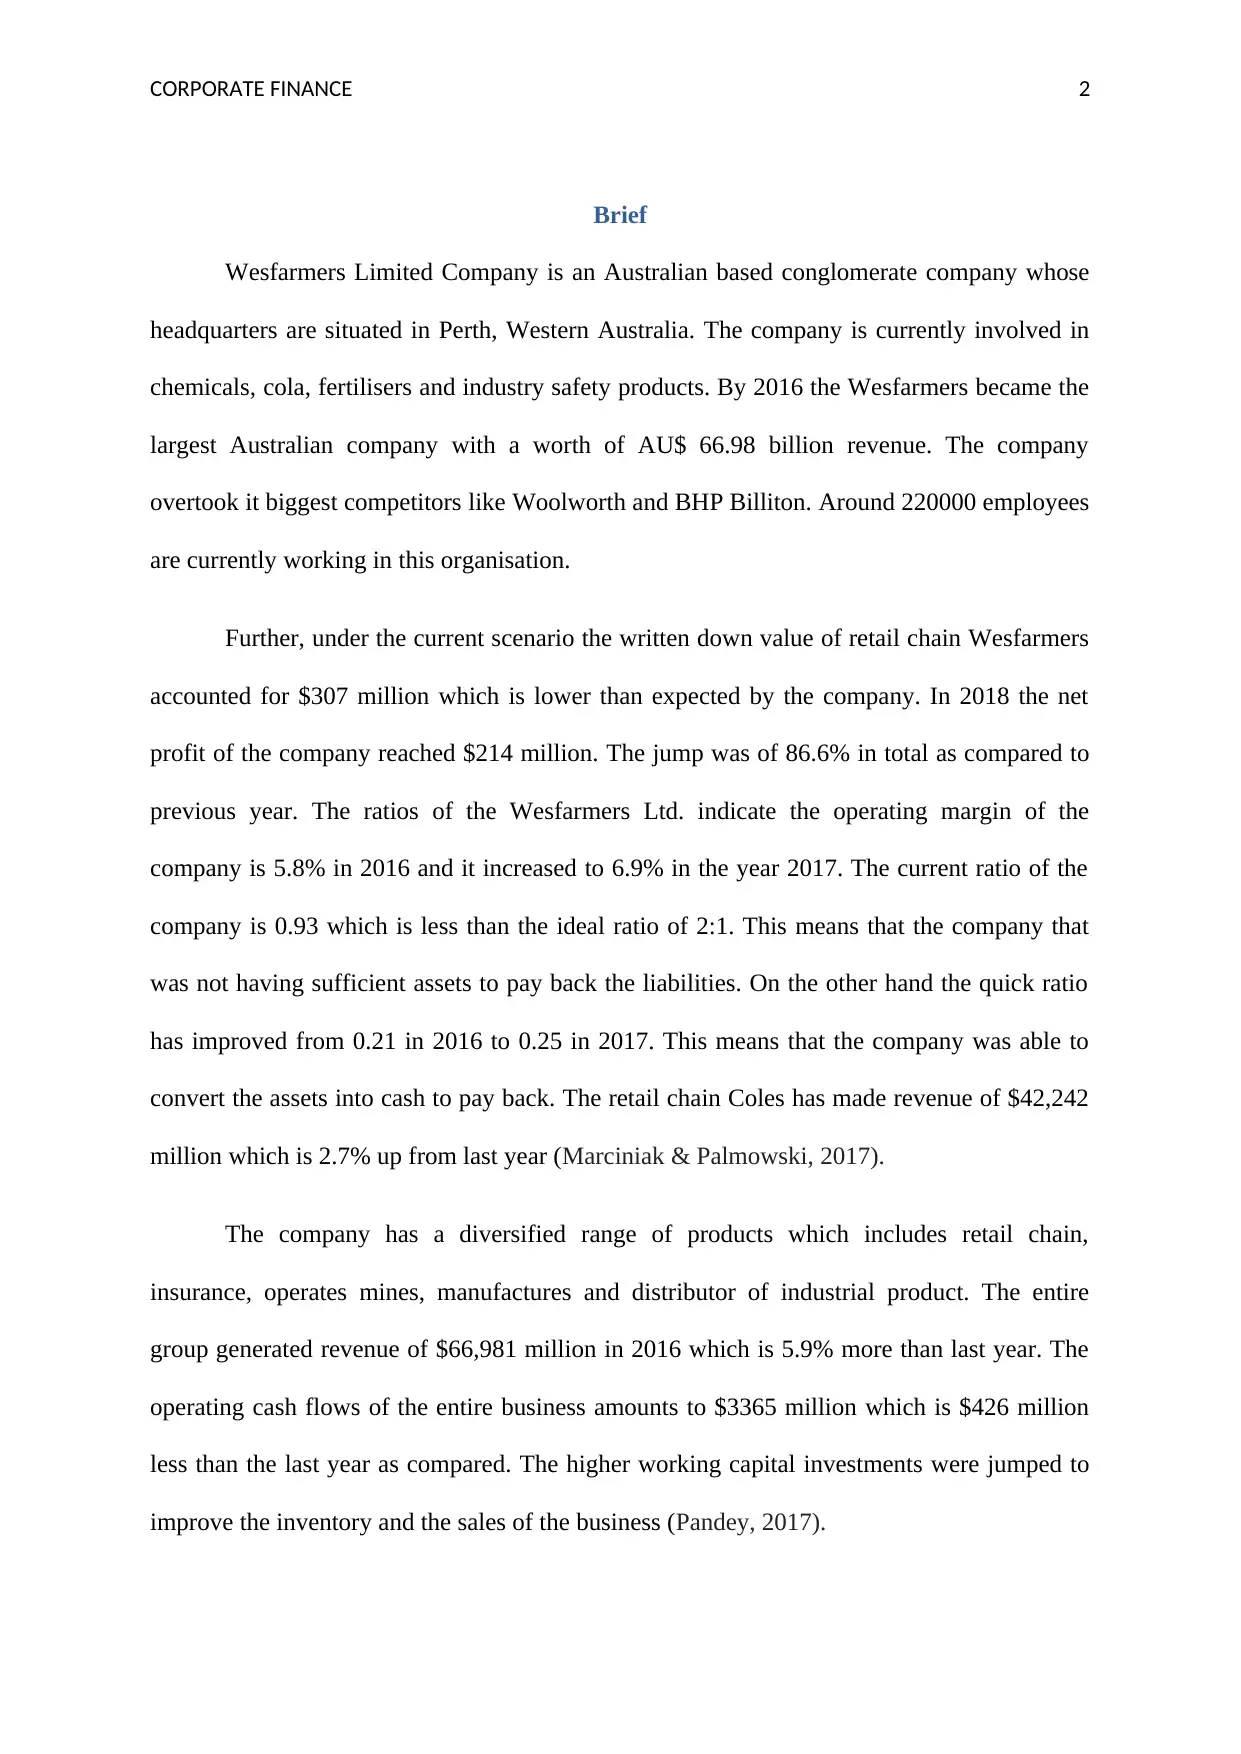
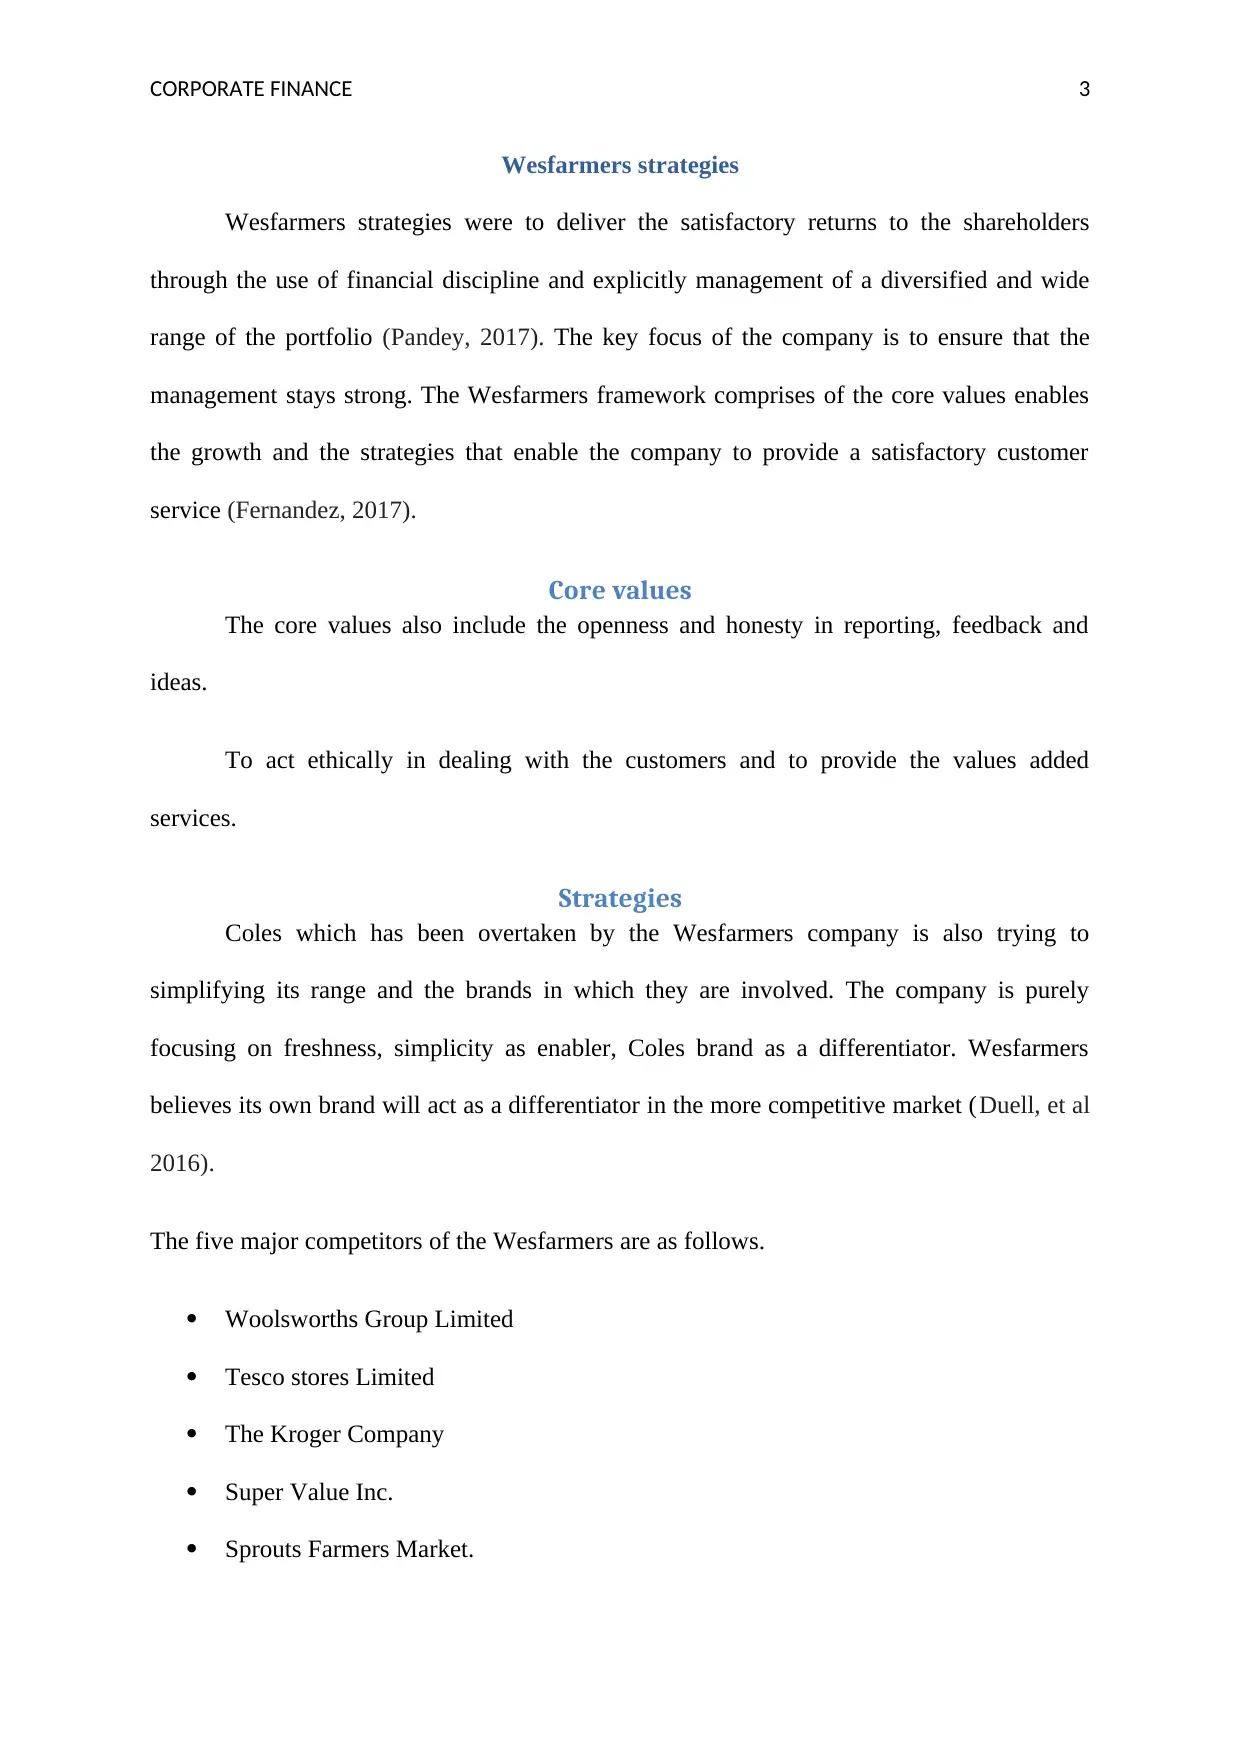
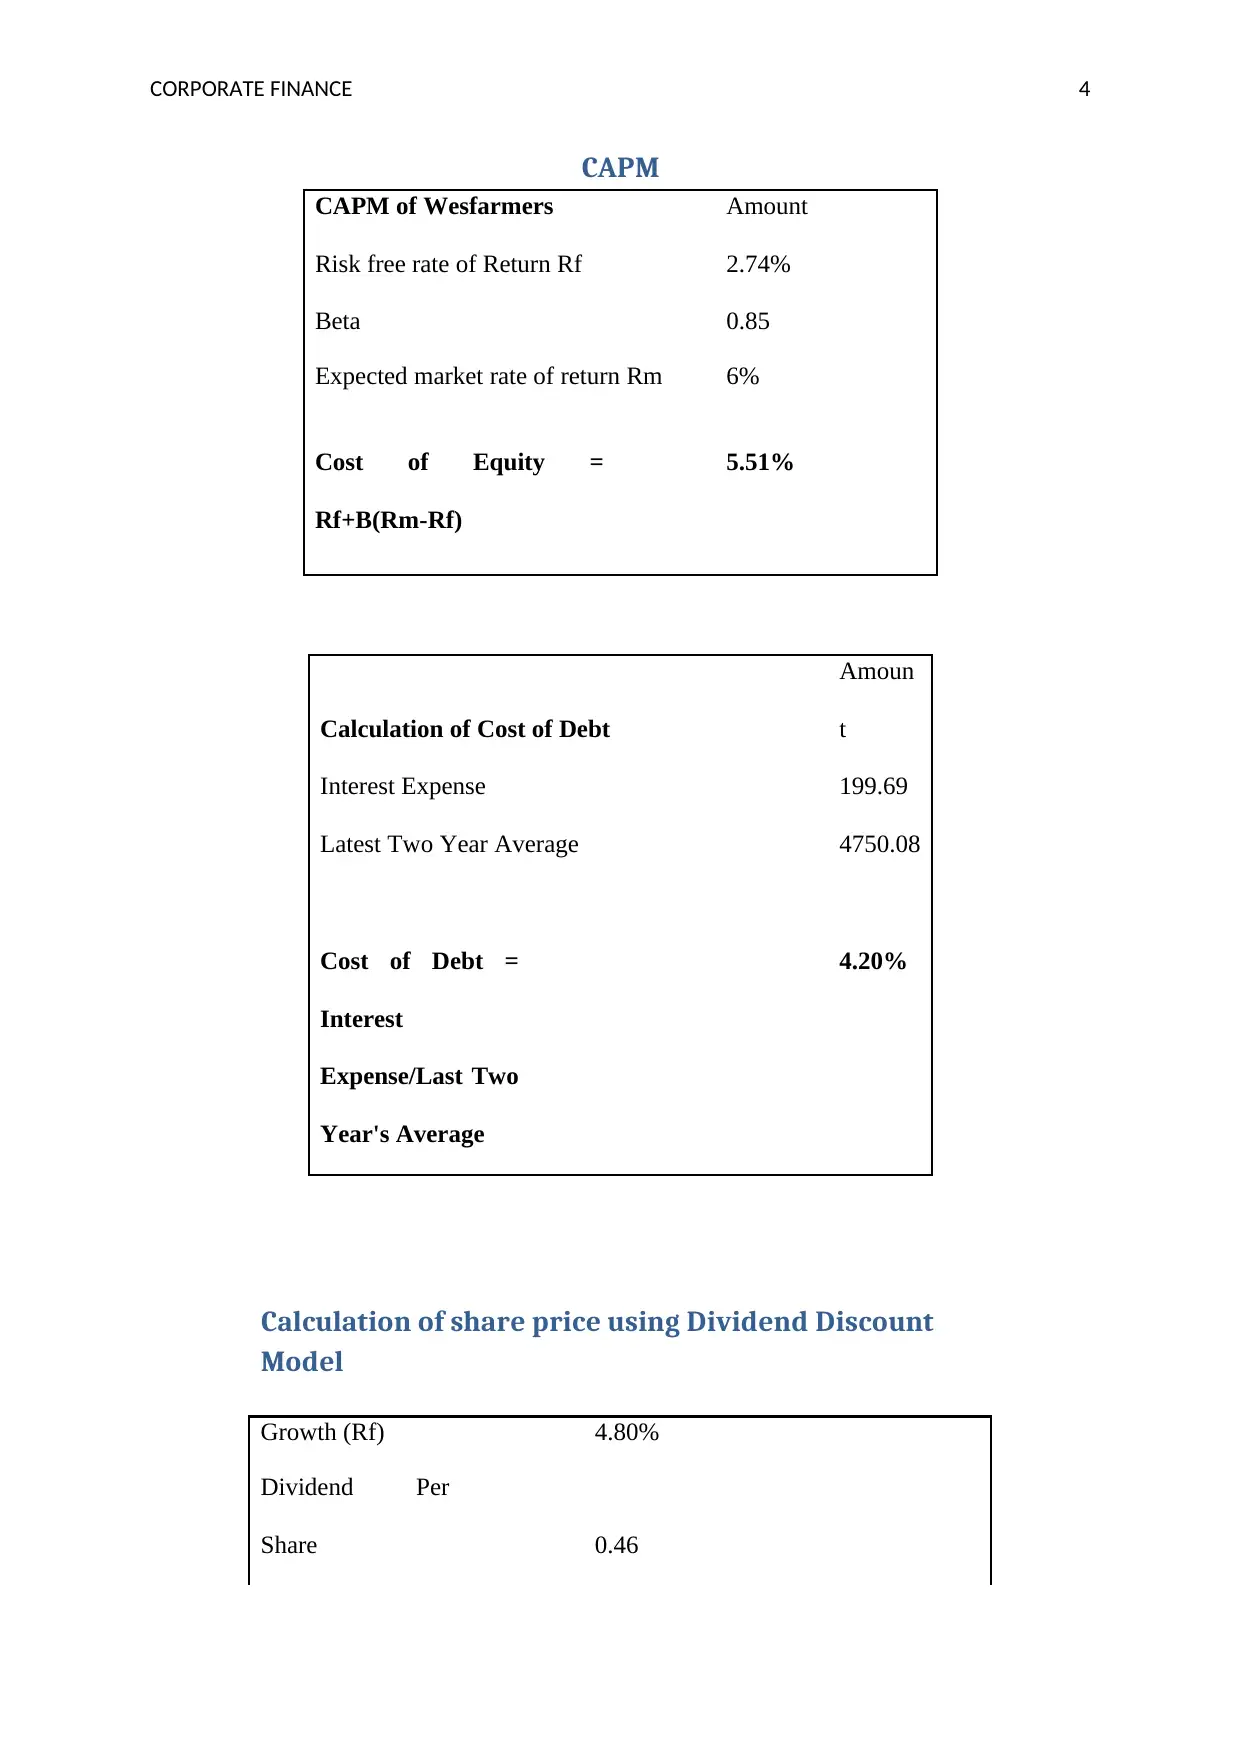
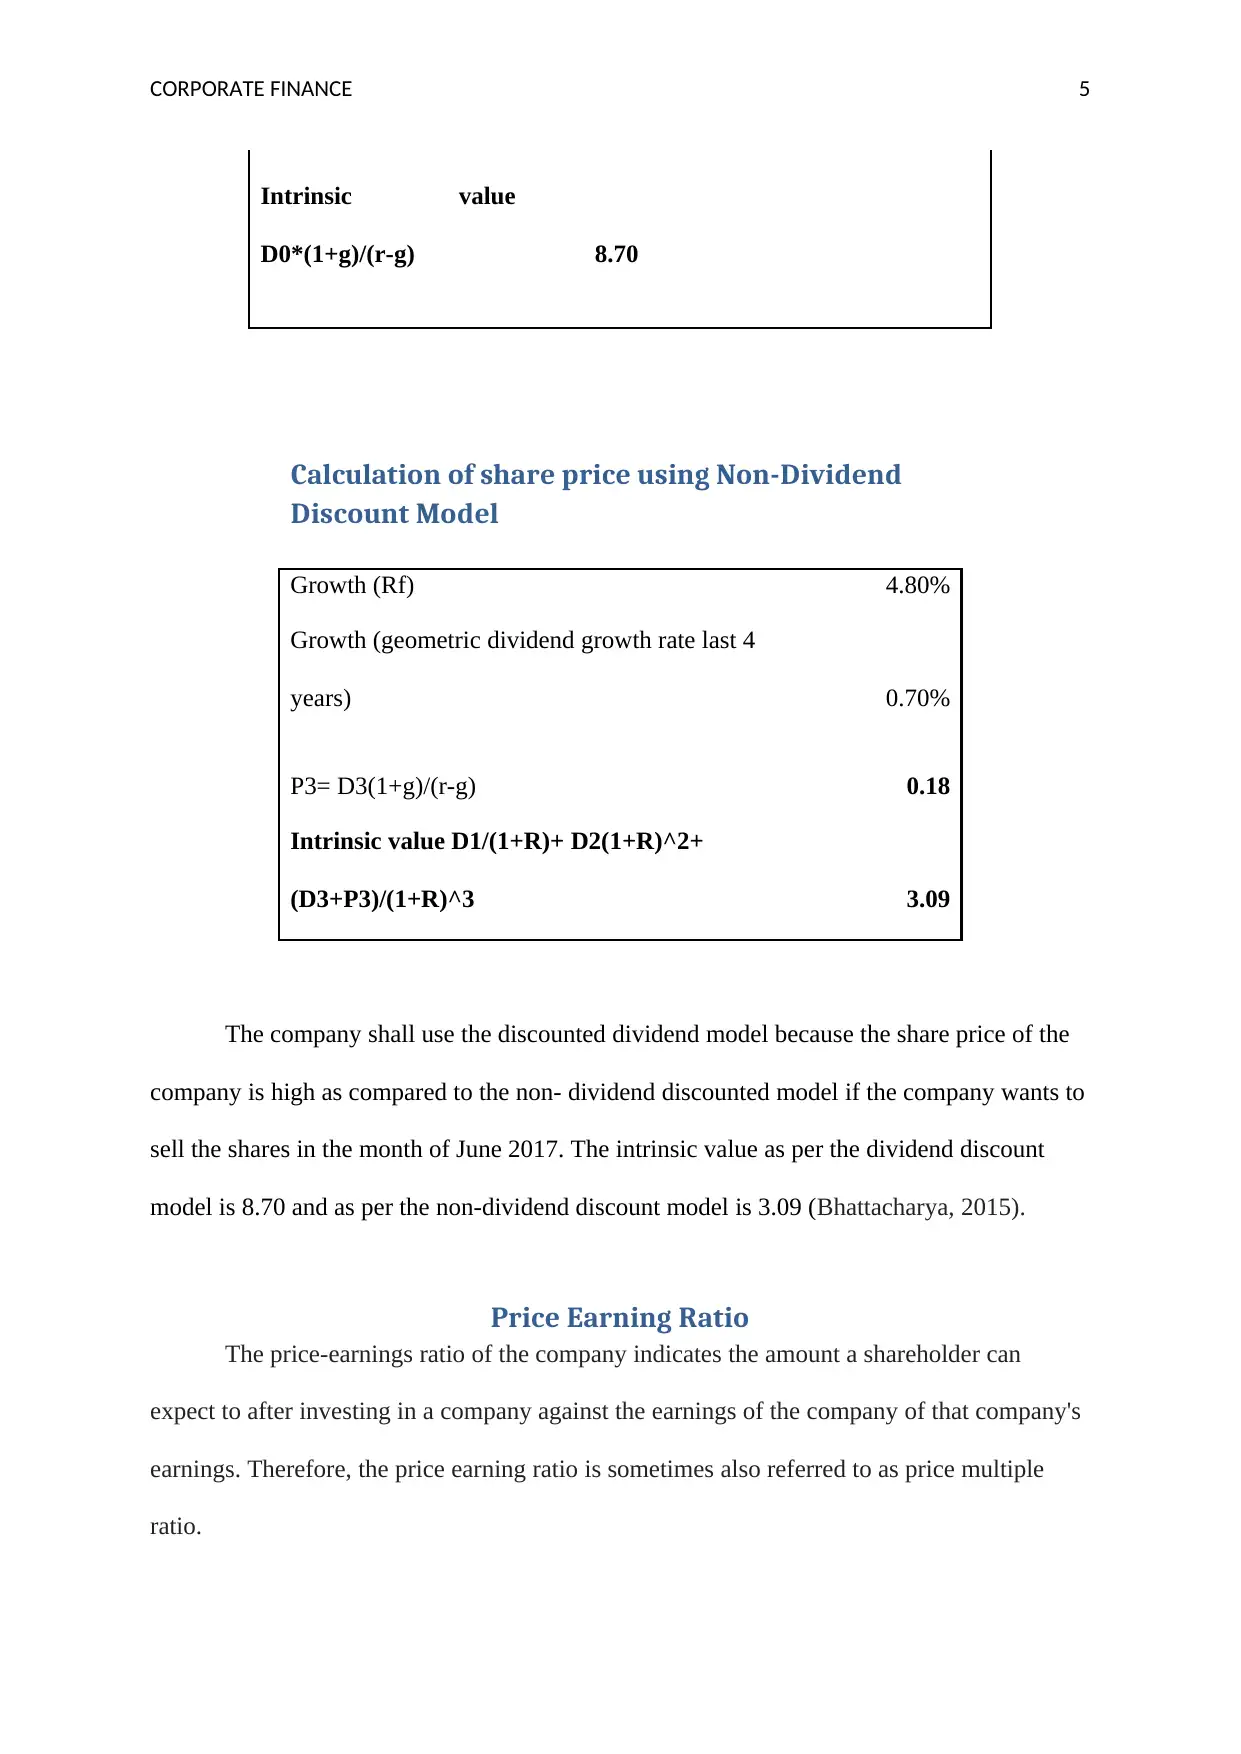
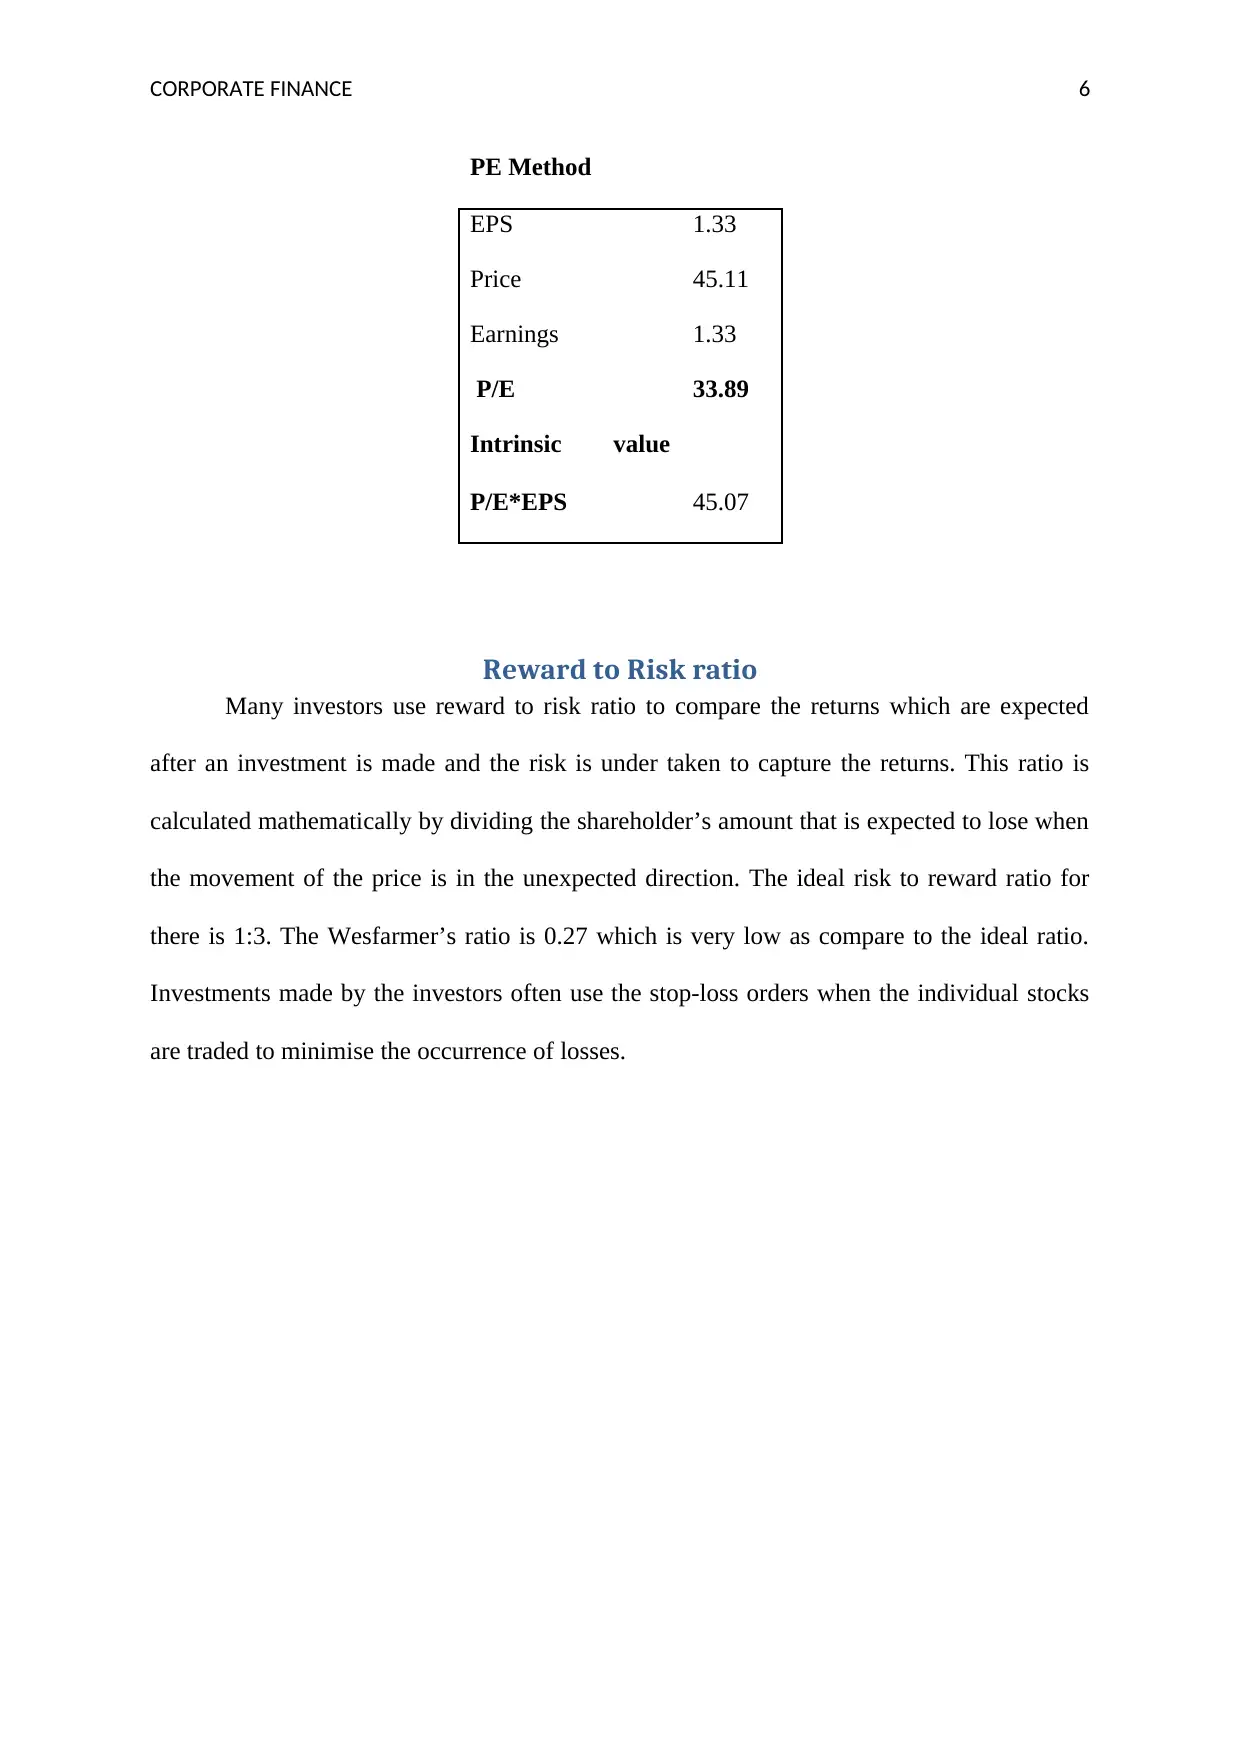
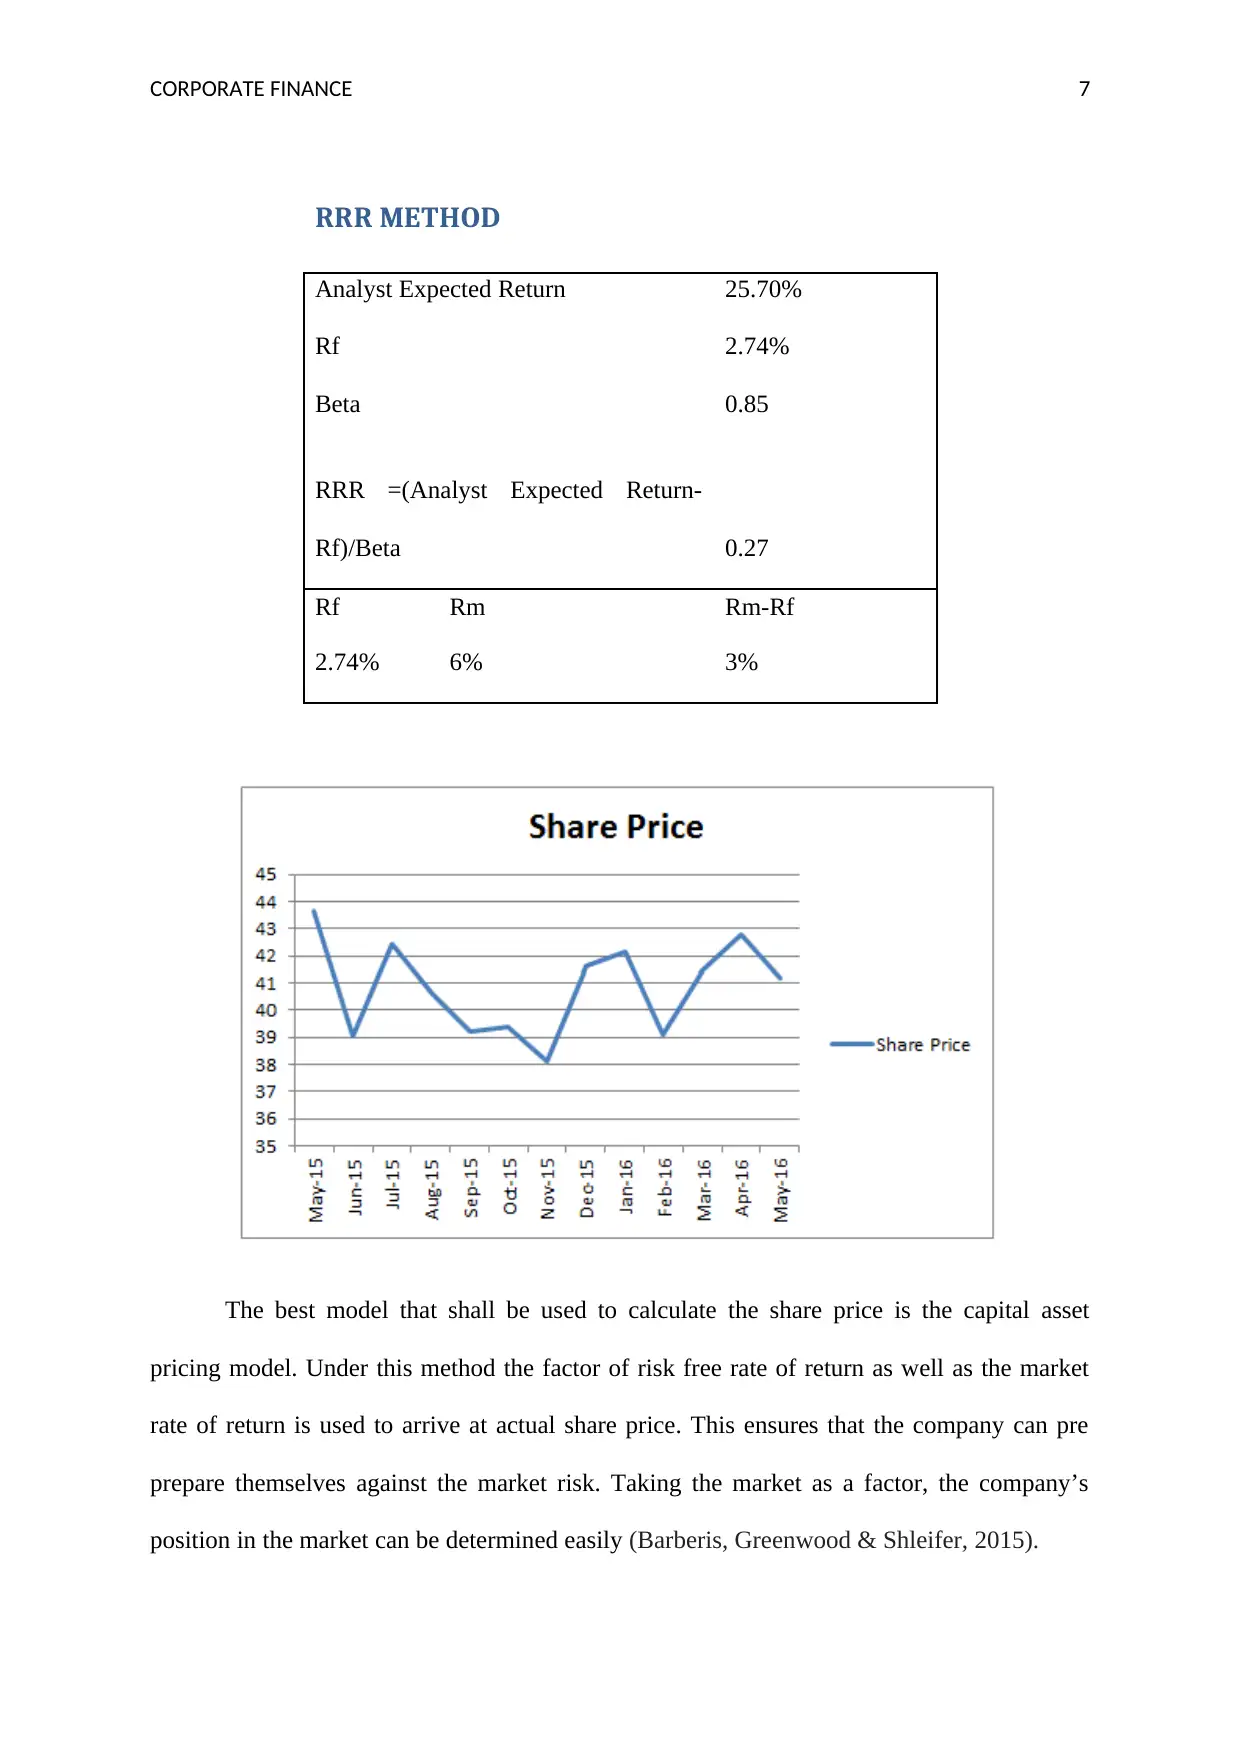
This case study provides a financial analysis of Wesfarmers Limited, an Australian conglomerate. It examines Wesfarmers' strategies for delivering shareholder returns, core values, and specific approaches within its Coles retail chain. The analysis includes calculations using the Capital Asset Pricing Model (CAPM), Dividend Discount Model (both standard and non-dividend versions), and Price-Earnings Ratio to determine the intrinsic value of Wesfarmers' stock. The study also assesses the Reward to Risk ratio and applies the RRR method. The document compares different models for share price calculation, ultimately recommending the CAPM for its consideration of market risk factors. It concludes with a discussion of Wesfarmers' position in the market and references relevant academic sources. Desklib is a platform where students can find similar solved assignments and past papers.
1 out of 9
Related Documents


Your All-in-One AI-Powered Toolkit for Academic Success.
+13062052269
info@desklib.com
Available 24*7 on WhatsApp / Email
![[object Object]](/_next/static/media/star-bottom.7253800d.svg)
Copyright © 2020–2026 A2Z Services. All Rights Reserved. Developed and managed by ZUCOL.