Data Analysis: Descriptive Statistics, Regression Analysis, and Diagnostic Tests
Added on 2023-01-12
14 Pages2653 Words63 Views
Data Analysis
Contents
INTRODUCTION...........................................................................................................................1
Descriptive statistics....................................................................................................................1
Graphs..........................................................................................................................................2
Creating a new variable ln(wage) and explaining the use of the function logarithm..................3
REGRESSION ANALYSIS AND DISCUSSION OF THE RESULTS........................................4
The regression model...................................................................................................................4
Explaining the model summary table..........................................................................................4
Interpreting the results for the ANOVA table.............................................................................4
Interpreting the results for the coefficients table.........................................................................5
Discussing the results..................................................................................................................6
DIAGNOSTIC TESTS....................................................................................................................6
Checking for the existence of the multicollinearity issue, explaining the methodology and
discussing the results...................................................................................................................6
CONCLUSION..............................................................................................................................11
REFERENCES..............................................................................................................................12
INTRODUCTION
Data analysis is a process of analysing a data set in order to make relevant decisions
(Chambers, 2018). The main aim of this report is to analyse the data set having information
about wage and factors which influence the wage of workers. In this report, descriptive statistics
of all variables will be interpreted along with creating a new variable using logarithm. In this
report, regression and correlation tests using scatter plots will also be conducted. Lastly, data set
will be diagnosed by checking the existence of multicollinearity issue.
By investigating, there are various factors which impacts people’s wage. The most important
factors which are identified are the skill and capability. Due to variation in skills and abilities of
labours, their wage also gets varied. Another essential factor is experience; if an individual has
valid experience then the individual acts as an asset due to which he or she is viable to get higher
wage than others (Tian and Yu-mei, 2017). Few other factors which are identified are geographic
region, industry, age of the employee, gender, personal responsibilities, hazardous working
conditions, absence of union and many more.
DESCRIPTIVE STATISTICS, GRAPHS AND CORRELATION TEST
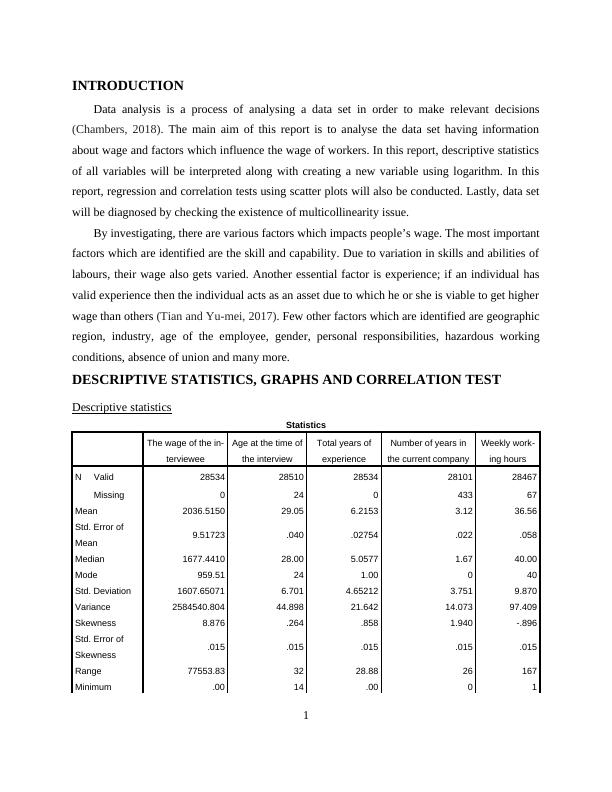
Descriptive statistics
Statistics
The wage of the in-
terviewee
Age at the time of
the interview
Total years of
experience
Number of years in
the current company
Weekly work-
ing hours
N Valid 28534 28510 28534 28101 28467
Missing 0 24 0 433 67
Mean 2036.5150 29.05 6.2153 3.12 36.56
Std. Error of
Mean 9.51723 .040 .02754 .022 .058
Median 1677.4410 28.00 5.0577 1.67 40.00
Mode 959.51 24 1.00 0 40
Std. Deviation 1607.65071 6.701 4.65212 3.751 9.870
Variance 2584540.804 44.898 21.642 14.073 97.409
Skewness 8.876 .264 .858 1.940 -.896
Std. Error of
Skewness .015 .015 .015 .015 .015
Range 77553.83 32 28.88 26 167
Minimum .00 14 .00 0 1
1
Data analysis is a process of analysing a data set in order to make relevant decisions
(Chambers, 2018). The main aim of this report is to analyse the data set having information
about wage and factors which influence the wage of workers. In this report, descriptive statistics
of all variables will be interpreted along with creating a new variable using logarithm. In this
report, regression and correlation tests using scatter plots will also be conducted. Lastly, data set
will be diagnosed by checking the existence of multicollinearity issue.
By investigating, there are various factors which impacts people’s wage. The most important
factors which are identified are the skill and capability. Due to variation in skills and abilities of
labours, their wage also gets varied. Another essential factor is experience; if an individual has
valid experience then the individual acts as an asset due to which he or she is viable to get higher
wage than others (Tian and Yu-mei, 2017). Few other factors which are identified are geographic
region, industry, age of the employee, gender, personal responsibilities, hazardous working
conditions, absence of union and many more.
DESCRIPTIVE STATISTICS, GRAPHS AND CORRELATION TEST
Descriptive statistics
Statistics
The wage of the in-
terviewee
Age at the time of
the interview
Total years of
experience
Number of years in
the current company
Weekly work-
ing hours
N Valid 28534 28510 28534 28101 28467
Missing 0 24 0 433 67
Mean 2036.5150 29.05 6.2153 3.12 36.56
Std. Error of
Mean 9.51723 .040 .02754 .022 .058
Median 1677.4410 28.00 5.0577 1.67 40.00
Mode 959.51 24 1.00 0 40
Std. Deviation 1607.65071 6.701 4.65212 3.751 9.870
Variance 2584540.804 44.898 21.642 14.073 97.409
Skewness 8.876 .264 .858 1.940 -.896
Std. Error of
Skewness .015 .015 .015 .015 .015
Range 77553.83 32 28.88 26 167
Minimum .00 14 .00 0 1
1
Maximum 77553.83 46 28.88 26 168
Sum 58109919.80 828076 177347.83 87783 1040741
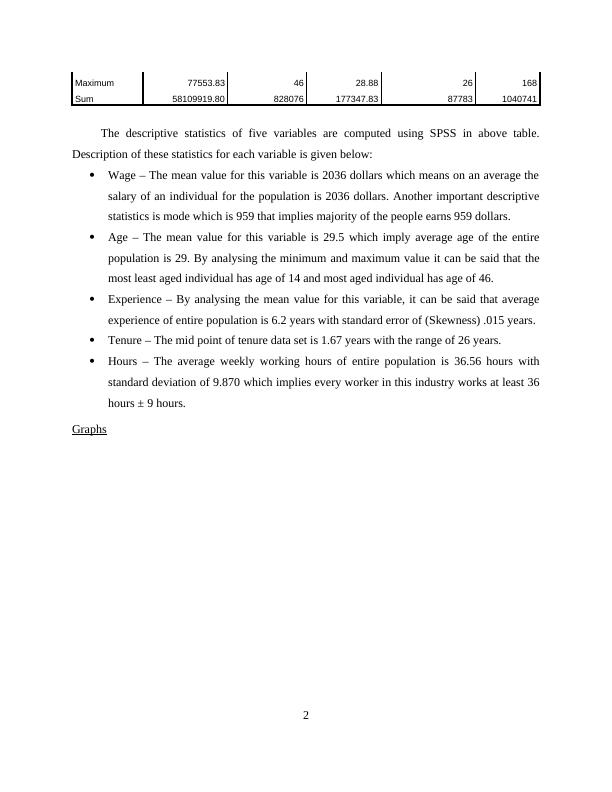
The descriptive statistics of five variables are computed using SPSS in above table.
Description of these statistics for each variable is given below:
Wage – The mean value for this variable is 2036 dollars which means on an average the
salary of an individual for the population is 2036 dollars. Another important descriptive
statistics is mode which is 959 that implies majority of the people earns 959 dollars.
Age – The mean value for this variable is 29.5 which imply average age of the entire
population is 29. By analysing the minimum and maximum value it can be said that the
most least aged individual has age of 14 and most aged individual has age of 46.
Experience – By analysing the mean value for this variable, it can be said that average
experience of entire population is 6.2 years with standard error of (Skewness) .015 years.
Tenure – The mid point of tenure data set is 1.67 years with the range of 26 years.
Hours – The average weekly working hours of entire population is 36.56 hours with
standard deviation of 9.870 which implies every worker in this industry works at least 36
hours ± 9 hours.
Graphs
2
Sum 58109919.80 828076 177347.83 87783 1040741
The descriptive statistics of five variables are computed using SPSS in above table.
Description of these statistics for each variable is given below:
Wage – The mean value for this variable is 2036 dollars which means on an average the
salary of an individual for the population is 2036 dollars. Another important descriptive
statistics is mode which is 959 that implies majority of the people earns 959 dollars.
Age – The mean value for this variable is 29.5 which imply average age of the entire
population is 29. By analysing the minimum and maximum value it can be said that the
most least aged individual has age of 14 and most aged individual has age of 46.
Experience – By analysing the mean value for this variable, it can be said that average
experience of entire population is 6.2 years with standard error of (Skewness) .015 years.
Tenure – The mid point of tenure data set is 1.67 years with the range of 26 years.
Hours – The average weekly working hours of entire population is 36.56 hours with
standard deviation of 9.870 which implies every worker in this industry works at least 36
hours ± 9 hours.
Graphs
2
End of preview
Want to access all the pages? Upload your documents or become a member.
Related Documents
BU1007 - Data Analysis - Individual Reportlg...
|18
|1606
|65
Descriptive Statistics, Correlation, Regression Analysislg...
|11
|3202
|48
Statistics for Market Price and Age of Houselg...
|12
|2257
|119
Data Collection and Analysis for Research Projectlg...
|15
|3138
|304
SPSS Data Collection - Assignmentlg...
|11
|1734
|19
Econometrics Assignment Solvedlg...
|13
|1437
|270