Data Analysis: Methods and Techniques for Sound Decision Making
Added on 2023-03-21
8 Pages2934 Words24 Views
Data analysis is the process of systematically applying statistical techniques to describe,
evaluate, inspect and derive useful and meaningful information from data that can assist in sound
decision making and to solve specific problems. Data are collected facts that convey no meaning
but organized in a given order. There are various methods of obtaining data depending on type
that is required. There are two types data, secondary and primary. Secondary data are those that
have been collected and stored which can be obtained from records, internet, journals among
others. Primary are those that the researcher has direct involvement in collection process.
Primary data can be collected through interviews, administration of the questionnaires among
others. Before data is collected, the researcher must come up with relevant research objectives
and hypothesis. The objectives are what the researcher want to accomplish, target or goal, which
guides the researcher to identify the variables. Hypotheses are prediction statements about the
outcome. Hypotheses, objectives together with well-designed research questions assist the
researcher to identify the type and the structure of data that are needed. They also assist the
researcher to decide on the data analysis method that will give the required findings. There are
qualitative and quantitative data analysis methods, which are broadly categorized into inferential
and descriptive analysis.
Qualitative data analysis is analytical method applied to qualisstative data to derive information.
It is a method that is used in identifying and interpreting of patterns from a textual data that can
be used to answer research objectives. It deals with studying human behavior. It is the best
method of studying questions like how and why concerning human experiences have strong basis
in sociology. Qualitative data consist of words, observations and symbols which can easily be
obtained using primary methods of data collection. Qualitative analysis consists of content,
narrative, discourse, grounded and framework analysis. Content is categorizing of behavioral
data to classify and to summary. Narrative is the reformulation of stories presented while taking
into account the content and experience of each respondent. A discourse is analysis of naturally
occurring talks and written texts. Framework is familiarization, identification of thematic
framework, mapping, charting and interpretation. Grounded deals with analysis of single case to
develop a theory. Qualitative research helps in understanding and interpreting human
psychology. Qualitative research argues that understanding of a phenomenon comes from
exploration of the totality of the situation with access of non-numerical data. The method is
highly applied in communicative analysis that include journalism among others.
Quantitative analysis is the process of applying mathematical and statistical techniques in
extracting useful information from measurable and verifiable data. These techniques include
parametric and non-parametric methods. The parameters are normally mean and standard
deviation. The methods are based upon given set of assumptions. These assumptions are
population parameter is normal or can be estimated through central limit theorem, observations
are independent from each other, experiment randomly conducted among others. Some of the
parametric methods of data analysis include t test, Chi-square test of association and goodness of
fit, Analysis of variance, F test for equality of variances, Regression techniques, Z test of means
for dependent and independent samples, Confident intervals among others. Non parametric
methods that do not have assumptions concerning the population parameter. Neither the
parameters nor the distributions are fixed. Some of the non-parametric methods include Sign test,
Wilcoxon Mann Whitney, Wilcoxon Sign Rank test, Median test, test of randomness, Spearman
correlation, U test, Kruskal test among others. These non-parametric tests do not depend on the
mean. Quantitative analysis also comprises of descriptive analysis. Descriptive analysis include
means, standard deviation, quartiles, skewness among others.
T-Test
T- test is a parametric method of quantitative inferential data analysis. There are two types of t
test which include one sample t test for testing mean, two independent samples and paired
samples t test for comparing means. Some of the assumptions made when using t test include the
parameter normally distributed, independency of assumptions and randomization. T test is
normally appropriate when the number of observations is less than 30 and the population
standard deviation or variance is unknown but can only be estimated using sample parameters.
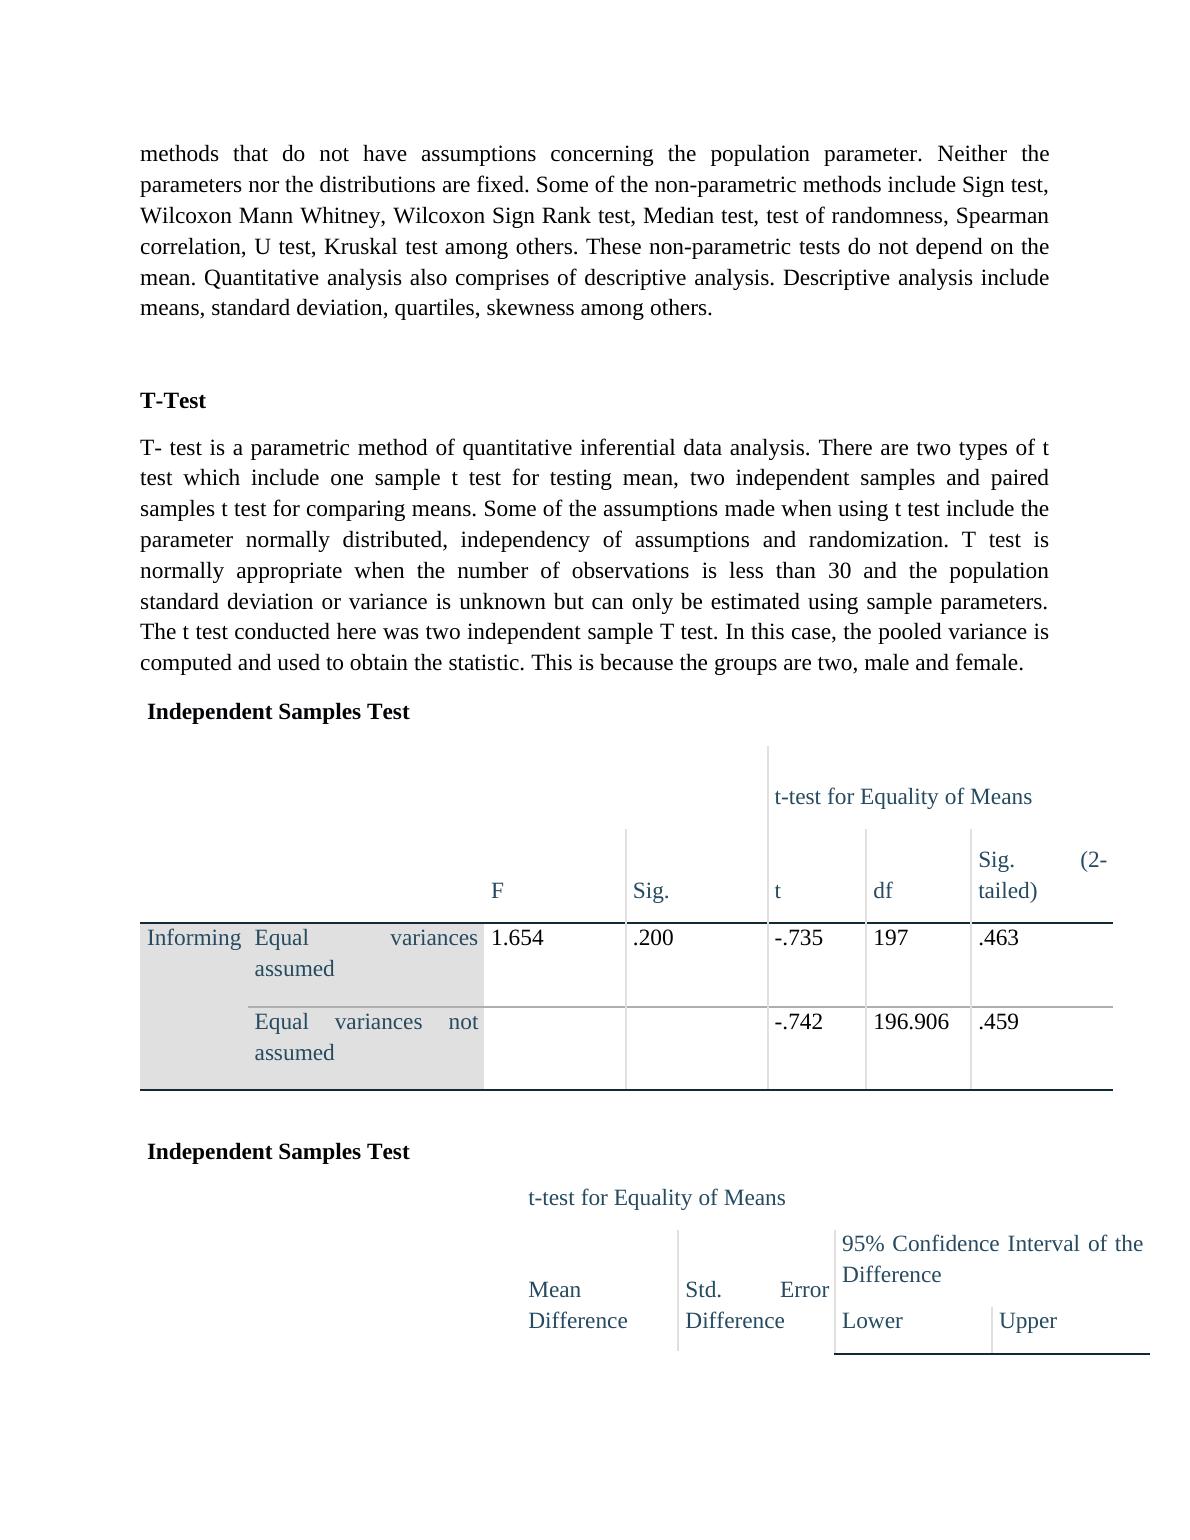
The t test conducted here was two independent sample T test. In this case, the pooled variance is
computed and used to obtain the statistic. This is because the groups are two, male and female.
Independent Samples Test
t-test for Equality of Means
F Sig. t df
Sig. (2-
tailed)
Informing Equal variances
assumed
1.654 .200 -.735 197 .463
Equal variances not
assumed
-.742 196.906 .459
Independent Samples Test
t-test for Equality of Means
Mean
Difference
Std. Error
Difference
95% Confidence Interval of the
Difference
Lower Upper
parameters nor the distributions are fixed. Some of the non-parametric methods include Sign test,
Wilcoxon Mann Whitney, Wilcoxon Sign Rank test, Median test, test of randomness, Spearman
correlation, U test, Kruskal test among others. These non-parametric tests do not depend on the
mean. Quantitative analysis also comprises of descriptive analysis. Descriptive analysis include
means, standard deviation, quartiles, skewness among others.
T-Test
T- test is a parametric method of quantitative inferential data analysis. There are two types of t
test which include one sample t test for testing mean, two independent samples and paired
samples t test for comparing means. Some of the assumptions made when using t test include the
parameter normally distributed, independency of assumptions and randomization. T test is
normally appropriate when the number of observations is less than 30 and the population
standard deviation or variance is unknown but can only be estimated using sample parameters.
The t test conducted here was two independent sample T test. In this case, the pooled variance is
computed and used to obtain the statistic. This is because the groups are two, male and female.
Independent Samples Test
t-test for Equality of Means
F Sig. t df
Sig. (2-
tailed)
Informing Equal variances
assumed
1.654 .200 -.735 197 .463
Equal variances not
assumed
-.742 196.906 .459
Independent Samples Test
t-test for Equality of Means
Mean
Difference
Std. Error
Difference
95% Confidence Interval of the
Difference
Lower Upper
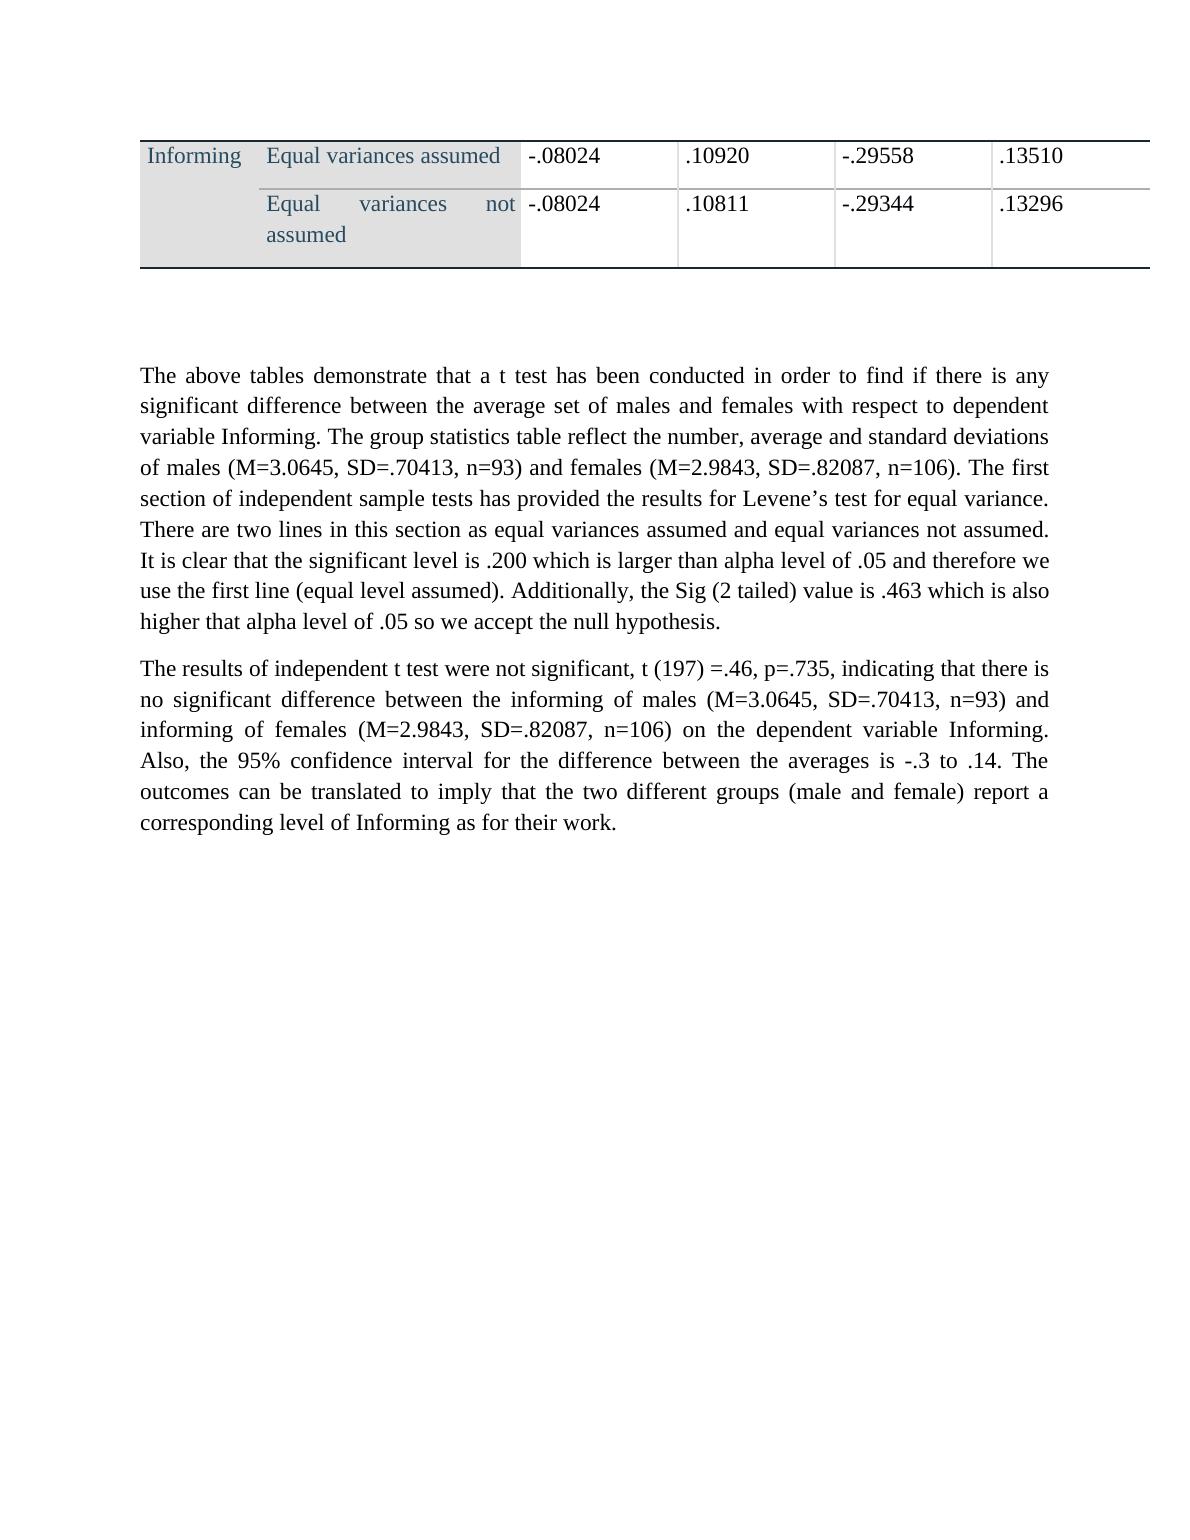
Informing Equal variances assumed -.08024 .10920 -.29558 .13510
Equal variances not
assumed
-.08024 .10811 -.29344 .13296
The above tables demonstrate that a t test has been conducted in order to find if there is any
significant difference between the average set of males and females with respect to dependent
variable Informing. The group statistics table reflect the number, average and standard deviations
of males (M=3.0645, SD=.70413, n=93) and females (M=2.9843, SD=.82087, n=106). The first
section of independent sample tests has provided the results for Levene’s test for equal variance.
There are two lines in this section as equal variances assumed and equal variances not assumed.
It is clear that the significant level is .200 which is larger than alpha level of .05 and therefore we
use the first line (equal level assumed). Additionally, the Sig (2 tailed) value is .463 which is also
higher that alpha level of .05 so we accept the null hypothesis.
The results of independent t test were not significant, t (197) =.46, p=.735, indicating that there is
no significant difference between the informing of males (M=3.0645, SD=.70413, n=93) and
informing of females (M=2.9843, SD=.82087, n=106) on the dependent variable Informing.
Also, the 95% confidence interval for the difference between the averages is -.3 to .14. The
outcomes can be translated to imply that the two different groups (male and female) report a
corresponding level of Informing as for their work.
End of preview
Want to access all the pages? Upload your documents or become a member.
Related Documents
Financial Risk Associated with Crypto-Currency: A Quantitative Studylg...
|7
|1879
|91
Management Perspectives in Apple | Reportlg...
|13
|2973
|19
Research Methods in Social Science: Quantitative vs Qualitativelg...
|15
|3923
|258
RESEARCH METHODOLOGY.lg...
|12
|3180
|2
Research Methods for International Staffing: Types of Research Methodologies, Sampling Techniques, and Data Analysis Techniqueslg...
|3
|508
|184
Differences Between Qualitative and Quantitative Research 2022lg...
|8
|1349
|26