Data Analysis Report: SPSS Findings on Ecotourism Marketing Strategies

Verified

Added on  2020/02/12

|34
|698
|109
Report
AI Summary
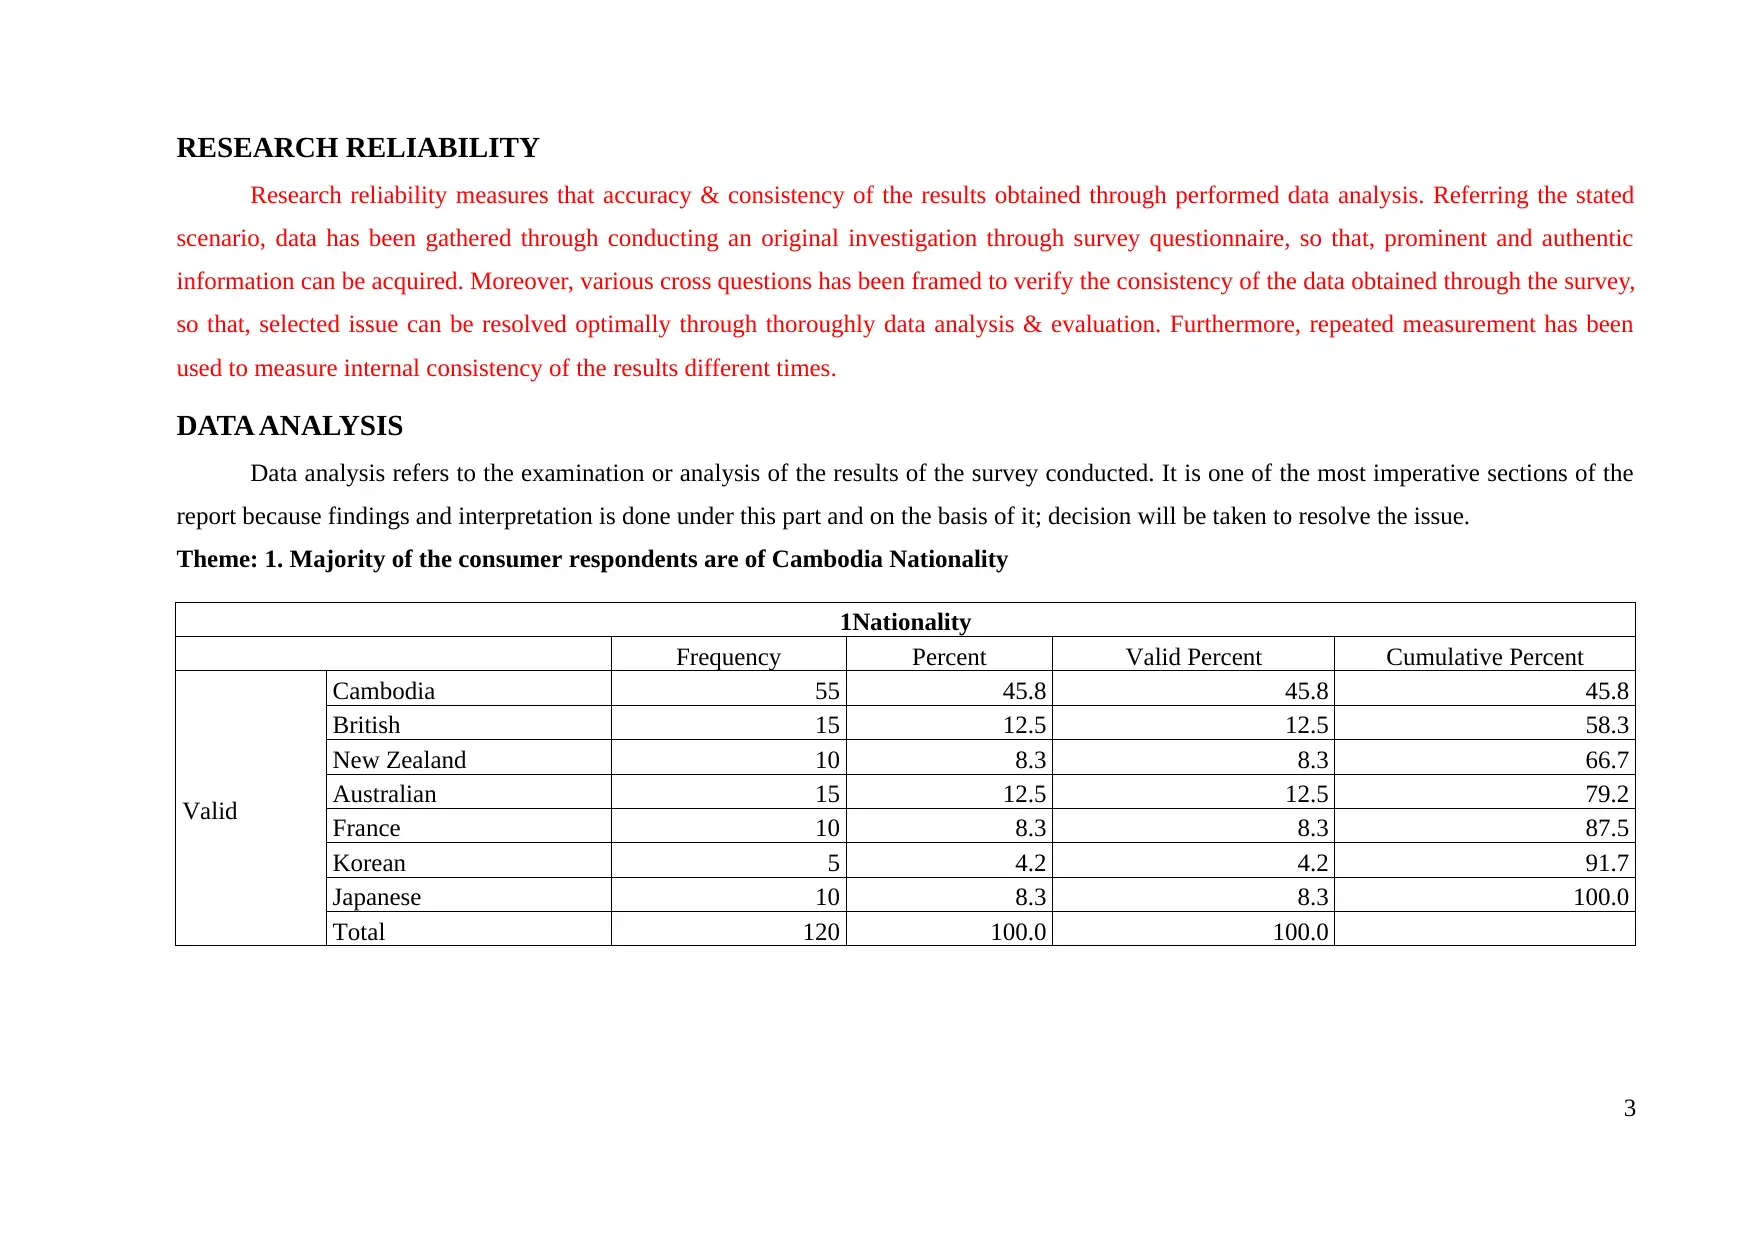
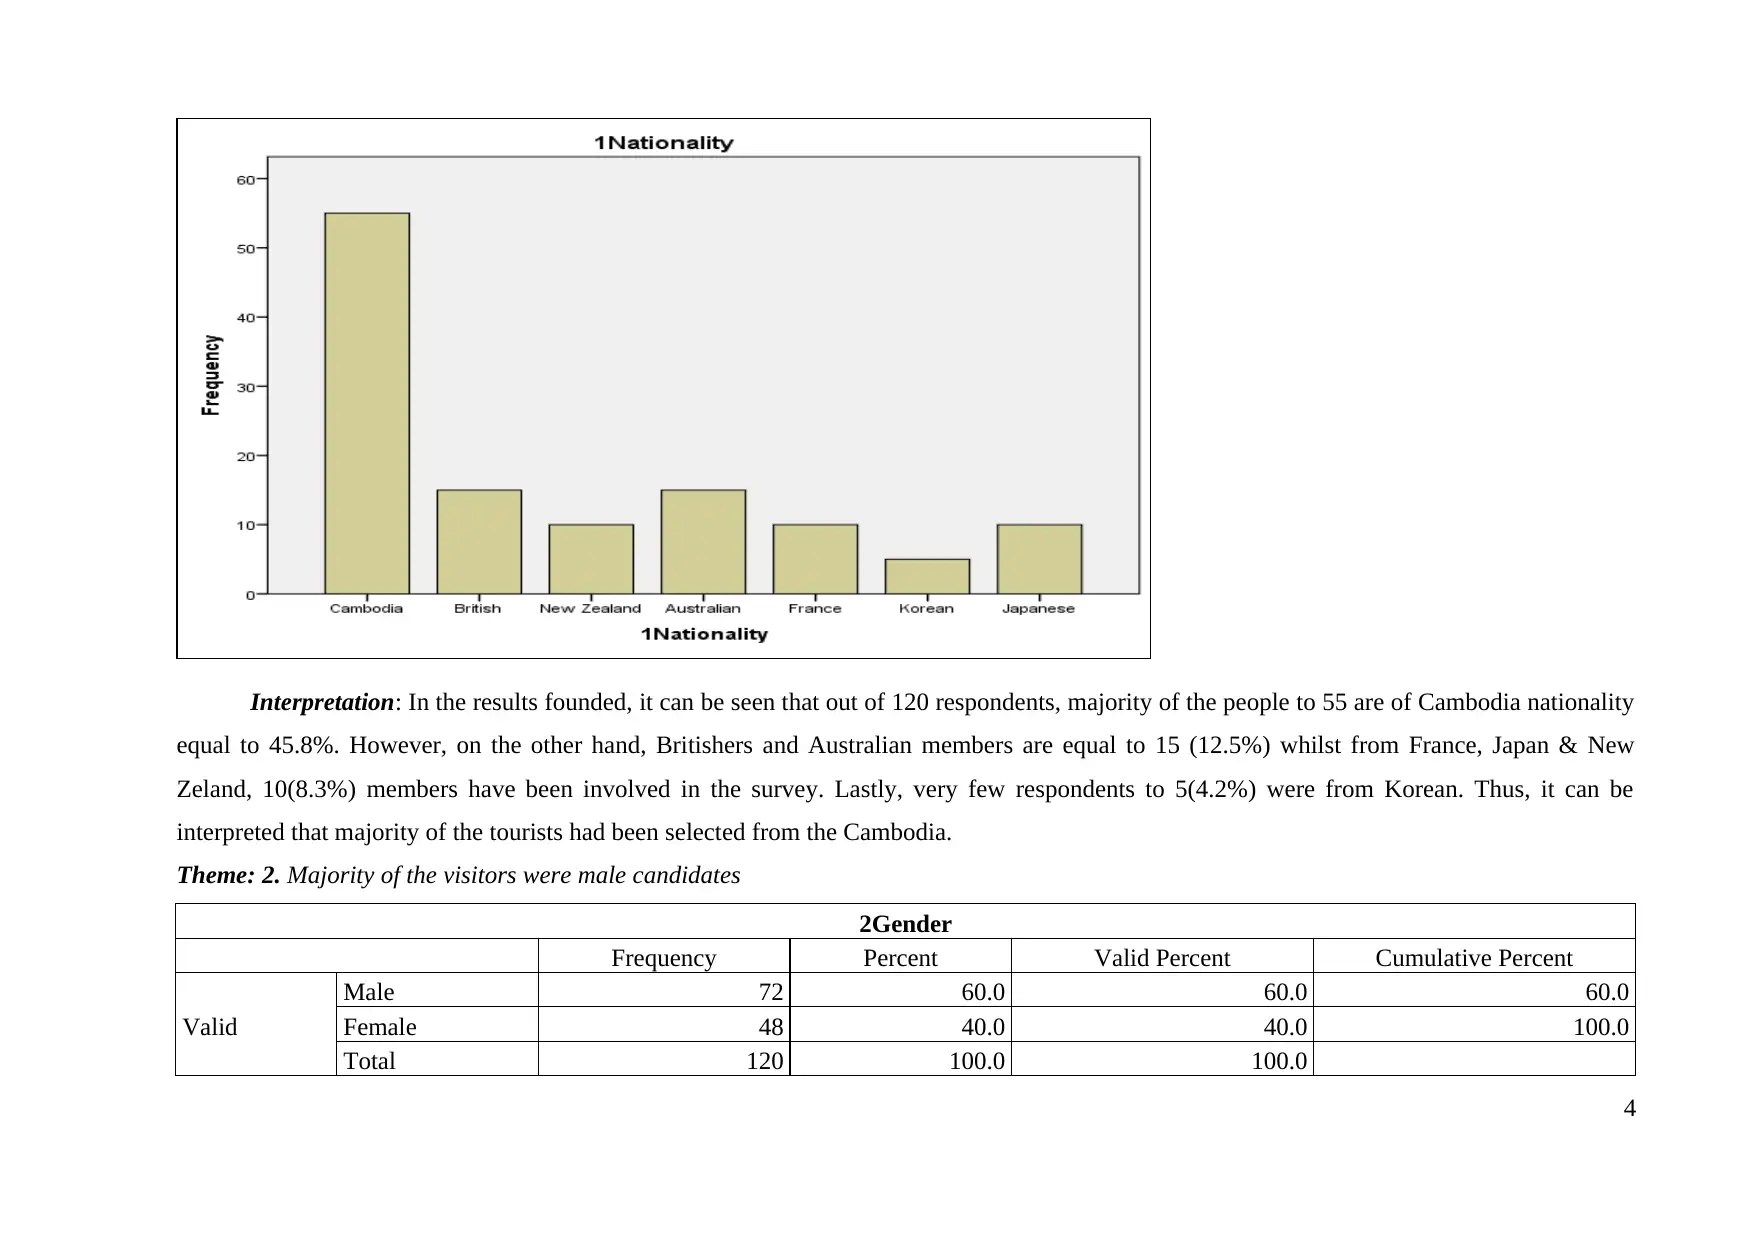
This report presents a data analysis conducted using SPSS, focusing on the effectiveness of marketing strategies in promoting ecotourism. The analysis is based on survey data, assessing the relationship between marketing practices and consumer understanding of ecotourism in Siem Reap. The report examines the reliability of the research, including repeated measurements and cross-questioning to ensure data consistency. The findings reveal a positive correlation between marketing practices, particularly social media marketing, and the level of understanding among travelers. The R value of 0.843 indicates a strong positive relationship, and the R-squared value of 0.710 suggests that effective marketing practices explain 71% of the variance in consumer understanding. The significance value of 0.000 confirms a statistically significant difference between the means. The report concludes that effective marketing practices are crucial for enhancing awareness and promoting ecotourism, supporting the alternative hypothesis. This assignment is a valuable resource for students seeking insights into data analysis and marketing effectiveness in the tourism sector.
Document Page
Data analysis using SPSS
1
tabler-icon-diamond-filled.svg

Paraphrase This Document

Need a fresh take? Get an instant paraphrase of this document with our AI Paraphraser
Document Page
Table of Contents
DATA ANALYSIS................................................................................................................................3
2
Document Page
RESEARCH RELIABILITY
Research reliability measures that accuracy & consistency of the results obtained through performed data analysis. Referring the stated
scenario, data has been gathered through conducting an original investigation through survey questionnaire, so that, prominent and authentic
information can be acquired. Moreover, various cross questions has been framed to verify the consistency of the data obtained through the survey,
so that, selected issue can be resolved optimally through thoroughly data analysis & evaluation. Furthermore, repeated measurement has been
used to measure internal consistency of the results different times.
DATA ANALYSIS
Data analysis refers to the examination or analysis of the results of the survey conducted. It is one of the most imperative sections of the
report because findings and interpretation is done under this part and on the basis of it; decision will be taken to resolve the issue.
Theme: 1. Majority of the consumer respondents are of Cambodia Nationality
1Nationality
Frequency Percent Valid Percent Cumulative Percent
Valid
Cambodia 55 45.8 45.8 45.8
British 15 12.5 12.5 58.3
New Zealand 10 8.3 8.3 66.7
Australian 15 12.5 12.5 79.2
France 10 8.3 8.3 87.5
Korean 5 4.2 4.2 91.7
Japanese 10 8.3 8.3 100.0
Total 120 100.0 100.0
3
Document Page
Interpretation: In the results founded, it can be seen that out of 120 respondents, majority of the people to 55 are of Cambodia nationality
equal to 45.8%. However, on the other hand, Britishers and Australian members are equal to 15 (12.5%) whilst from France, Japan & New
Zeland, 10(8.3%) members have been involved in the survey. Lastly, very few respondents to 5(4.2%) were from Korean. Thus, it can be
interpreted that majority of the tourists had been selected from the Cambodia.
Theme: 2. Majority of the visitors were male candidates
2Gender
Frequency Percent Valid Percent Cumulative Percent
Valid
Male 72 60.0 60.0 60.0
Female 48 40.0 40.0 100.0
Total 120 100.0 100.0
4
tabler-icon-diamond-filled.svg

Paraphrase This Document

Need a fresh take? Get an instant paraphrase of this document with our AI Paraphraser
Document Page
Interpretation: As per the pie graph presented, it can be seen that out of 120 respondents, very high proportion were male travelers to 72
(60%) whilst only 48(40%) tourists were female travelers.
Theme: 3. Majority of the tourists are employed people
3Occupation
Frequency Percent Valid Percent Cumulative Percent
Valid Employed 60 50.0 50.0 50.0
Unemployed 12 10.0 10.0 60.0
Student 19 15.8 15.8 75.8
Retired 29 24.2 24.2 100.0
5
Document Page
Total 120 100.0 100.0
Interpretation: Looking to the bar graph, it can be seen that in the survey, majority of the travelers were employed somewhere as in the
survey, half of the respondents to 50% are founded Employed people. However, 12(10%) were unemployed, 19(15.8%) were students &
29(24.2%) were retired person. Thus, as per the findings, it can be interpreted that majority of the times, employed people travel across different
destinations for their employment purpose.
Theme: 4. Most of the travelers were founded under the age group of 25 – 45 years
4Age
6
Document Page
Frequency Percent Valid Percent Cumulative Percent
Valid
< 25 20 16.7 16.7 16.7
25~45 60 50.0 50.0 66.7
45~60 29 24.2 24.2 90.8
>60 11 9.2 9.2 100.0
Total 120 100.0 100.0
Interpretations: In the survey, 60 (50%) people were fall under the age group of 25 to 45 years; however, only 11 respondents were
above the age of 45 years. On the other hand, 20 people were below the age of 20 years & 29 were from 45 to 60 years. The data reveals that
majority of the people who travel different destination were founded under the age limit of 25 – 45 years.
Theme: 5. Relaxation & shopping is the main preference of the travelers during travelling
7
tabler-icon-diamond-filled.svg

Paraphrase This Document

Need a fresh take? Get an instant paraphrase of this document with our AI Paraphraser
Document Page
5Whichoptionareprioritieswhenyoutravel?
Frequency Percent Valid Percent Cumulative Percent
Valid
Relaxation and shopping 66 55.0 55.0 55.0
Local culture 6 5.0 5.0 60.0
Benefit environment and community 12 10.0 10.0 70.0
Adventure and discovery of nature 36 30.0 30.0 100.0
Total 120 100.0 100.0
8
Document Page
Interpretations: In accordance with the bar graph, it can be seen that more than half of the respondents to 66 (55%) replied that relaxation
& shopping is the main priorities of the travelers when they visit other destinations & places. However, very few of the respondents go other
places to understand other culture & values & community as in the survey, only 6(5%) & 12(10%) respondents replied this. However, adventure
& discovery of natural beauty has been prioritized by 36(30%) people. Thus, it has been gained that countries can promote travelers through
providing them relaxed environment to gain crowded people.
Theme: 6. Majority of the travelers replied that they travel frequently at different destinations
6Howoftendoyoutravel?
Frequency Percent Valid Percent Cumulative Percent
Valid
Very Often 12 10.0 10.0 10.0
Quite often 72 60.0 60.0 70.0
Not often at all 36 30.0 30.0 100.0
Total 120 100.0 100.0
9
Document Page
Interpretation: Pie graph presented that very high proportion of the visitors to 72(60%) visit other places and destinations frequently &
quite often. However, only 12(10%) said that they replied very often whilst 36(30%) tourists replied they do not visit frequently at various places.
In accordance with the results observed, it has been analyzed that majority of the tourists travel frequently for different purpose and objectives.
Theme: 7. People really consider animal & wildlife welfare as an important element
7Doyouconsiderwelfareofanimalandwildlifeimportant?
Frequency Percent Valid Percent Cumulative Percent
Valid
Somewhat important 6 5.0 5.0 5.0
Moderately Important 18 15.0 15.0 20.0
High Important 72 60.0 60.0 80.0
Very Important 24 20.0 20.0 100.0
Total 120 100.0 100.0
10
tabler-icon-diamond-filled.svg

Paraphrase This Document

Need a fresh take? Get an instant paraphrase of this document with our AI Paraphraser
Document Page
Interpretations: Looking onto the graph, it is visualized that high proportion of the sample selected to 72(60%) said that animal &
wildlife welfare is extremely important. The results revealed that countries have to take necessary actions & policies for the safety and security of
animal and thereby encouraging sustainable tourism, called Ecotourism. However, only 6(5%), 18(15%) & 24(20%) replied have considered the
concept as somewhat agree, moderately important or very important.
Theme: 8. Majority of the travelers are not very well aware about the concept of Ecotourism
11
Document Page
8RatethelevelofyourunderstandingaboutEcotourism
Frequency Percent Valid Percent Cumulative Percent
Valid
Somewhat Low 66 55.0 55.0 55.0
Moderate 24 20.0 20.0 75.0
Good 24 20.0 20.0 95.0
Very Well 6 5.0 5.0 100.0
Total 120 100.0 100.0
12
chevron_up_icon
1 out of 34
circle_padding
hide_on_mobile
zoom_out_icon
[object Object]