Comparative Analysis: T-Test on COVID-19 Infection Rates in UK
VerifiedAdded on 2023/06/15
|13
|2520
|336
Report
AI Summary
This report conducts a data analysis using a t-test to investigate the difference in COVID-19 infection rates between White and BAME (Black, Asian, and Minority Ethnic) populations in the UK. It begins by explaining the meaning and application of the t-test, including the formulation of null and alternative hypotheses. The report then presents the results of the t-test at different significance levels (p-values of 0.10, 0.01, and 0.02) and interprets the outcomes, determining whether the null hypothesis (no significant difference in infection rates) is rejected or accepted. The analysis also identifies and discusses potential outliers in the data, assessing their impact on the results. Furthermore, the report suggests additional data features, such as gender and region, that could enhance the analysis and acknowledges other factors, like controlled variables and the inclusion of other ethnic groups, that might affect the findings. The conclusion summarizes the key results and emphasizes the importance of considering these factors for a more comprehensive understanding of COVID-19 infection rate disparities.

Data analysis and Visualization t-test
Paraphrase This Document
Need a fresh take? Get an instant paraphrase of this document with our AI Paraphraser
TABLE OF CONTENTS
INTRODUCTION...........................................................................................................................2
Meaning of t-test..........................................................................................................................2
Hypothesis and how to develop null and alternative hypothesis.................................................2
Appropriate set of testable hypothesis.........................................................................................3
Testing value at different intervals..............................................................................................4
Presence of any outliers in the data.............................................................................................6
Any other features of the data that appear during your investigation of the dataset.................10
Any other factors that might affect the results...........................................................................10
CONCLUSION..............................................................................................................................10
REFERENCES..............................................................................................................................12
INTRODUCTION
Data analysis is a process that is systematically applied in order to evaluate the data and
derive better results as well. In the present report, the entire data shed a light upon data analysis
in which the dataset is chosen. The data is extracted from the authentic sites where it has been
identified that infection rate of Covid – 19 is varied between white people and BAME in the UK.
Also, the report will analyse which test is suitable to answer the question and along with this, test
will be conducted at different P level. Moreover, the outlier will be determined through the data
which might affect the results. Moreover, different factors might affect the results and this has
not been considered in a stated experiments.
Meaning of t-test
t-test is a type of an inferential statistic which is used to examine that there is a mean
difference between the two mean groups which is somehow related to the certain features. That
is why, it can be stated that with the help of this test, the statistician can determine the degree of
freedom which help to identify the statistical significance (Husain and Ardhiansyah, 2020).
However, it can be also stated that with this test, a scholar also allows to compare the average
value of tow dataset which assists to determine, only if they came from a same population. In the
present study, this is also used because we have two groups i.e. white people and BAME. That is
why, it is far beneficial to identify the different between a groups.
Hypothesis and how to develop null and alternative hypothesis
Hypothesis is an assumption which is proposed for a sake of argument that assists to
determine whether it is true or not. In a scientific methodology, it has been identified that
hypothesis is constructed before using any test so that effective results can be drawn.
In order to develop null hypothesis, start by asking a question like there is no relationship
or significant association between the variables. It is also represented as H0 whereas alternative
hypothesis is denoted as H1. On the other side, for alternative hypothesis, can write that there is a
relationship between two or more variable that assist to determine the observed pattern between
data and it is not due to a chance of occurrence (Foster and et.al., 2021). Through this statement,
both hypothesis can be formulated and by applying the test and review the significance value,
hypothesis can be proved by considering the standard criteria.
⊘ This is a preview!⊘
Do you want full access?
Subscribe today to unlock all pages.
Trusted by 1+ million students worldwide
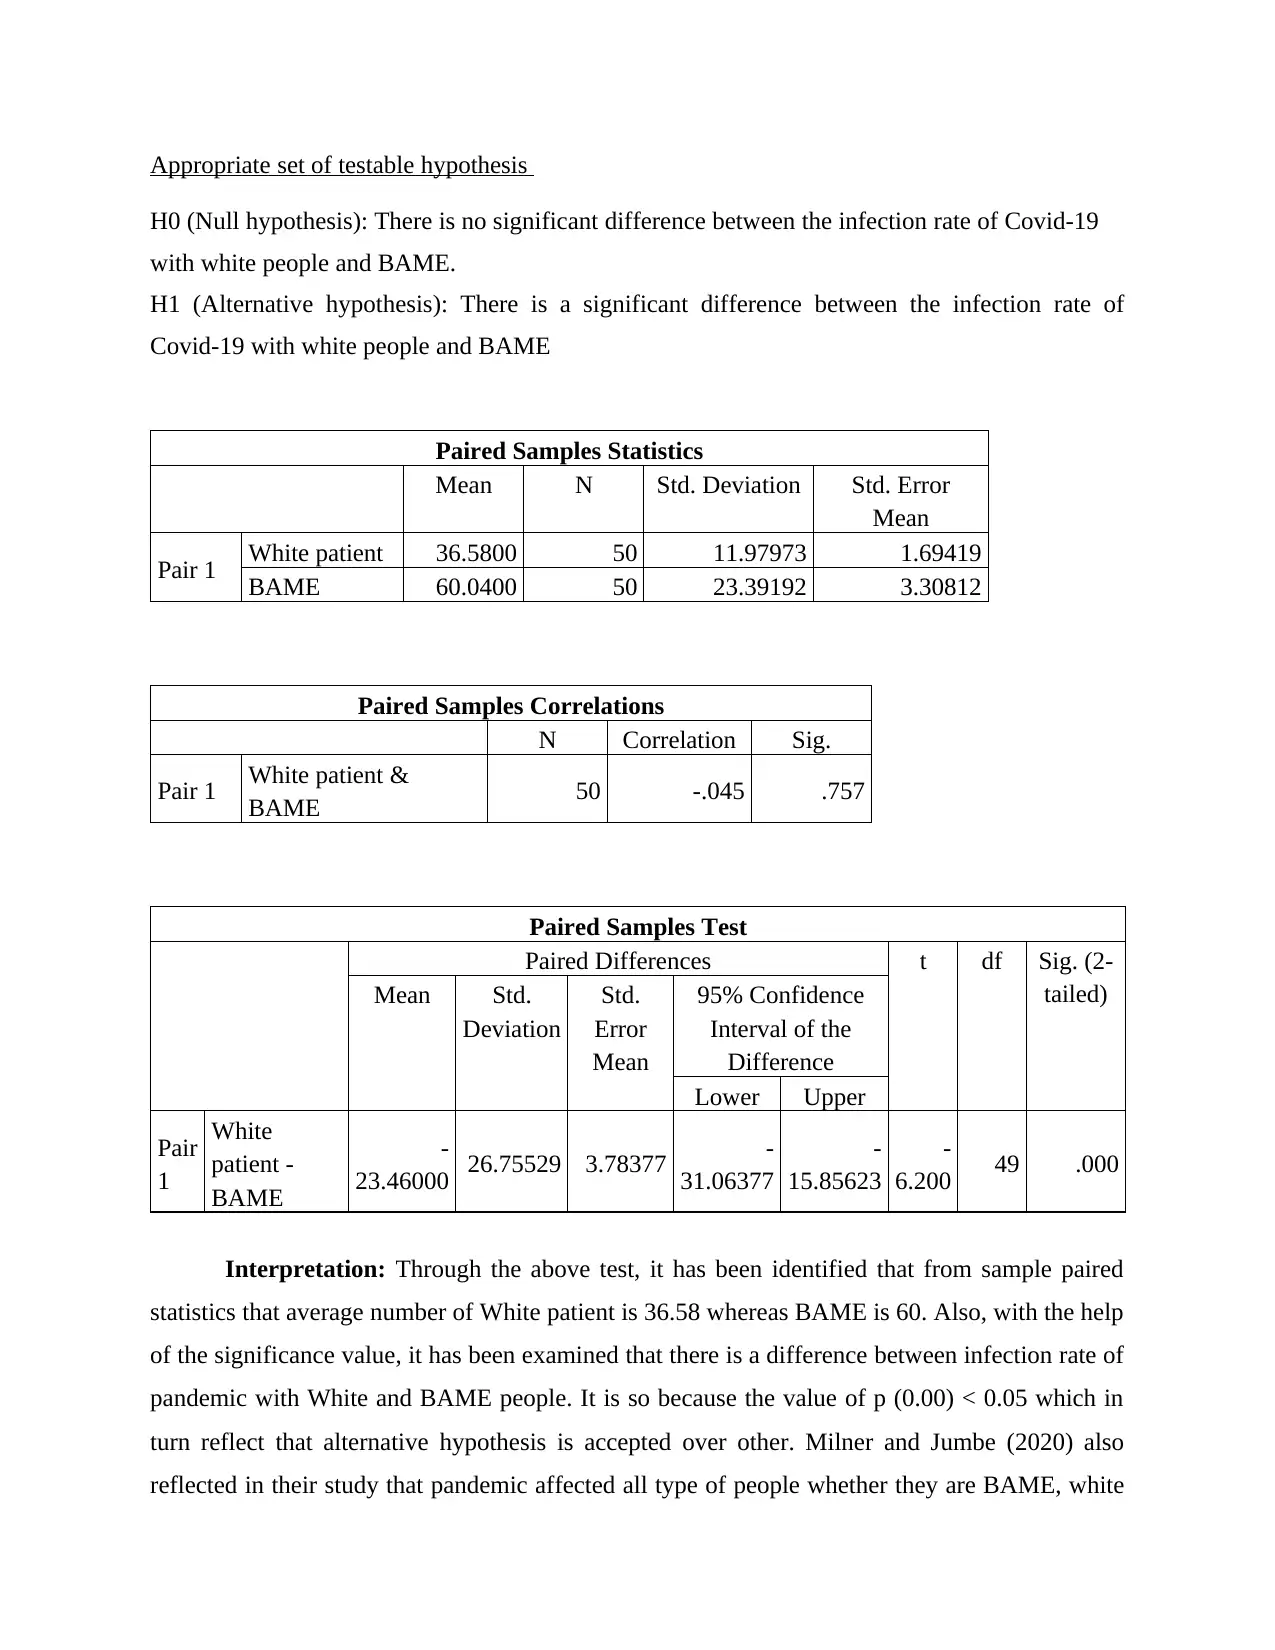
Appropriate set of testable hypothesis
H0 (Null hypothesis): There is no significant difference between the infection rate of Covid-19
with white people and BAME.
H1 (Alternative hypothesis): There is a significant difference between the infection rate of
Covid-19 with white people and BAME
Paired Samples Statistics
Mean N Std. Deviation Std. Error
Mean
Pair 1 White patient 36.5800 50 11.97973 1.69419
BAME 60.0400 50 23.39192 3.30812
Paired Samples Correlations
N Correlation Sig.
Pair 1 White patient &
BAME 50 -.045 .757
Paired Samples Test
Paired Differences t df Sig. (2-
tailed)Mean Std.
Deviation
Std.
Error
Mean
95% Confidence
Interval of the
Difference
Lower Upper
Pair
1
White
patient -
BAME
-
23.46000 26.75529 3.78377 -
31.06377
-
15.85623
-
6.200 49 .000
Interpretation: Through the above test, it has been identified that from sample paired
statistics that average number of White patient is 36.58 whereas BAME is 60. Also, with the help
of the significance value, it has been examined that there is a difference between infection rate of
pandemic with White and BAME people. It is so because the value of p (0.00) < 0.05 which in
turn reflect that alternative hypothesis is accepted over other. Milner and Jumbe (2020) also
reflected in their study that pandemic affected all type of people whether they are BAME, white
Paraphrase This Document
Need a fresh take? Get an instant paraphrase of this document with our AI Paraphraser
or any other. That is why, the significance different between the people also supported the same
which shows that the rate of infection of Covid-19 does not vary to the race of any people.
However, it can be stated that race and ethnicity are considered some of the risk markers for
other underlying conditions that affect their health and access to health care. That is why, the rate
of people might be changes according to the region because the rate of pandemic and its
infection is vary from region to region.
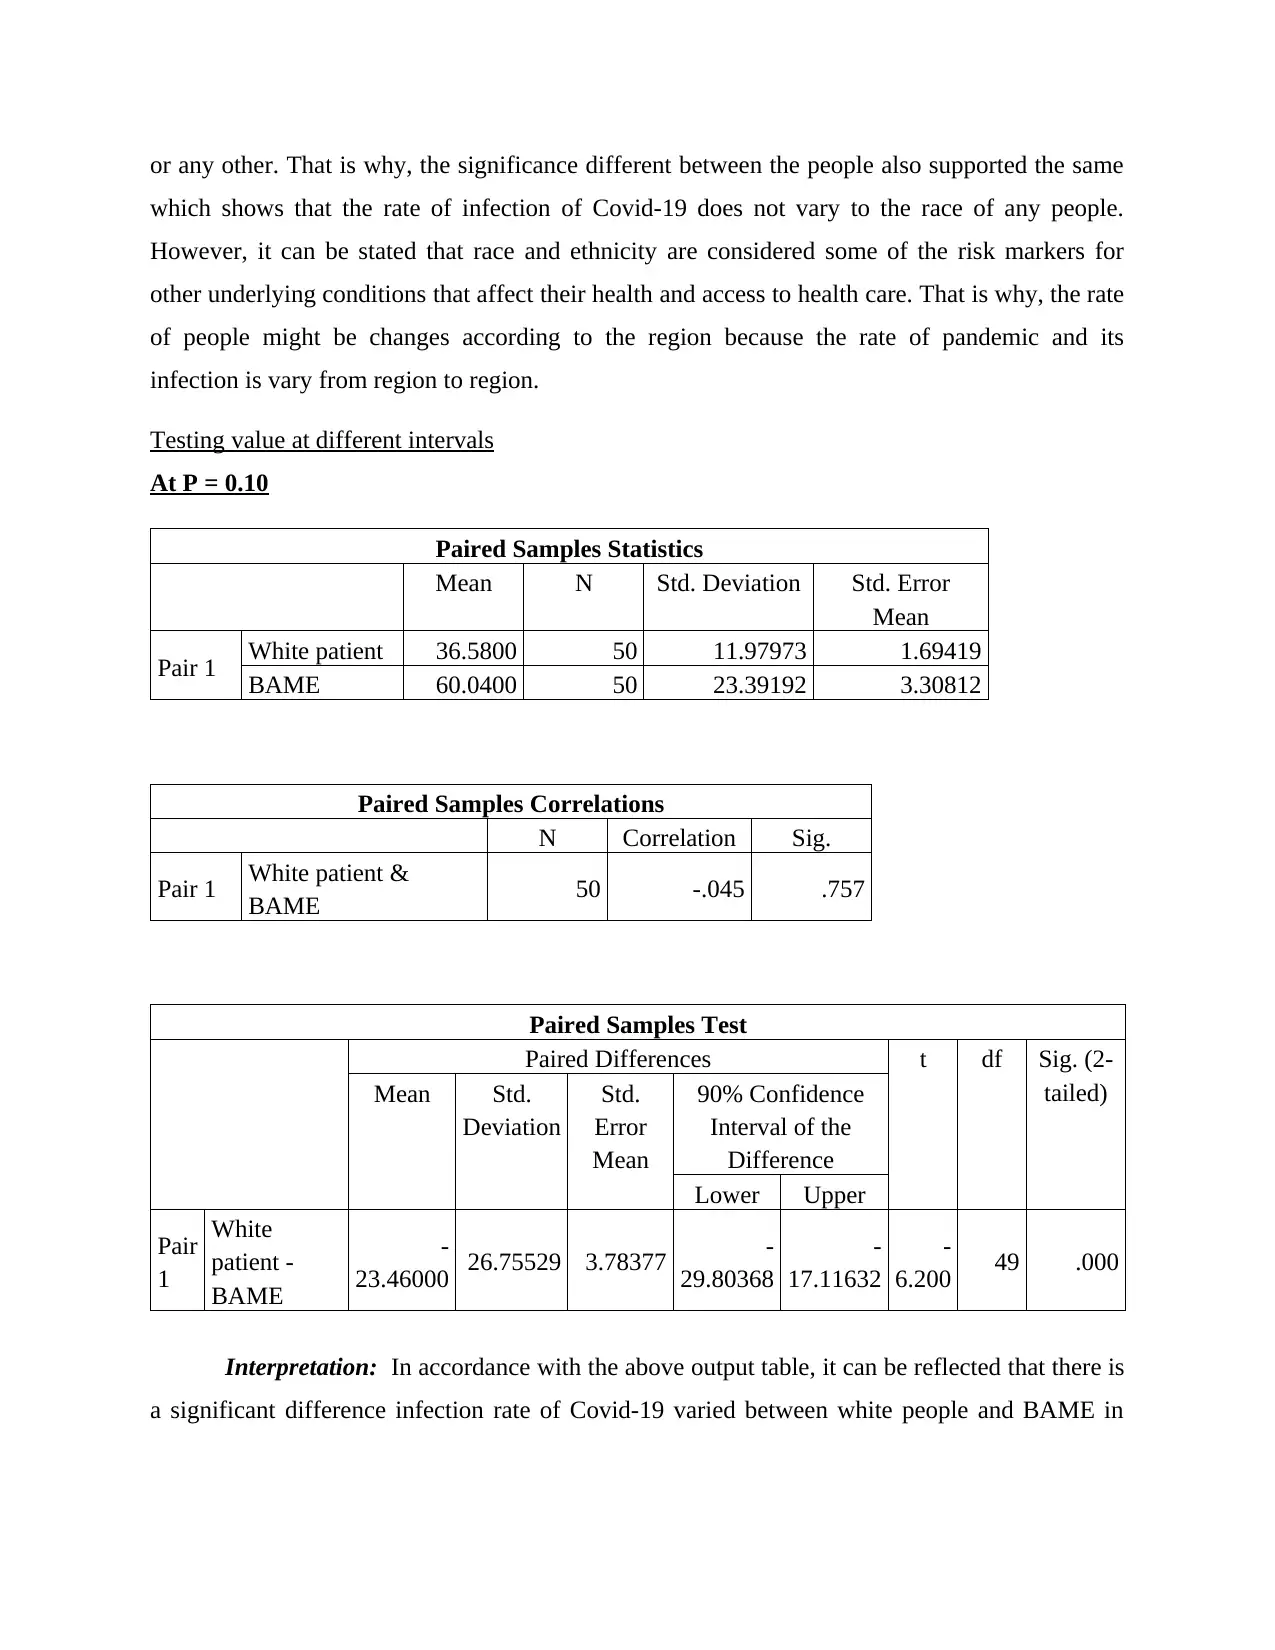
Testing value at different intervals
At P = 0.10
Paired Samples Statistics
Mean N Std. Deviation Std. Error
Mean
Pair 1 White patient 36.5800 50 11.97973 1.69419
BAME 60.0400 50 23.39192 3.30812
Paired Samples Correlations
N Correlation Sig.
Pair 1 White patient &
BAME 50 -.045 .757
Paired Samples Test
Paired Differences t df Sig. (2-
tailed)Mean Std.
Deviation
Std.
Error
Mean
90% Confidence
Interval of the
Difference
Lower Upper
Pair
1
White
patient -
BAME
-
23.46000 26.75529 3.78377 -
29.80368
-
17.11632
-
6.200 49 .000
Interpretation: In accordance with the above output table, it can be reflected that there is
a significant difference infection rate of Covid-19 varied between white people and BAME in
which shows that the rate of infection of Covid-19 does not vary to the race of any people.
However, it can be stated that race and ethnicity are considered some of the risk markers for
other underlying conditions that affect their health and access to health care. That is why, the rate
of people might be changes according to the region because the rate of pandemic and its
infection is vary from region to region.
Testing value at different intervals
At P = 0.10
Paired Samples Statistics
Mean N Std. Deviation Std. Error
Mean
Pair 1 White patient 36.5800 50 11.97973 1.69419
BAME 60.0400 50 23.39192 3.30812
Paired Samples Correlations
N Correlation Sig.
Pair 1 White patient &
BAME 50 -.045 .757
Paired Samples Test
Paired Differences t df Sig. (2-
tailed)Mean Std.
Deviation
Std.
Error
Mean
90% Confidence
Interval of the
Difference
Lower Upper
Pair
1
White
patient -
BAME
-
23.46000 26.75529 3.78377 -
29.80368
-
17.11632
-
6.200 49 .000
Interpretation: In accordance with the above output table, it can be reflected that there is
a significant difference infection rate of Covid-19 varied between white people and BAME in
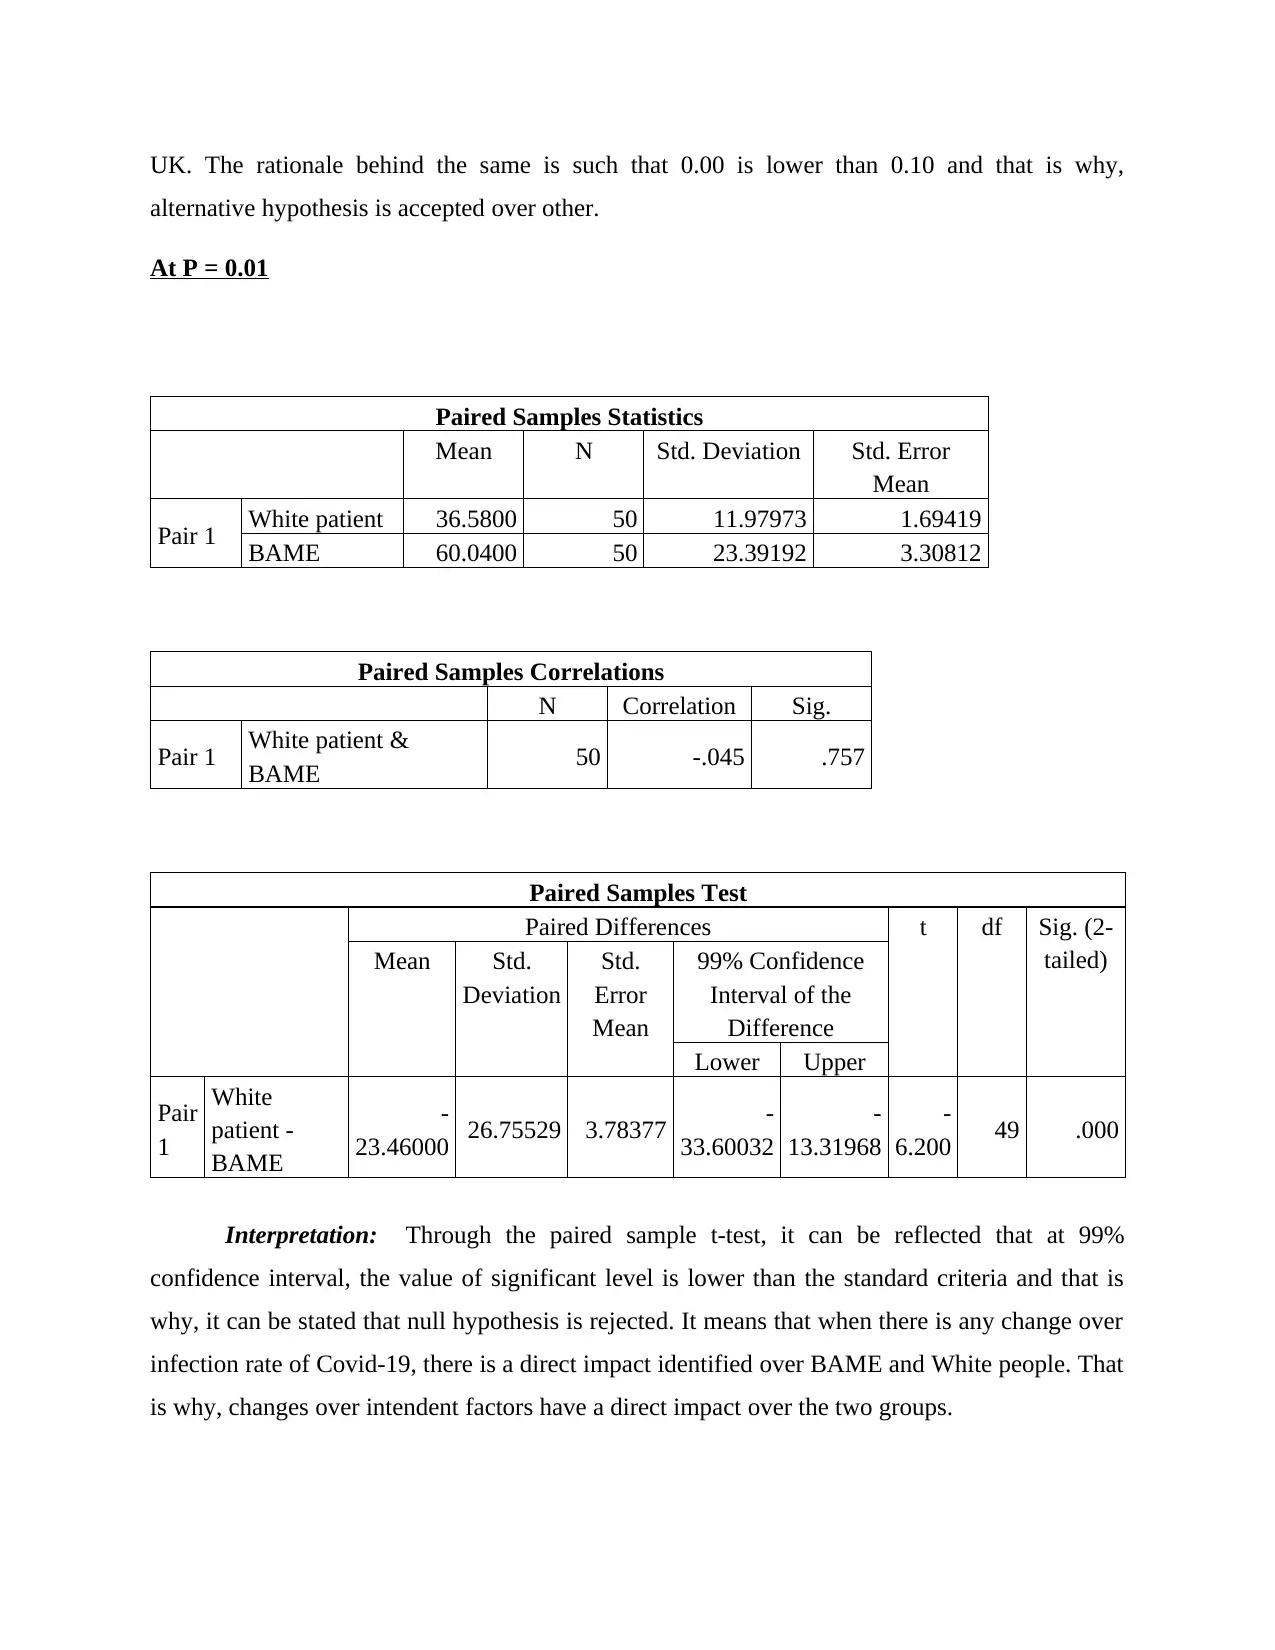
UK. The rationale behind the same is such that 0.00 is lower than 0.10 and that is why,
alternative hypothesis is accepted over other.
At P = 0.01
Paired Samples Statistics
Mean N Std. Deviation Std. Error
Mean
Pair 1 White patient 36.5800 50 11.97973 1.69419
BAME 60.0400 50 23.39192 3.30812
Paired Samples Correlations
N Correlation Sig.
Pair 1 White patient &
BAME 50 -.045 .757
Paired Samples Test
Paired Differences t df Sig. (2-
tailed)Mean Std.
Deviation
Std.
Error
Mean
99% Confidence
Interval of the
Difference
Lower Upper
Pair
1
White
patient -
BAME
-
23.46000 26.75529 3.78377 -
33.60032
-
13.31968
-
6.200 49 .000
Interpretation: Through the paired sample t-test, it can be reflected that at 99%
confidence interval, the value of significant level is lower than the standard criteria and that is
why, it can be stated that null hypothesis is rejected. It means that when there is any change over
infection rate of Covid-19, there is a direct impact identified over BAME and White people. That
is why, changes over intendent factors have a direct impact over the two groups.
⊘ This is a preview!⊘
Do you want full access?
Subscribe today to unlock all pages.
Trusted by 1+ million students worldwide
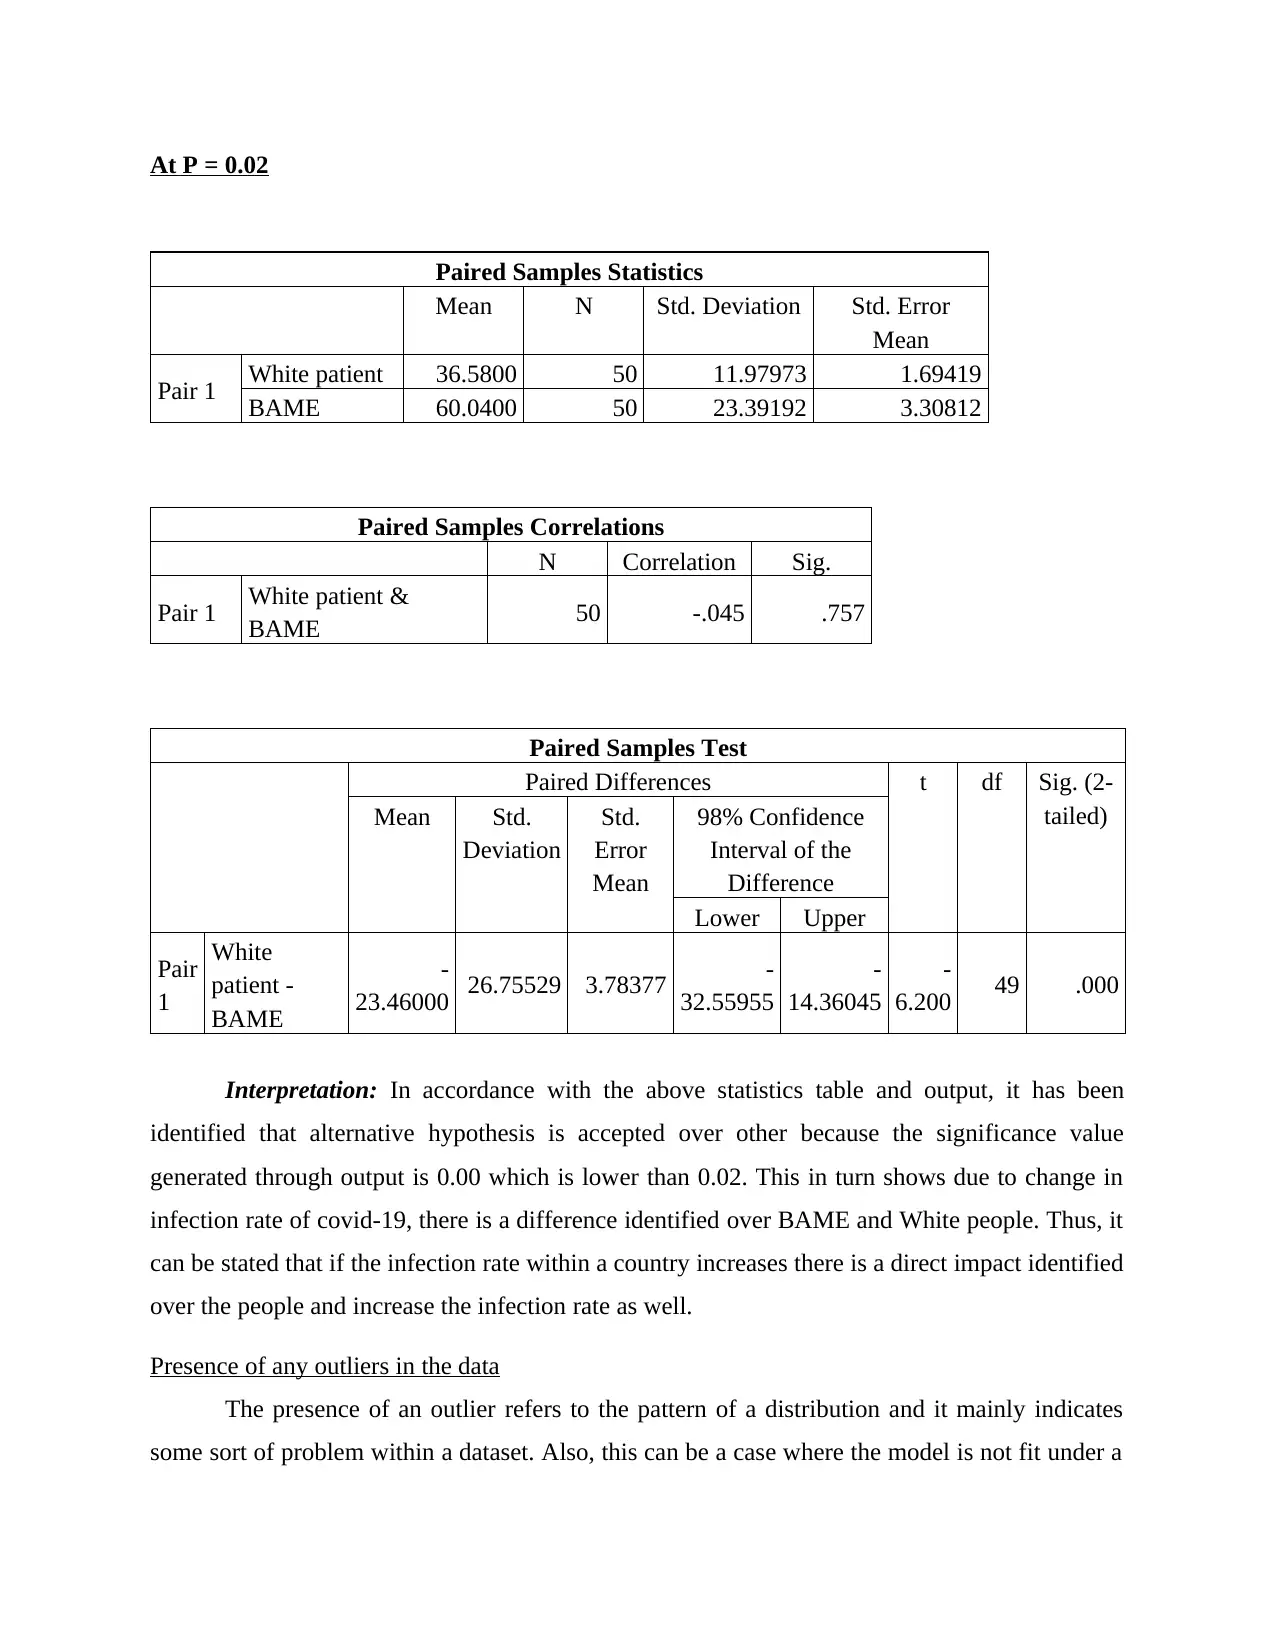
At P = 0.02
Paired Samples Statistics
Mean N Std. Deviation Std. Error
Mean
Pair 1 White patient 36.5800 50 11.97973 1.69419
BAME 60.0400 50 23.39192 3.30812
Paired Samples Correlations
N Correlation Sig.
Pair 1 White patient &
BAME 50 -.045 .757
Paired Samples Test
Paired Differences t df Sig. (2-
tailed)Mean Std.
Deviation
Std.
Error
Mean
98% Confidence
Interval of the
Difference
Lower Upper
Pair
1
White
patient -
BAME
-
23.46000 26.75529 3.78377 -
32.55955
-
14.36045
-
6.200 49 .000
Interpretation: In accordance with the above statistics table and output, it has been
identified that alternative hypothesis is accepted over other because the significance value
generated through output is 0.00 which is lower than 0.02. This in turn shows due to change in
infection rate of covid-19, there is a difference identified over BAME and White people. Thus, it
can be stated that if the infection rate within a country increases there is a direct impact identified
over the people and increase the infection rate as well.
Presence of any outliers in the data
The presence of an outlier refers to the pattern of a distribution and it mainly indicates
some sort of problem within a dataset. Also, this can be a case where the model is not fit under a
Paraphrase This Document
Need a fresh take? Get an instant paraphrase of this document with our AI Paraphraser
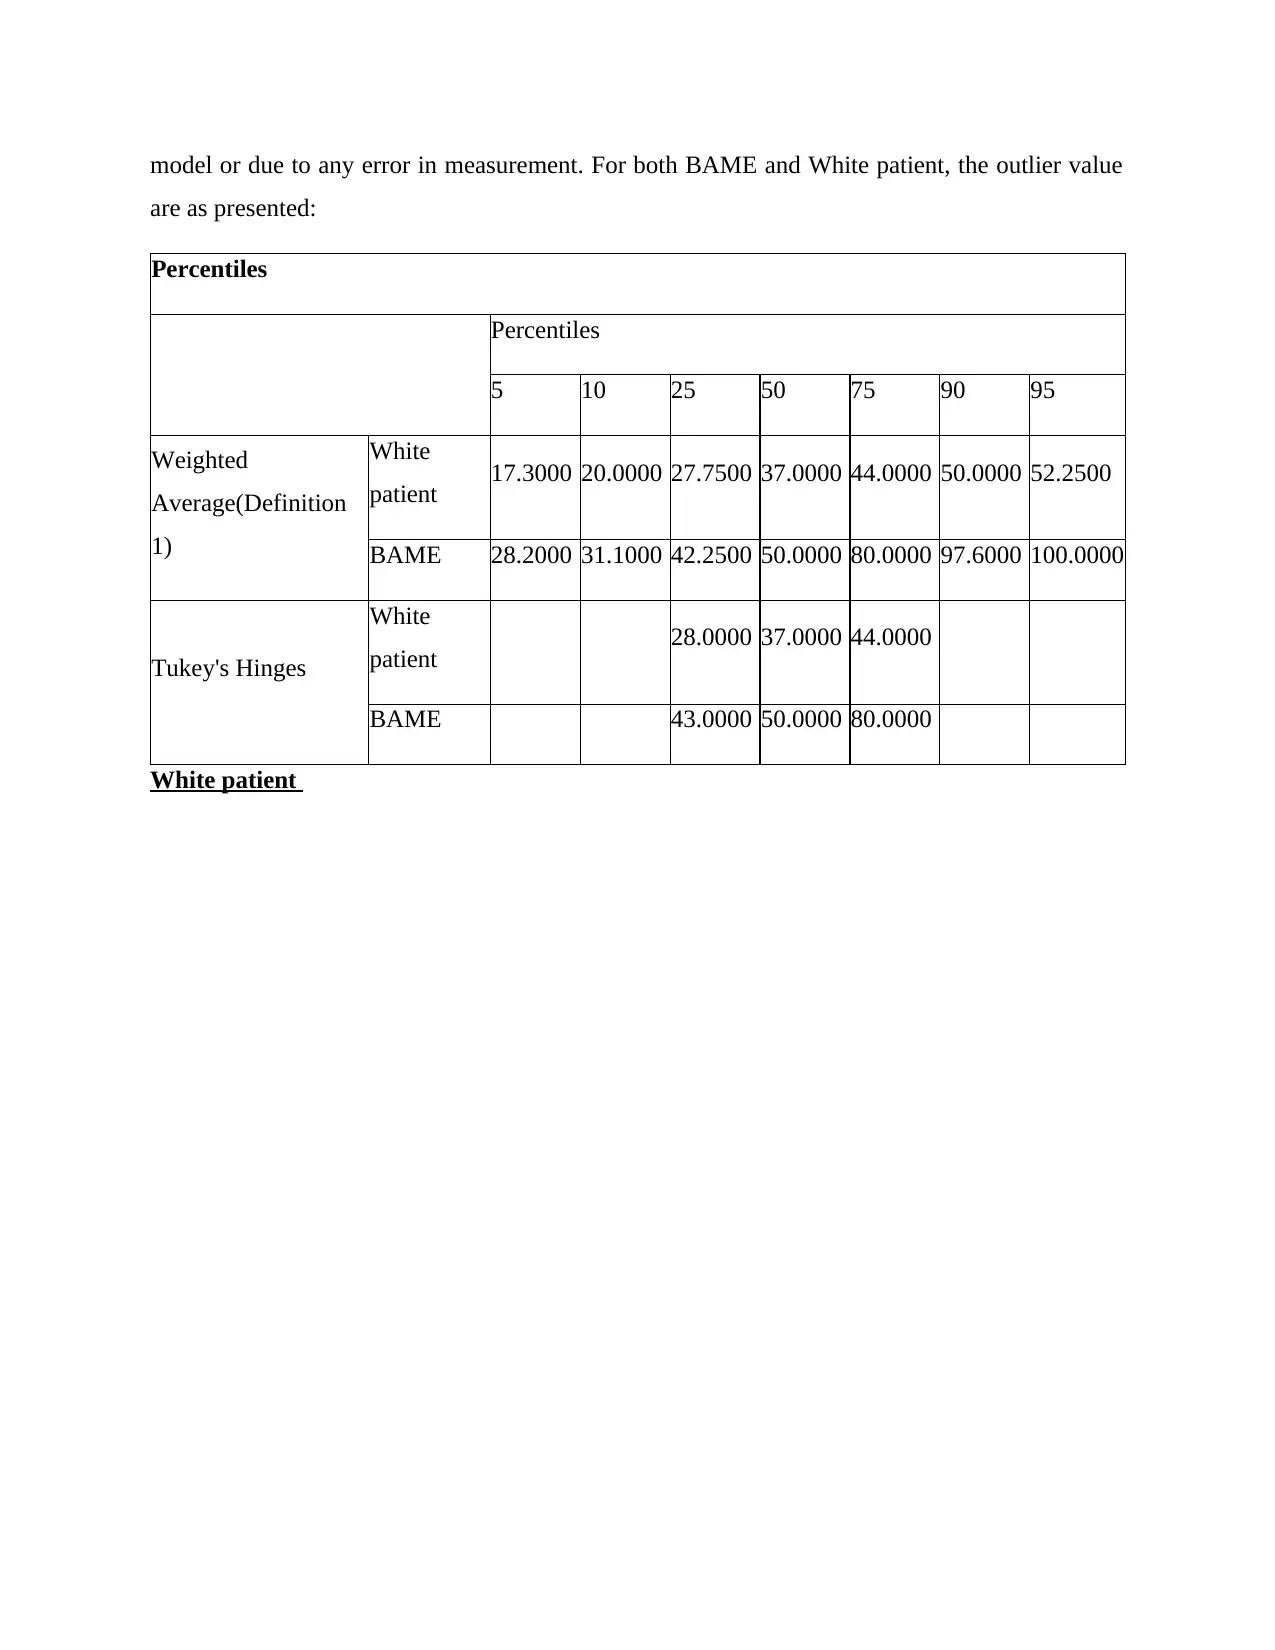
model or due to any error in measurement. For both BAME and White patient, the outlier value
are as presented:
Percentiles
Percentiles
5 10 25 50 75 90 95
Weighted
Average(Definition
1)
White
patient 17.3000 20.0000 27.7500 37.0000 44.0000 50.0000 52.2500
BAME 28.2000 31.1000 42.2500 50.0000 80.0000 97.6000 100.0000
Tukey's Hinges
White
patient 28.0000 37.0000 44.0000
BAME 43.0000 50.0000 80.0000
White patient
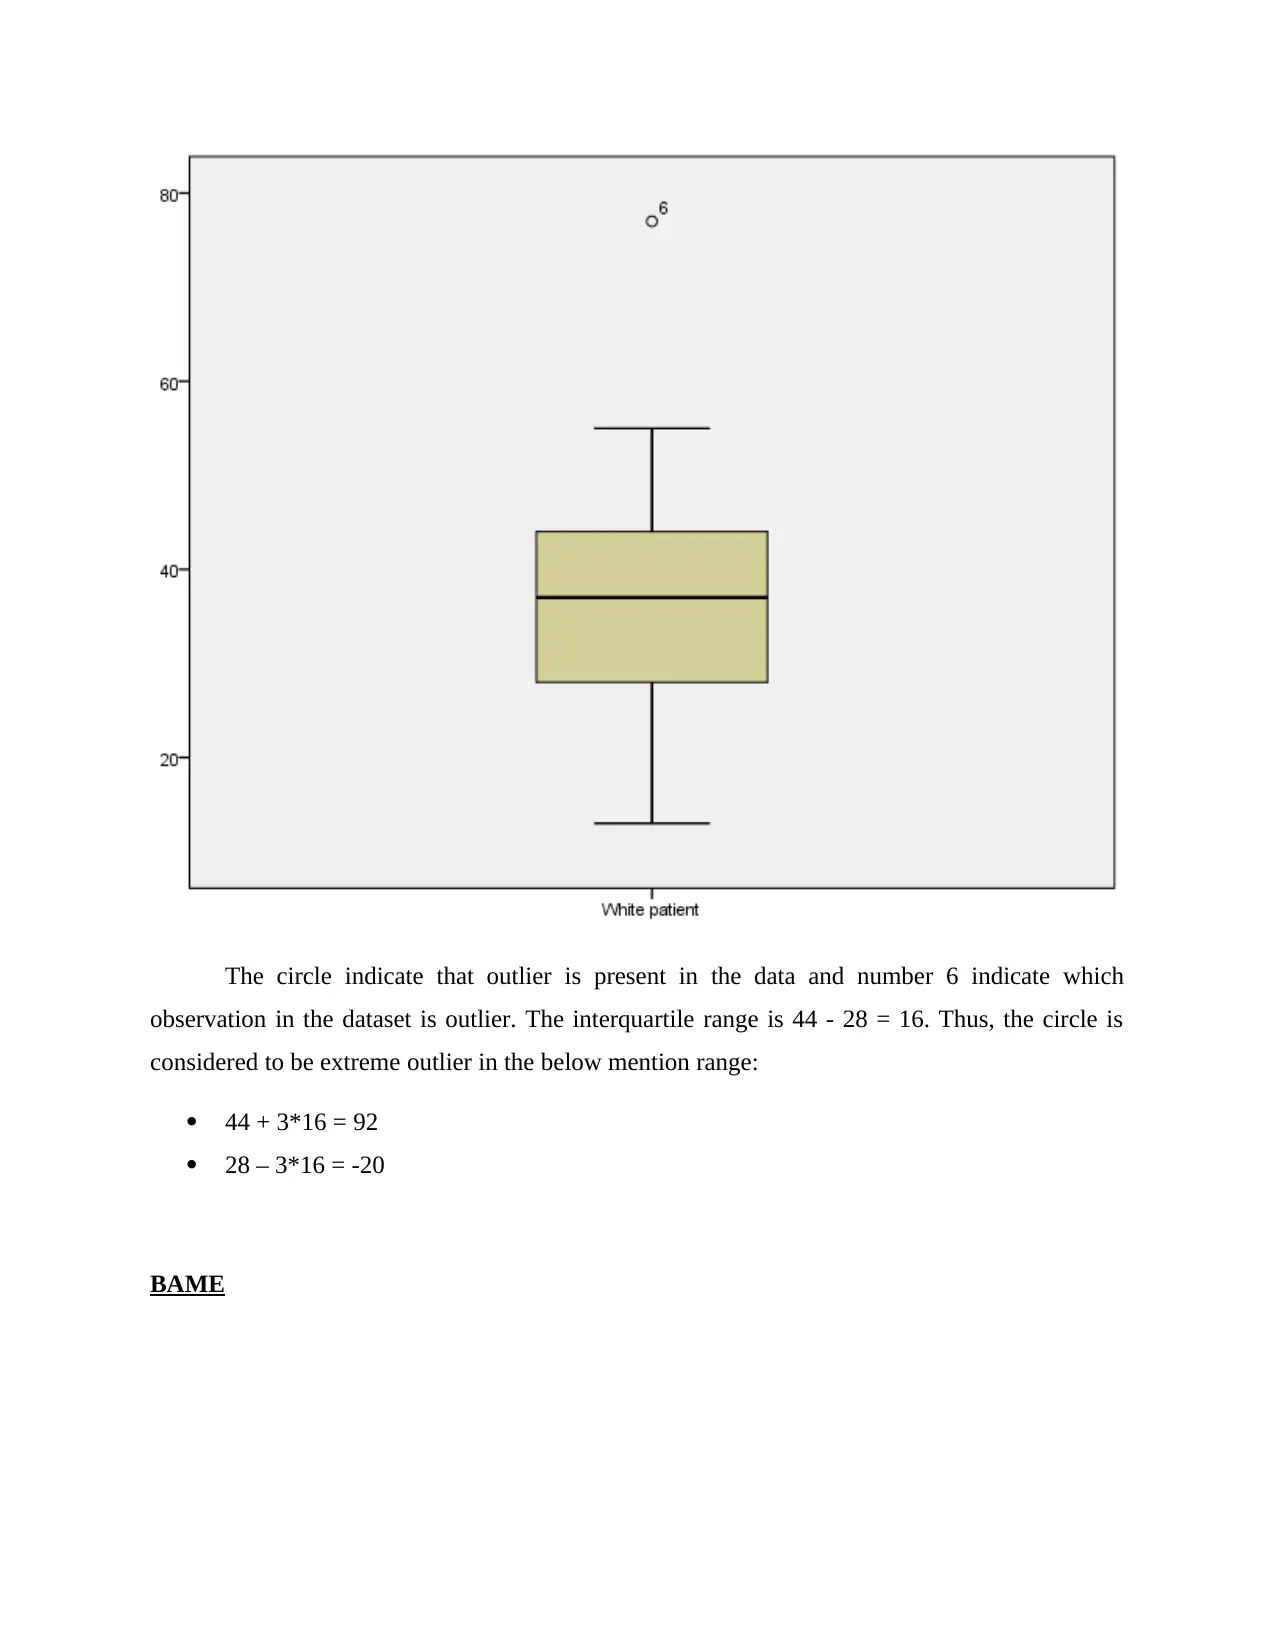
The circle indicate that outlier is present in the data and number 6 indicate which
observation in the dataset is outlier. The interquartile range is 44 - 28 = 16. Thus, the circle is
considered to be extreme outlier in the below mention range:
44 + 3*16 = 92
28 – 3*16 = -20
BAME
observation in the dataset is outlier. The interquartile range is 44 - 28 = 16. Thus, the circle is
considered to be extreme outlier in the below mention range:
44 + 3*16 = 92
28 – 3*16 = -20
BAME
⊘ This is a preview!⊘
Do you want full access?
Subscribe today to unlock all pages.
Trusted by 1+ million students worldwide
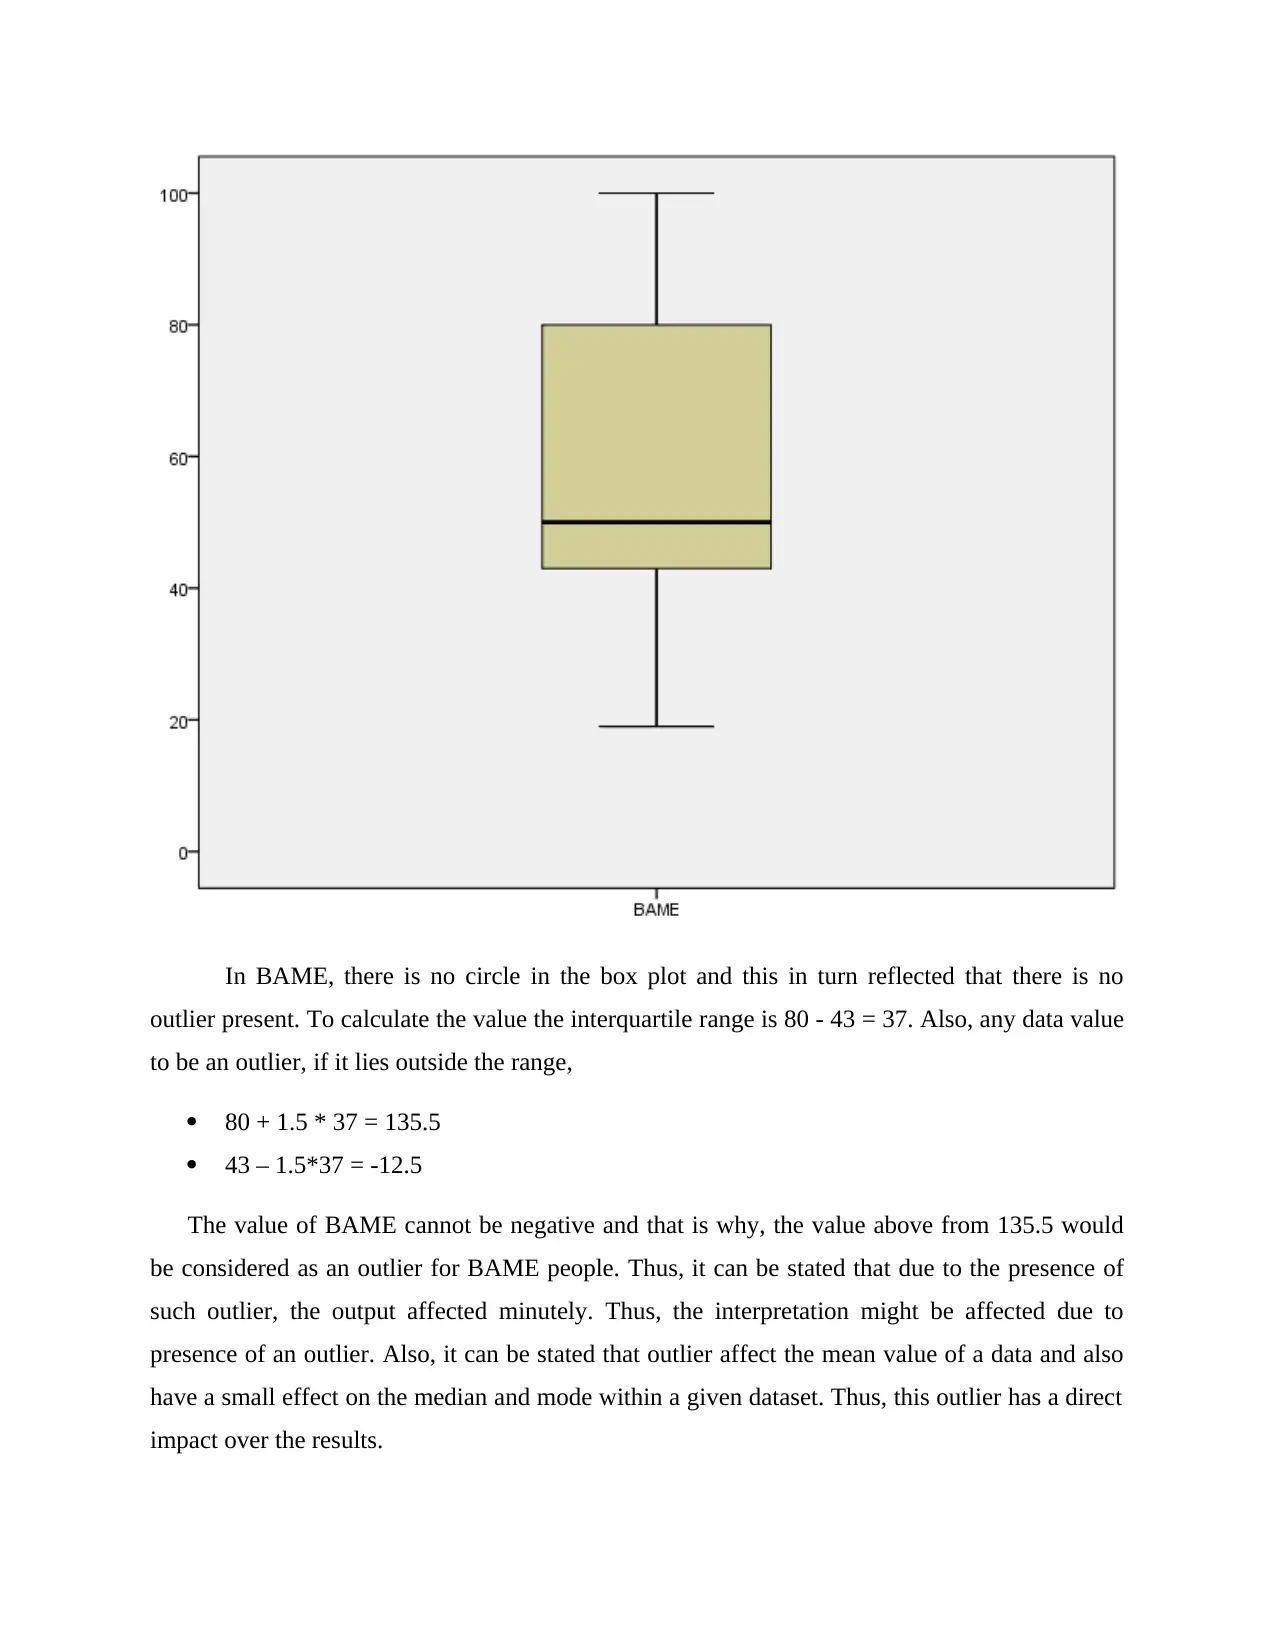
In BAME, there is no circle in the box plot and this in turn reflected that there is no
outlier present. To calculate the value the interquartile range is 80 - 43 = 37. Also, any data value
to be an outlier, if it lies outside the range,
80 + 1.5 * 37 = 135.5
43 – 1.5*37 = -12.5
The value of BAME cannot be negative and that is why, the value above from 135.5 would
be considered as an outlier for BAME people. Thus, it can be stated that due to the presence of
such outlier, the output affected minutely. Thus, the interpretation might be affected due to
presence of an outlier. Also, it can be stated that outlier affect the mean value of a data and also
have a small effect on the median and mode within a given dataset. Thus, this outlier has a direct
impact over the results.
Paraphrase This Document
Need a fresh take? Get an instant paraphrase of this document with our AI Paraphraser
Any other features of the data that appear during your investigation of the dataset
Yes, there are some more data which needs to be included within a defined data set
because it does not provide enough information. The data which can be included within a data is
gender or region of UK where White patient and BAME relates to. This in turn also helps to
determine which region is highly affected due to infected Covid-19 (Razai and et.al., 2021).
Along with this, by including the gender of each 50 patients also assists to determine which type
of gender are highly affected. Through this, the study provides in-depth details about the data
and the relationship can be identified easily. In addition to this, the data set provide the age group
in common and that is why, the variation between all the selected respondents can be identified
in term of their age. With the help of these variables, study derive the results which examine
whether the null or alternative hypothesis is accepted. That is why, by including more feature
within a dataset will be far beneficial for a dataset so that effective results can be generated.
Any other factors that might affect the results
There ae some factors which are not considered while generating the output and this
might affect the results. For the present dataset, controlled variable are not considered and this in
turn affect the results as well. However, the dataset has only two main variable i.e. White people
and BAME, at the initial stage, most of the other factors had considered but in order to determine
the difference between the mean group, only these are considered (Kelter, 2020). So, using
controlled method will also be used that assist to derive better outcome and might have affect the
hypothesis testing as well. In addition to this, another factor that was earlier identified is people
other than BAME and White who are also affected due to Covid-19.
Thus, to improve such factors, it is suggested to perform effective research so that all the
essential factors can be included within a research. Also, it can be stated that through effective
research and collect sources from these will assist to generate the better outcome (West, 2021).
This in turn also analyse that, if scholar do not consider such factors, the result might be affected.
That is why, there is a need to perform research which in turn help scholar to create valid results
that somehow lead to cause positive impact upon results and meet the research question as well.
CONCLUSION
By summing up above report, it has been concluded that there is a significant difference
between infection rate of Covid-19 and White as well as BAME people. Also, at different level

of significance, alternative hypothesis is accepted over null and this in turn shows that infected
rate of Covid-19 might be varied within BAME and White people. However, the result also
reflected the outlier in White people whereas not in BAME. Overall, it can be concluded that by
using T-test, the answer can be generated between different groups.
rate of Covid-19 might be varied within BAME and White people. However, the result also
reflected the outlier in White people whereas not in BAME. Overall, it can be concluded that by
using T-test, the answer can be generated between different groups.
⊘ This is a preview!⊘
Do you want full access?
Subscribe today to unlock all pages.
Trusted by 1+ million students worldwide
1 out of 13
Related Documents


Your All-in-One AI-Powered Toolkit for Academic Success.
+13062052269
info@desklib.com
Available 24*7 on WhatsApp / Email
![[object Object]](/_next/static/media/star-bottom.7253800d.svg)
Unlock your academic potential
Copyright © 2020–2026 A2Z Services. All Rights Reserved. Developed and managed by ZUCOL.