Tesco's Data Analysis: Key Sources, Framework, and Implementation
VerifiedAdded on 2023/01/11
|19
|6871
|91
Report
AI Summary
This report provides a comprehensive analysis of Tesco's data-driven decision-making processes. It begins by identifying key data sources, including financial and non-financial data, and maps them to relevant business functions within Tesco PLC and Tesco Bank. The report highlights gaps in data integrity, such as issues with accuracy, timeliness, and completeness. It then proposes a big data analytics framework, suggesting an ERP system for financial modules to address these gaps. The implementation of this framework is outlined using the CRISP-DM methodology, detailing data understanding, business understanding, data preparation, modeling, evaluation, and deployment phases. Furthermore, the report addresses data protection and ethical considerations, emphasizing compliance with GDPR regulations. The analysis underscores Tesco's efforts to leverage data for enhanced decision-making, reduce costs, and improve consumer behavior understanding. This report is a valuable resource for students studying data analytics and business intelligence, offering insights into real-world applications of data analysis within a major retail organization.

Arden University
1
1
Paraphrase This Document
Need a fresh take? Get an instant paraphrase of this document with our AI Paraphraser
Executive Summary
Data-based decision making (DDDM) is an approach that involves the collection of information that
relies on key performance indicators or measurable indicators, the dissemination of examples and
real from these experiences and the used to create techniques and exercises for the benefit of the
business in various sectors.
Be that as it may, in order to separate the qualified inspiration from your information, it must be
accurate as applicable to your points. Collecting, separating, sorting and analyzing pieces of
information to develop knowledge-based dynamics in the business world was at the same time a
largely inclusive enterprise, which is usually different from the overall dynamic approach.
2
1. What are the key sources and flows of data that are collected,
processed, stored and taken into account in the organisation’s
decision making process?
1.1. Background to the case
The organisation which is selected to be audited in this audit report is Tesco group. Tesco Group is a
group of organisations which includes retail company “Tesco PLC” and a financial institution named
Tesco Bank. Tesco PLC is a British multinational groceries and general merchandise retailer. This
company has its headquarters in England, United Kingdom and this company was formed in 1919.
The key products and services of this company include groceries, home appliances, general
merchandising and many more. The products and services of Tesco Bank includes saving and credit
of money along with products such as credit and debit cards (Ataman, Kulick and Sim, 2011).
There are two markets in which Tesco PLC operates; the first market is the retail industry in which
Tesco PLC operates. The countries to which operations of Tesco PLC are limited include United
Kingdom, United States of America, India, Spain, France, China and many more. The second market
in which Tesco operates is retail banking market. In this market, Tesco Bank operates and its
functions are limited to the region of United Kingdom only.
Instead of being operating in multiple countries, most of the operations of Tesco PLC are limited to
United Kingdom only and due to political stability of this region, there are various issues and
challenges which are being faced by Tesco(Arganda-Carreras and et. al., 2017). Tesco is a large scale
company which is impacted by every action of government. Due to BREXIT implementation,
improvement and growth ratio of Tesco has already been reduced till 2019. 2020 was the healing
year of TESCO, but due to current pandemic caused because of COVID 19, the declining of growth
continues in 2020 as well. This company is facing issues of increasing debts and reducing return on
capital employed. The revenues and profits of Tesco PLC are continuously increasing but these
profits are not compatible with the increasing number of stores of this company. The increment
trend of profits is positive but the pace of increment is decreasing.
1.2. Audit of key data sources
Financial data sources are the sourced which assist in gaining data regarding monetary
information of the company. On the other hand, non financial data sources are the sources which
helps in gaining managerial information. Tesco is a large scale company which uses annual report
and interim reports as key their key financial data sources. In addition, Tesco uses cost sheets and
inventory management report as their non financial data sources.
Table 1.1. Key financial and non-financial types of data in the case study
No Data source Data type Financial or non-financial Business units or departments
using this data
1 Annual
report
Income statement Financial Selling and Distribution
department, HR, Marketing
2 Annual
report
Balance sheet Financial Research and Development
department
3
⊘ This is a preview!⊘
Do you want full access?
Subscribe today to unlock all pages.
Trusted by 1+ million students worldwide
3 Annual
report
Cash flows Financial Production department.
4 Annual
report
Statement of
changes in equity
Financial Public relations department
5 Annual
report
Statement of
comprehensive
income and loss
Financial Finance department
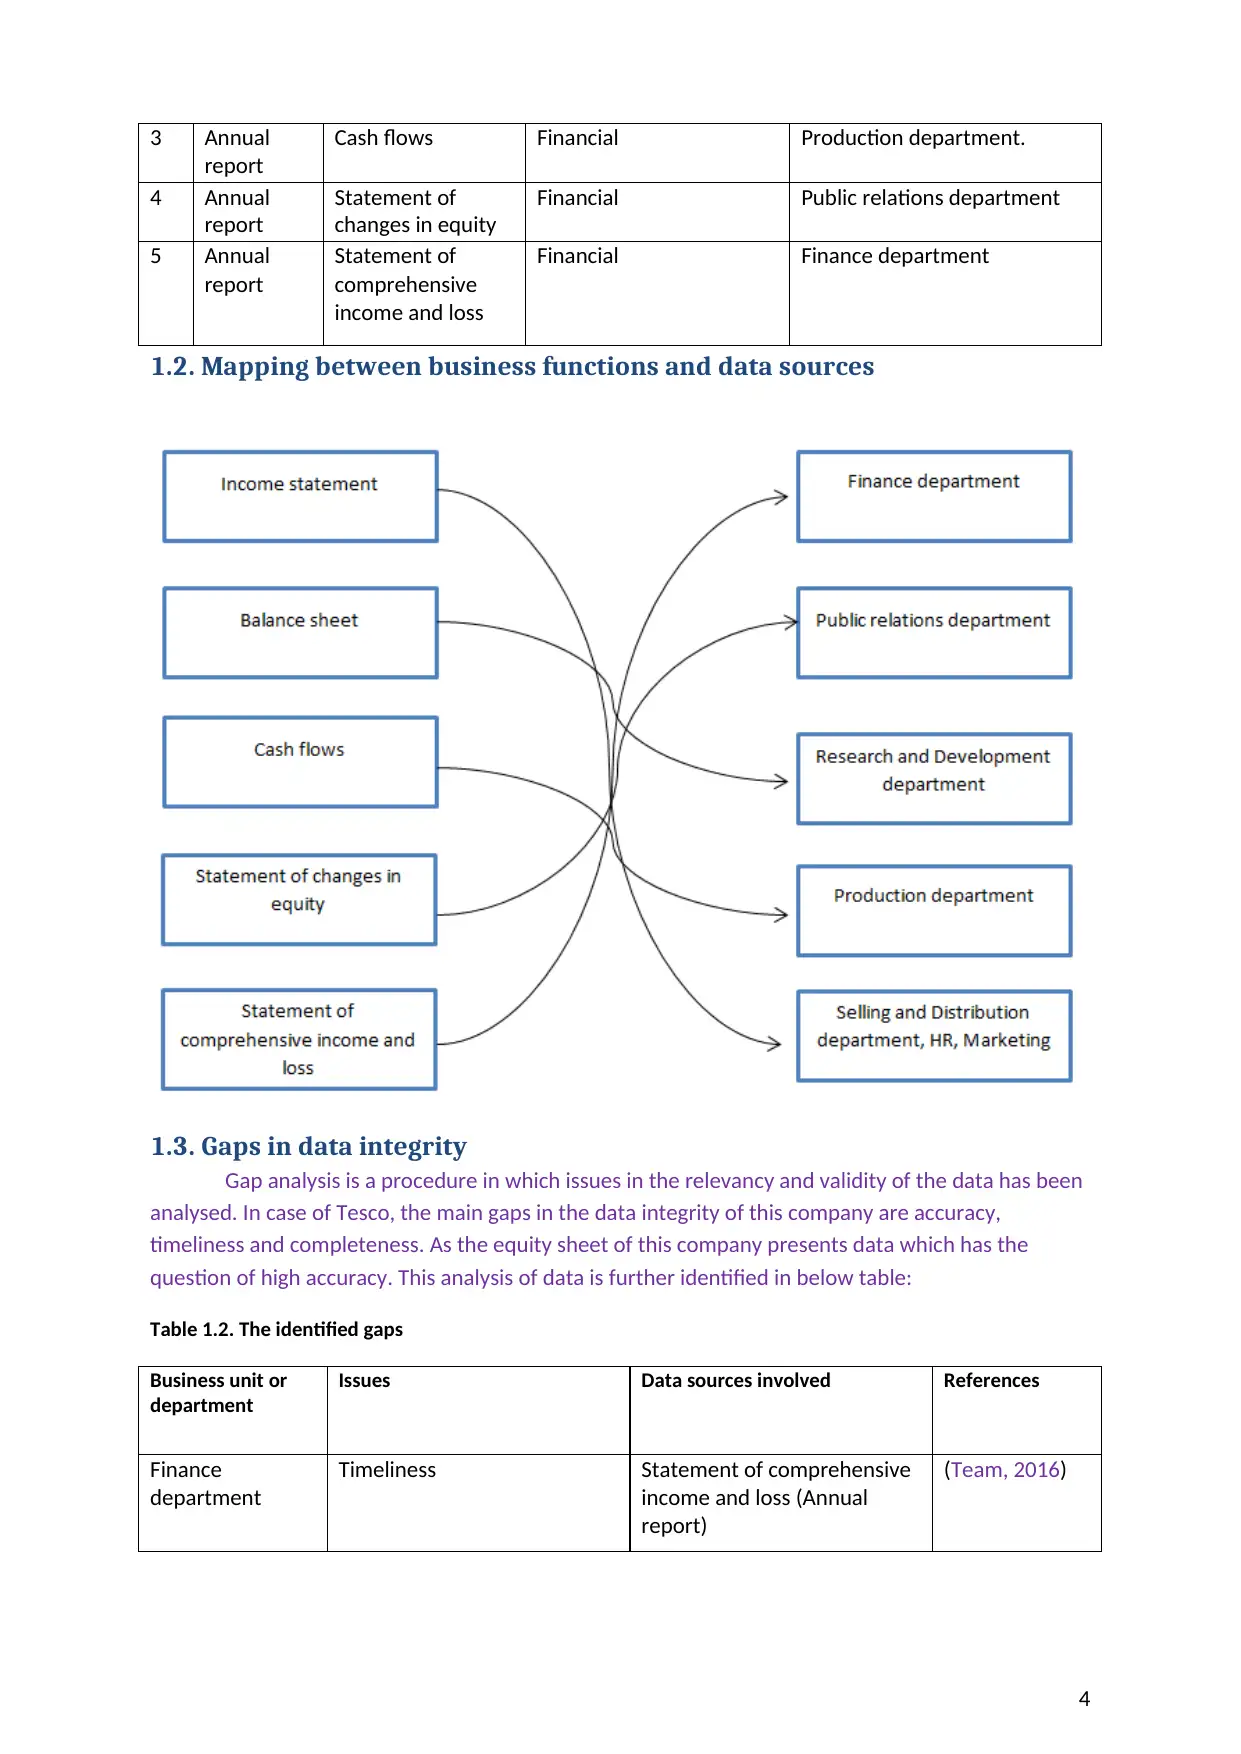
1.2. Mapping between business functions and data sources
1.3. Gaps in data integrity
Gap analysis is a procedure in which issues in the relevancy and validity of the data has been
analysed. In case of Tesco, the main gaps in the data integrity of this company are accuracy,
timeliness and completeness. As the equity sheet of this company presents data which has the
question of high accuracy. This analysis of data is further identified in below table:
Table 1.2. The identified gaps
Business unit or
department
Issues Data sources involved References
Finance
department
Timeliness Statement of comprehensive
income and loss (Annual
report)
(Team, 2016)
4
report
Cash flows Financial Production department.
4 Annual
report
Statement of
changes in equity
Financial Public relations department
5 Annual
report
Statement of
comprehensive
income and loss
Financial Finance department
1.2. Mapping between business functions and data sources
1.3. Gaps in data integrity
Gap analysis is a procedure in which issues in the relevancy and validity of the data has been
analysed. In case of Tesco, the main gaps in the data integrity of this company are accuracy,
timeliness and completeness. As the equity sheet of this company presents data which has the
question of high accuracy. This analysis of data is further identified in below table:
Table 1.2. The identified gaps
Business unit or
department
Issues Data sources involved References
Finance
department
Timeliness Statement of comprehensive
income and loss (Annual
report)
(Team, 2016)
4
Paraphrase This Document
Need a fresh take? Get an instant paraphrase of this document with our AI Paraphraser
Public relations
department
Accuracy Statement of changes in
equity (Annual report)
Production
department
Completeness Statement of Cash flows
(Annual report)
2. How can a big data analytics framework be implemented in
the chosen organisation?
Tesco is the UK's largest food retailer and has been a pioneer in innovation and information for some
time. It was one of the key market chains that began following consumer action through its dietary
card framework and has effectively addressed the transition to web-based retail.
It is currently confronting the problems brought about by the latest breakthrough in innovation: the
quest for sustainable data analysis, Big Data and the effects that can be made by it the rise in the
Internet of Things.
Applying the first-line test and the latest information is the shop's response to the management of
barriers from improving consumer behaviour, to looking for more conventional competitors. A large
number of these (for example Amazon, which recently started carrying new food products) have
been developed from the outset by advanced and information-based societies.
Much of the business progress starts within the Tesco Labs division, which was set up to explore new
innovations that could benefit the market and its customers. Tesco Labs has up to 50 simultaneous
businesses and experiments with VR and AR, connected home appliances, close to managing
exchanges and portable applications. It also regulates the typical hackathon times in which software
engineers compete to develop new leases.
Tesco’s general store is facing a number of obstacles, ranging from improving consumer behaviour
and the need to cut down on food, to new competitors. Tesco's answer to these problems is at the
forefront, constant monitoring and the latest information.
For example, by reflecting patterns in consumer behaviour, some valuable knowledge is diminished,
similar to how individuals shop. "It's not just about how they shop in all stores," says Mike Moss,
Tesco's decision and analysis manager, "however, how they get it all. Study, origin and the like, we
found that the way we think that things come together - the way we buy products - is usually the
way things work. " Using this information, the organization can organize the items in the correct
way, ensuring their regular availability, while reducing waste.
5
department
Accuracy Statement of changes in
equity (Annual report)
Production
department
Completeness Statement of Cash flows
(Annual report)
2. How can a big data analytics framework be implemented in
the chosen organisation?
Tesco is the UK's largest food retailer and has been a pioneer in innovation and information for some
time. It was one of the key market chains that began following consumer action through its dietary
card framework and has effectively addressed the transition to web-based retail.
It is currently confronting the problems brought about by the latest breakthrough in innovation: the
quest for sustainable data analysis, Big Data and the effects that can be made by it the rise in the
Internet of Things.
Applying the first-line test and the latest information is the shop's response to the management of
barriers from improving consumer behaviour, to looking for more conventional competitors. A large
number of these (for example Amazon, which recently started carrying new food products) have
been developed from the outset by advanced and information-based societies.
Much of the business progress starts within the Tesco Labs division, which was set up to explore new
innovations that could benefit the market and its customers. Tesco Labs has up to 50 simultaneous
businesses and experiments with VR and AR, connected home appliances, close to managing
exchanges and portable applications. It also regulates the typical hackathon times in which software
engineers compete to develop new leases.
Tesco’s general store is facing a number of obstacles, ranging from improving consumer behaviour
and the need to cut down on food, to new competitors. Tesco's answer to these problems is at the
forefront, constant monitoring and the latest information.
For example, by reflecting patterns in consumer behaviour, some valuable knowledge is diminished,
similar to how individuals shop. "It's not just about how they shop in all stores," says Mike Moss,
Tesco's decision and analysis manager, "however, how they get it all. Study, origin and the like, we
found that the way we think that things come together - the way we buy products - is usually the
way things work. " Using this information, the organization can organize the items in the correct
way, ensuring their regular availability, while reducing waste.
5
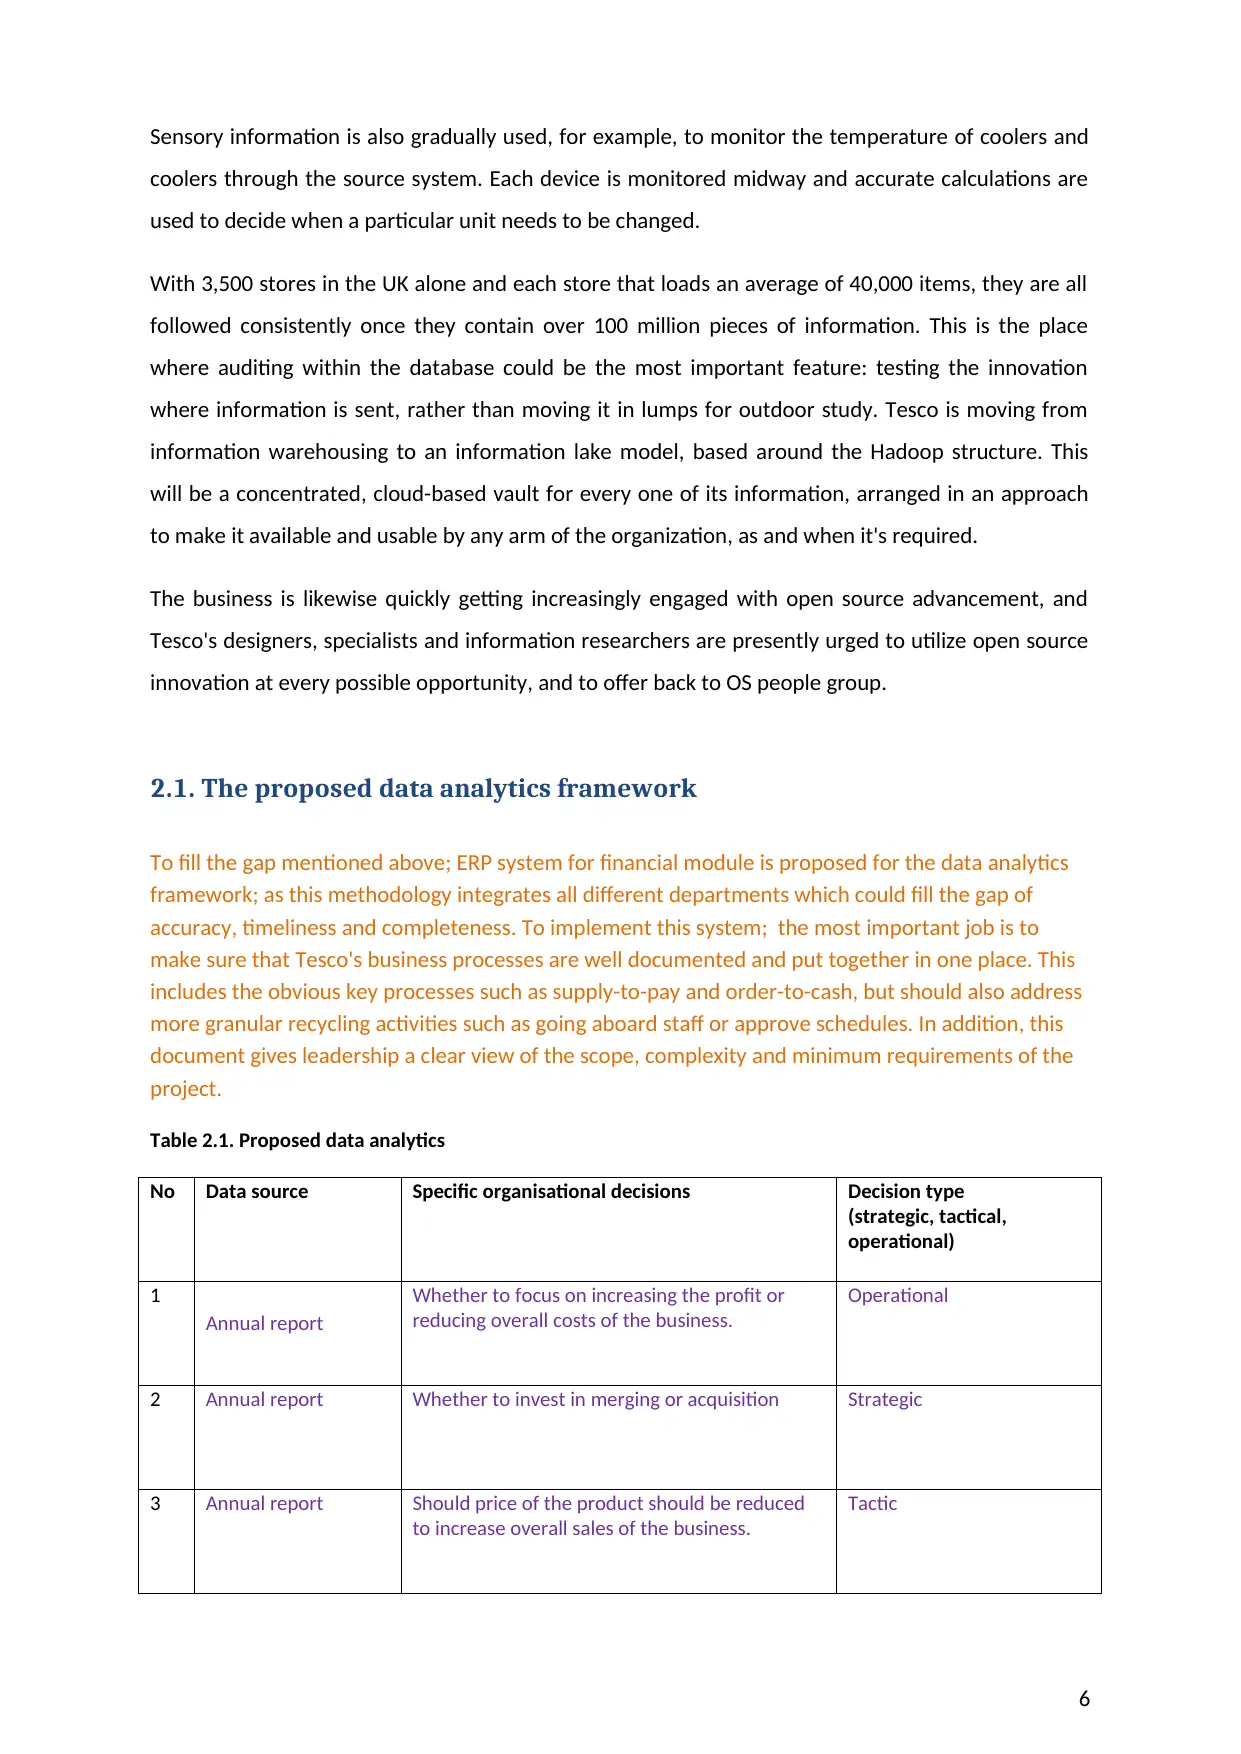
Sensory information is also gradually used, for example, to monitor the temperature of coolers and
coolers through the source system. Each device is monitored midway and accurate calculations are
used to decide when a particular unit needs to be changed.
With 3,500 stores in the UK alone and each store that loads an average of 40,000 items, they are all
followed consistently once they contain over 100 million pieces of information. This is the place
where auditing within the database could be the most important feature: testing the innovation
where information is sent, rather than moving it in lumps for outdoor study. Tesco is moving from
information warehousing to an information lake model, based around the Hadoop structure. This
will be a concentrated, cloud-based vault for every one of its information, arranged in an approach
to make it available and usable by any arm of the organization, as and when it's required.
The business is likewise quickly getting increasingly engaged with open source advancement, and
Tesco's designers, specialists and information researchers are presently urged to utilize open source
innovation at every possible opportunity, and to offer back to OS people group.
2.1. The proposed data analytics framework
To fill the gap mentioned above; ERP system for financial module is proposed for the data analytics
framework; as this methodology integrates all different departments which could fill the gap of
accuracy, timeliness and completeness. To implement this system; the most important job is to
make sure that Tesco's business processes are well documented and put together in one place. This
includes the obvious key processes such as supply-to-pay and order-to-cash, but should also address
more granular recycling activities such as going aboard staff or approve schedules. In addition, this
document gives leadership a clear view of the scope, complexity and minimum requirements of the
project.
Table 2.1. Proposed data analytics
No Data source Specific organisational decisions Decision type
(strategic, tactical,
operational)
1
Annual report
Whether to focus on increasing the profit or
reducing overall costs of the business.
Operational
2 Annual report Whether to invest in merging or acquisition Strategic
3 Annual report Should price of the product should be reduced
to increase overall sales of the business.
Tactic
6
⊘ This is a preview!⊘
Do you want full access?
Subscribe today to unlock all pages.
Trusted by 1+ million students worldwide
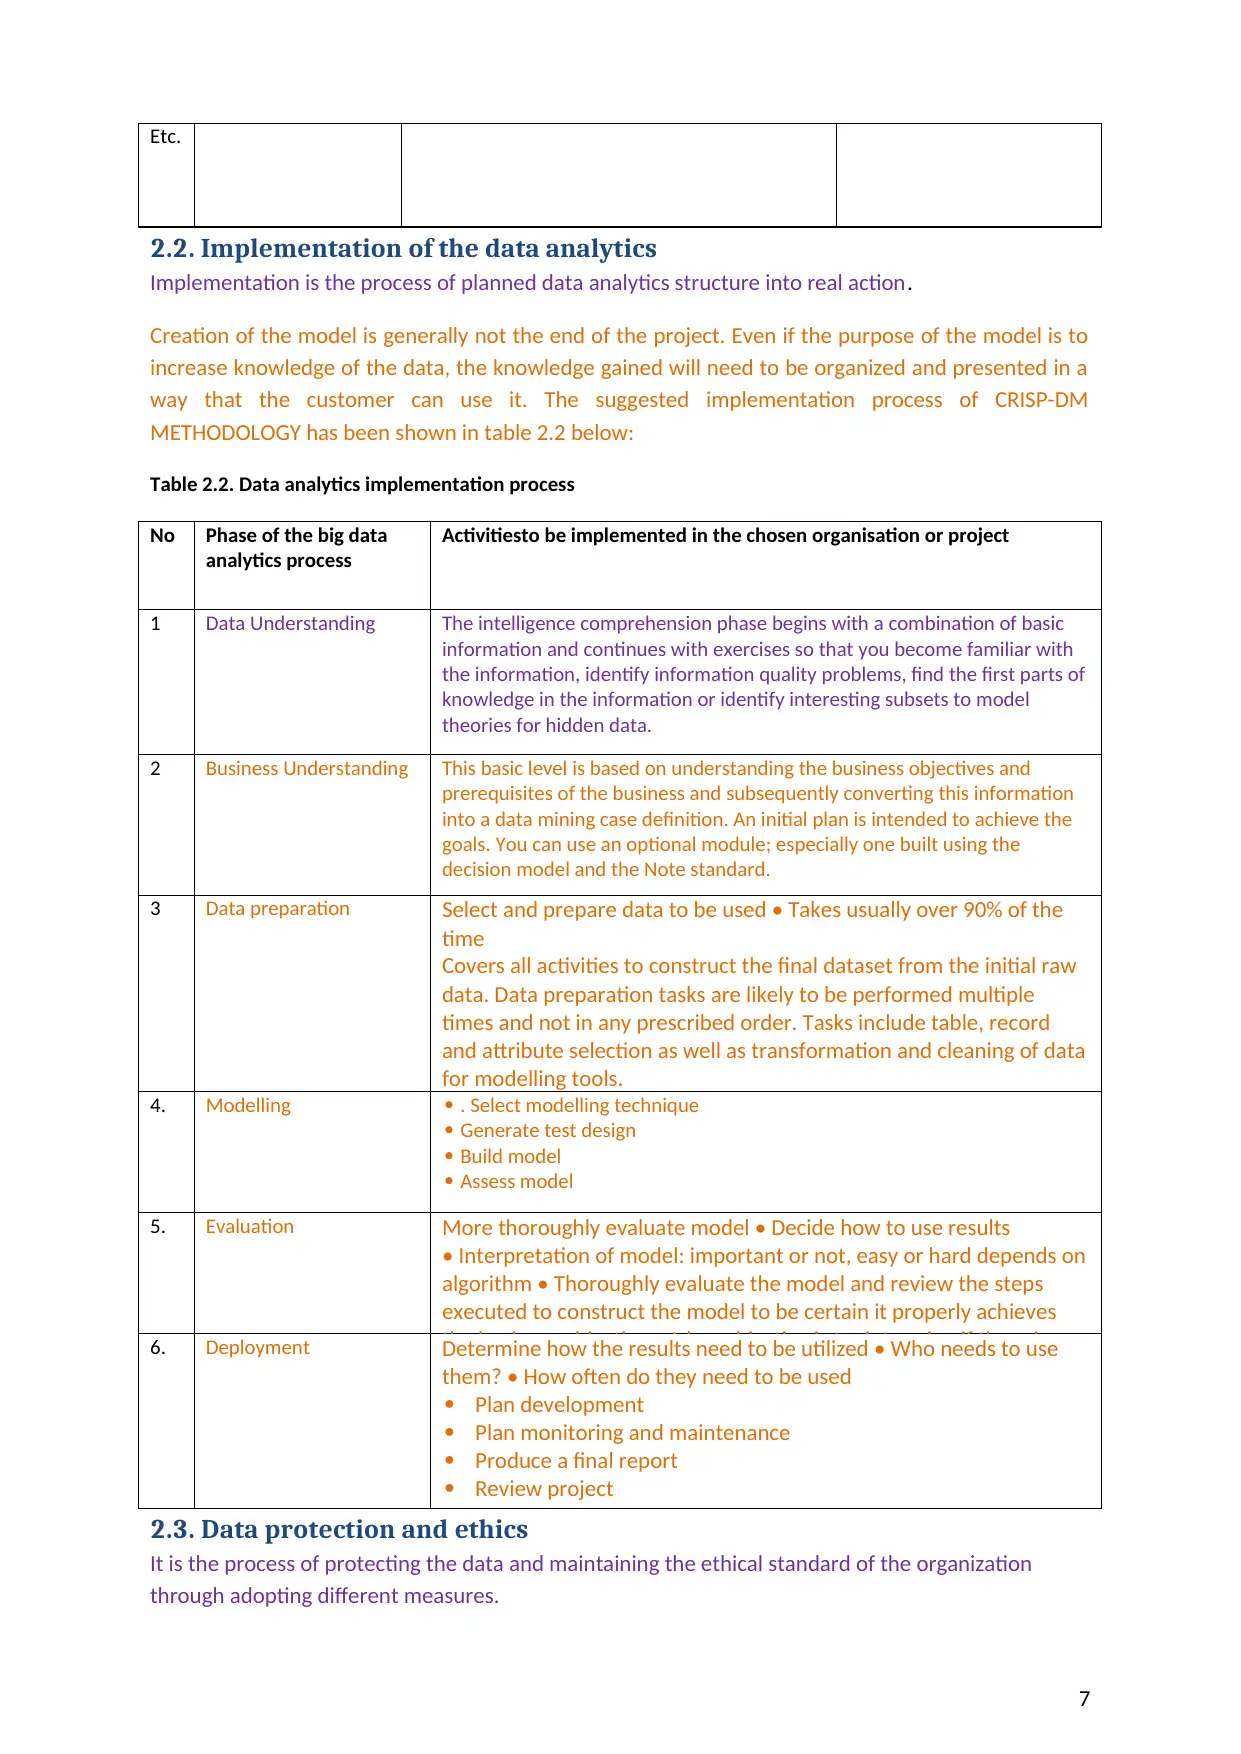
Etc.
2.2. Implementation of the data analytics
Implementation is the process of planned data analytics structure into real action.
Creation of the model is generally not the end of the project. Even if the purpose of the model is to
increase knowledge of the data, the knowledge gained will need to be organized and presented in a
way that the customer can use it. The suggested implementation process of CRISP-DM
METHODOLOGY has been shown in table 2.2 below:
Table 2.2. Data analytics implementation process
No Phase of the big data
analytics process
Activitiesto be implemented in the chosen organisation or project
1 Data Understanding The intelligence comprehension phase begins with a combination of basic
information and continues with exercises so that you become familiar with
the information, identify information quality problems, find the first parts of
knowledge in the information or identify interesting subsets to model
theories for hidden data.
2 Business Understanding This basic level is based on understanding the business objectives and
prerequisites of the business and subsequently converting this information
into a data mining case definition. An initial plan is intended to achieve the
goals. You can use an optional module; especially one built using the
decision model and the Note standard.
3 Data preparation Select and prepare data to be used • Takes usually over 90% of the
time
Covers all activities to construct the final dataset from the initial raw
data. Data preparation tasks are likely to be performed multiple
times and not in any prescribed order. Tasks include table, record
and attribute selection as well as transformation and cleaning of data
for modelling tools.
4. Modelling . Select modelling technique
Generate test design
Build model
Assess model
5. Evaluation More thoroughly evaluate model • Decide how to use results
• Interpretation of model: important or not, easy or hard depends on
algorithm • Thoroughly evaluate the model and review the steps
executed to construct the model to be certain it properly achieves
the business objectives. A key objective is to determine if there is6. Deployment Determine how the results need to be utilized • Who needs to use
them? • How often do they need to be used
Plan development
Plan monitoring and maintenance
Produce a final report
Review project
2.3. Data protection and ethics
It is the process of protecting the data and maintaining the ethical standard of the organization
through adopting different measures.
7
Paraphrase This Document
Need a fresh take? Get an instant paraphrase of this document with our AI Paraphraser
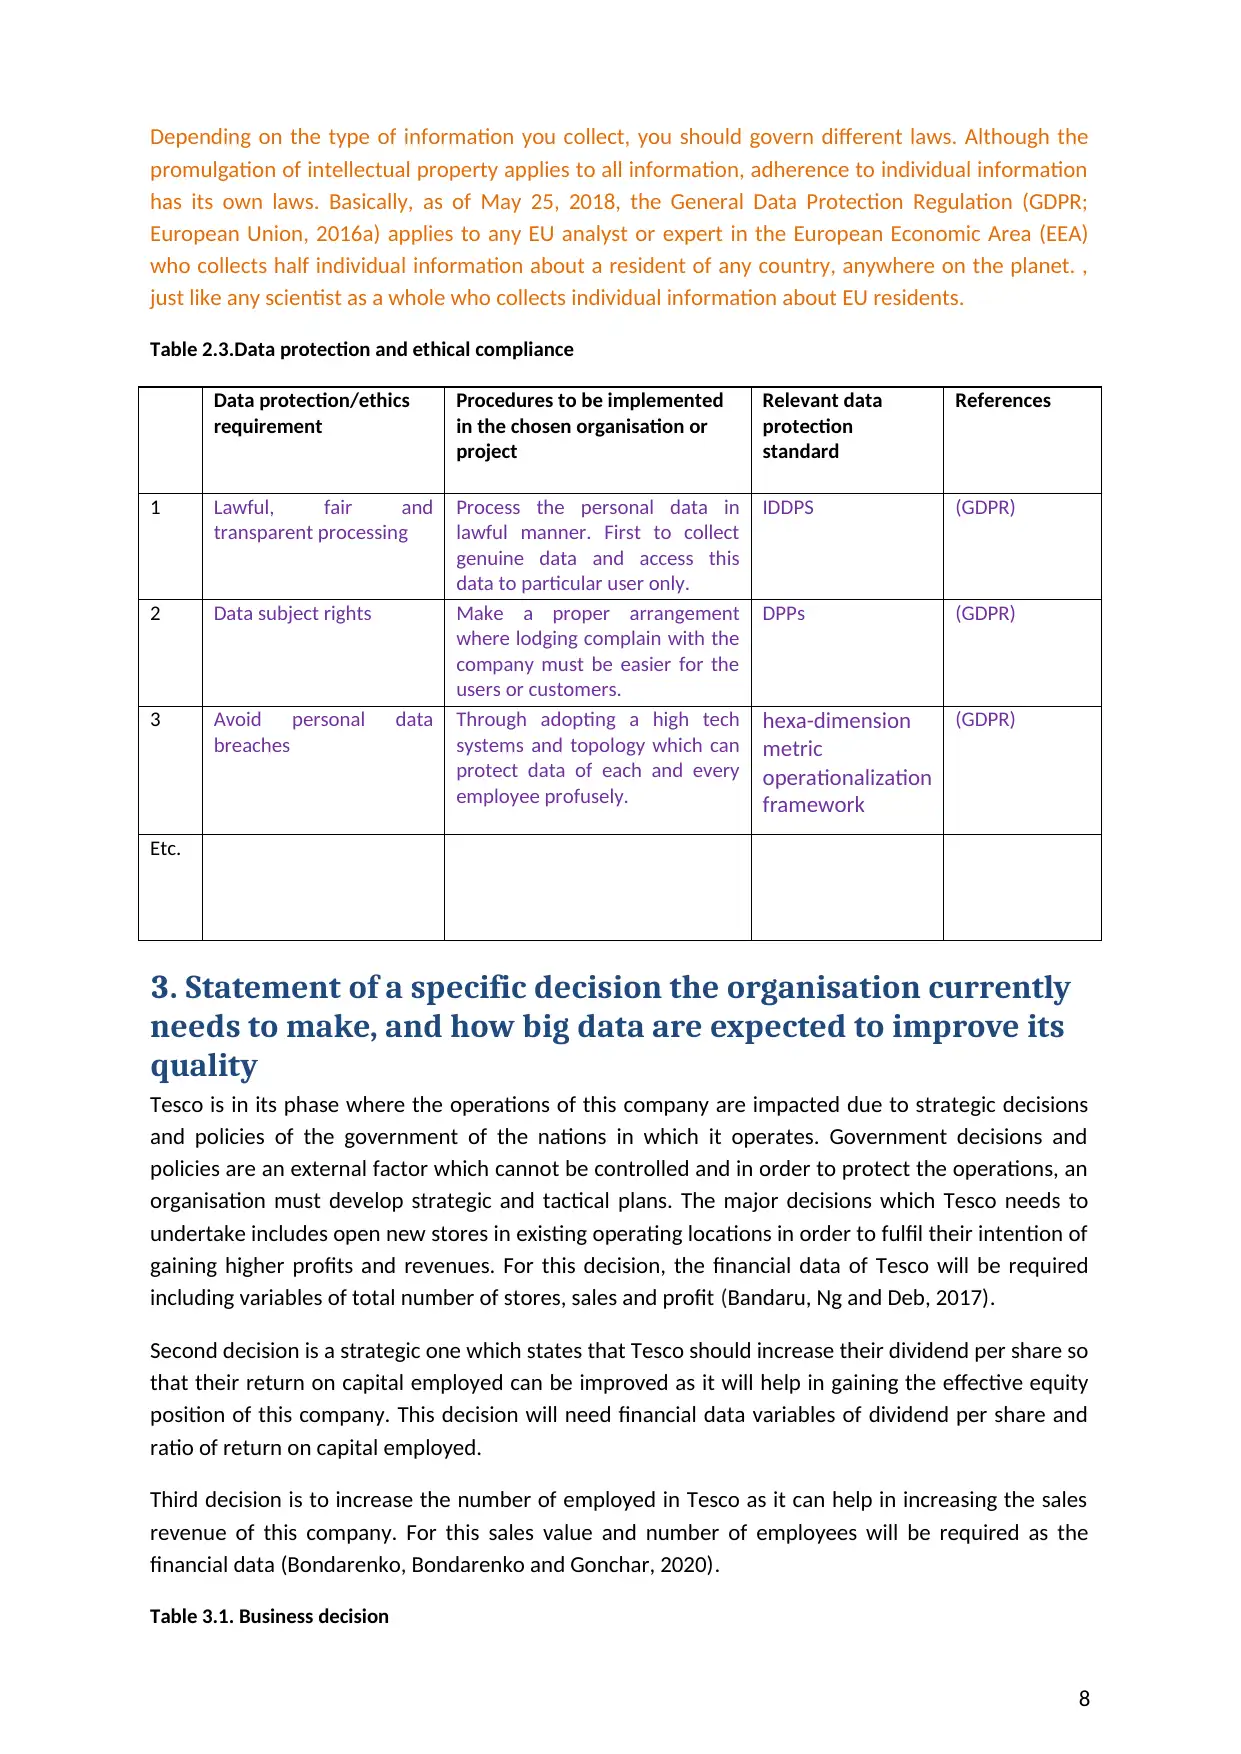
Depending on the type of information you collect, you should govern different laws. Although the
promulgation of intellectual property applies to all information, adherence to individual information
has its own laws. Basically, as of May 25, 2018, the General Data Protection Regulation (GDPR;
European Union, 2016a) applies to any EU analyst or expert in the European Economic Area (EEA)
who collects half individual information about a resident of any country, anywhere on the planet. ,
just like any scientist as a whole who collects individual information about EU residents.
Table 2.3.Data protection and ethical compliance
Data protection/ethics
requirement
Procedures to be implemented
in the chosen organisation or
project
Relevant data
protection
standard
References
1 Lawful, fair and
transparent processing
Process the personal data in
lawful manner. First to collect
genuine data and access this
data to particular user only.
IDDPS (GDPR)
2 Data subject rights Make a proper arrangement
where lodging complain with the
company must be easier for the
users or customers.
DPPs (GDPR)
3 Avoid personal data
breaches
Through adopting a high tech
systems and topology which can
protect data of each and every
employee profusely.
hexa-dimension
metric
operationalization
framework
(GDPR)
Etc.
3. Statement of a specific decision the organisation currently
needs to make, and how big data are expected to improve its
quality
Tesco is in its phase where the operations of this company are impacted due to strategic decisions
and policies of the government of the nations in which it operates. Government decisions and
policies are an external factor which cannot be controlled and in order to protect the operations, an
organisation must develop strategic and tactical plans. The major decisions which Tesco needs to
undertake includes open new stores in existing operating locations in order to fulfil their intention of
gaining higher profits and revenues. For this decision, the financial data of Tesco will be required
including variables of total number of stores, sales and profit (Bandaru, Ng and Deb, 2017).
Second decision is a strategic one which states that Tesco should increase their dividend per share so
that their return on capital employed can be improved as it will help in gaining the effective equity
position of this company. This decision will need financial data variables of dividend per share and
ratio of return on capital employed.
Third decision is to increase the number of employed in Tesco as it can help in increasing the sales
revenue of this company. For this sales value and number of employees will be required as the
financial data (Bondarenko, Bondarenko and Gonchar, 2020).
Table 3.1. Business decision
8
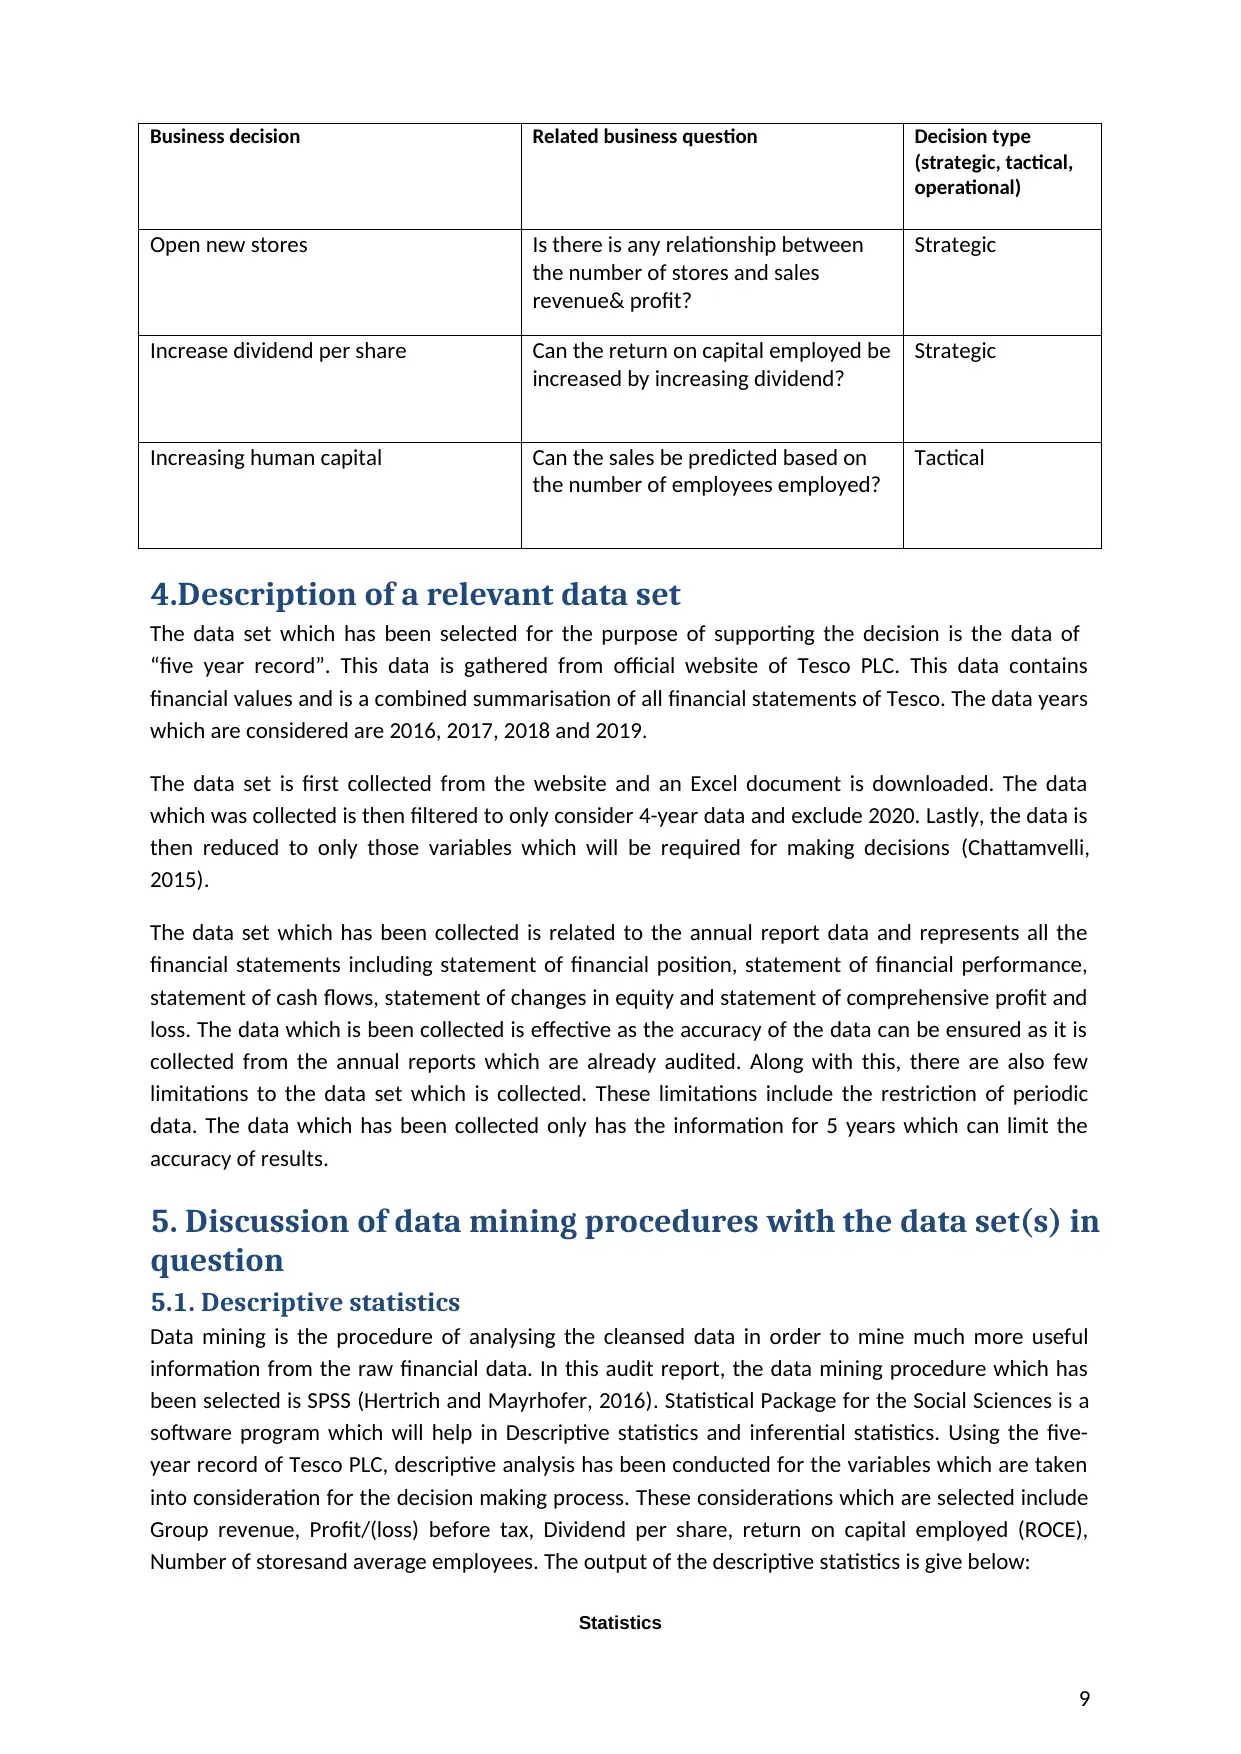
Business decision Related business question Decision type
(strategic, tactical,
operational)
Open new stores Is there is any relationship between
the number of stores and sales
revenue& profit?
Strategic
Increase dividend per share Can the return on capital employed be
increased by increasing dividend?
Strategic
Increasing human capital Can the sales be predicted based on
the number of employees employed?
Tactical
4.Description of a relevant data set
The data set which has been selected for the purpose of supporting the decision is the data of
“five year record”. This data is gathered from official website of Tesco PLC. This data contains
financial values and is a combined summarisation of all financial statements of Tesco. The data years
which are considered are 2016, 2017, 2018 and 2019.
The data set is first collected from the website and an Excel document is downloaded. The data
which was collected is then filtered to only consider 4-year data and exclude 2020. Lastly, the data is
then reduced to only those variables which will be required for making decisions (Chattamvelli,
2015).
The data set which has been collected is related to the annual report data and represents all the
financial statements including statement of financial position, statement of financial performance,
statement of cash flows, statement of changes in equity and statement of comprehensive profit and
loss. The data which is been collected is effective as the accuracy of the data can be ensured as it is
collected from the annual reports which are already audited. Along with this, there are also few
limitations to the data set which is collected. These limitations include the restriction of periodic
data. The data which has been collected only has the information for 5 years which can limit the
accuracy of results.
5. Discussion of data mining procedures with the data set(s) in
question
5.1. Descriptive statistics
Data mining is the procedure of analysing the cleansed data in order to mine much more useful
information from the raw financial data. In this audit report, the data mining procedure which has
been selected is SPSS (Hertrich and Mayrhofer, 2016). Statistical Package for the Social Sciences is a
software program which will help in Descriptive statistics and inferential statistics. Using the five-
year record of Tesco PLC, descriptive analysis has been conducted for the variables which are taken
into consideration for the decision making process. These considerations which are selected include
Group revenue, Profit/(loss) before tax, Dividend per share, return on capital employed (ROCE),
Number of storesand average employees. The output of the descriptive statistics is give below:
Statistics
9
⊘ This is a preview!⊘
Do you want full access?
Subscribe today to unlock all pages.
Trusted by 1+ million students worldwide
Year
Group
revenue
Profit/(loss)
before tax
Dividend
per share
Return on
capital
employed
(ROCE)
Number of
stores
Average
employees
N Valid 4 4 4 4 4 4 4
Missing 0 0 0 0 0 0 0
Mean 2017.50 57813.50 816.00 8.300% 6892.00 463353.00
Median 2017.50 56705.00 751.00 8.000% 6901.00 464512.50
Mode 2016a 53933a 145a 6.2%a 6733a 448988a
Std. Deviation 1.291 4318.071 753.457 1.9916% 144.051 10865.056
Variance 1.667 18645739.667 567698.000 3.967 20750.667 118049444.667
Minimum 2016 53933 145 6.2% 6733 448988
Maximum 2019 63911 1617 11.0% 7033 475399
Sum 8070 231254 3264 33.2% 27568 1853412
a. Multiple modes exist. The smallest value is shown
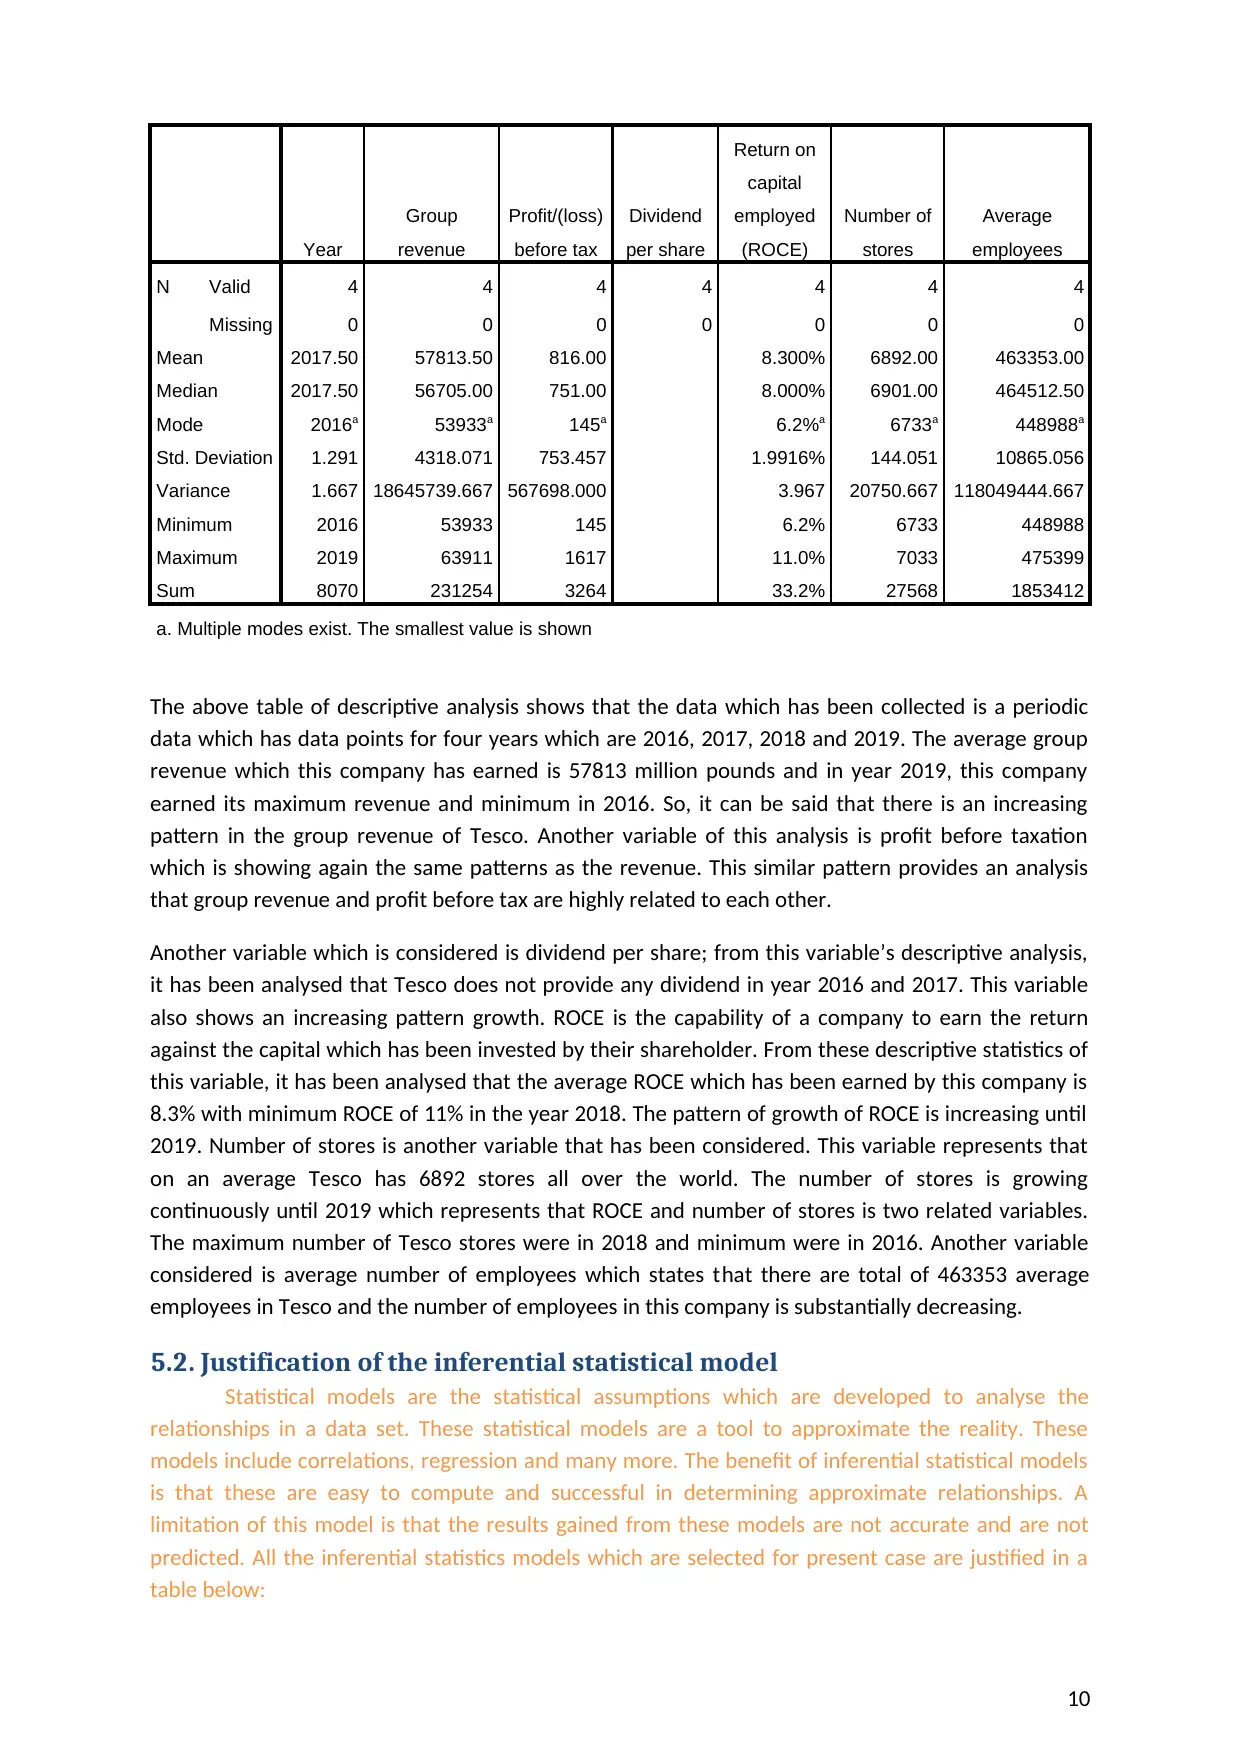
The above table of descriptive analysis shows that the data which has been collected is a periodic
data which has data points for four years which are 2016, 2017, 2018 and 2019. The average group
revenue which this company has earned is 57813 million pounds and in year 2019, this company
earned its maximum revenue and minimum in 2016. So, it can be said that there is an increasing
pattern in the group revenue of Tesco. Another variable of this analysis is profit before taxation
which is showing again the same patterns as the revenue. This similar pattern provides an analysis
that group revenue and profit before tax are highly related to each other.
Another variable which is considered is dividend per share; from this variable’s descriptive analysis,
it has been analysed that Tesco does not provide any dividend in year 2016 and 2017. This variable
also shows an increasing pattern growth. ROCE is the capability of a company to earn the return
against the capital which has been invested by their shareholder. From these descriptive statistics of
this variable, it has been analysed that the average ROCE which has been earned by this company is
8.3% with minimum ROCE of 11% in the year 2018. The pattern of growth of ROCE is increasing until
2019. Number of stores is another variable that has been considered. This variable represents that
on an average Tesco has 6892 stores all over the world. The number of stores is growing
continuously until 2019 which represents that ROCE and number of stores is two related variables.
The maximum number of Tesco stores were in 2018 and minimum were in 2016. Another variable
considered is average number of employees which states that there are total of 463353 average
employees in Tesco and the number of employees in this company is substantially decreasing.
5.2. Justification of the inferential statistical model
Statistical models are the statistical assumptions which are developed to analyse the
relationships in a data set. These statistical models are a tool to approximate the reality. These
models include correlations, regression and many more. The benefit of inferential statistical models
is that these are easy to compute and successful in determining approximate relationships. A
limitation of this model is that the results gained from these models are not accurate and are not
predicted. All the inferential statistics models which are selected for present case are justified in a
table below:
10
Group
revenue
Profit/(loss)
before tax
Dividend
per share
Return on
capital
employed
(ROCE)
Number of
stores
Average
employees
N Valid 4 4 4 4 4 4 4
Missing 0 0 0 0 0 0 0
Mean 2017.50 57813.50 816.00 8.300% 6892.00 463353.00
Median 2017.50 56705.00 751.00 8.000% 6901.00 464512.50
Mode 2016a 53933a 145a 6.2%a 6733a 448988a
Std. Deviation 1.291 4318.071 753.457 1.9916% 144.051 10865.056
Variance 1.667 18645739.667 567698.000 3.967 20750.667 118049444.667
Minimum 2016 53933 145 6.2% 6733 448988
Maximum 2019 63911 1617 11.0% 7033 475399
Sum 8070 231254 3264 33.2% 27568 1853412
a. Multiple modes exist. The smallest value is shown
The above table of descriptive analysis shows that the data which has been collected is a periodic
data which has data points for four years which are 2016, 2017, 2018 and 2019. The average group
revenue which this company has earned is 57813 million pounds and in year 2019, this company
earned its maximum revenue and minimum in 2016. So, it can be said that there is an increasing
pattern in the group revenue of Tesco. Another variable of this analysis is profit before taxation
which is showing again the same patterns as the revenue. This similar pattern provides an analysis
that group revenue and profit before tax are highly related to each other.
Another variable which is considered is dividend per share; from this variable’s descriptive analysis,
it has been analysed that Tesco does not provide any dividend in year 2016 and 2017. This variable
also shows an increasing pattern growth. ROCE is the capability of a company to earn the return
against the capital which has been invested by their shareholder. From these descriptive statistics of
this variable, it has been analysed that the average ROCE which has been earned by this company is
8.3% with minimum ROCE of 11% in the year 2018. The pattern of growth of ROCE is increasing until
2019. Number of stores is another variable that has been considered. This variable represents that
on an average Tesco has 6892 stores all over the world. The number of stores is growing
continuously until 2019 which represents that ROCE and number of stores is two related variables.
The maximum number of Tesco stores were in 2018 and minimum were in 2016. Another variable
considered is average number of employees which states that there are total of 463353 average
employees in Tesco and the number of employees in this company is substantially decreasing.
5.2. Justification of the inferential statistical model
Statistical models are the statistical assumptions which are developed to analyse the
relationships in a data set. These statistical models are a tool to approximate the reality. These
models include correlations, regression and many more. The benefit of inferential statistical models
is that these are easy to compute and successful in determining approximate relationships. A
limitation of this model is that the results gained from these models are not accurate and are not
predicted. All the inferential statistics models which are selected for present case are justified in a
table below:
10
Paraphrase This Document
Need a fresh take? Get an instant paraphrase of this document with our AI Paraphraser
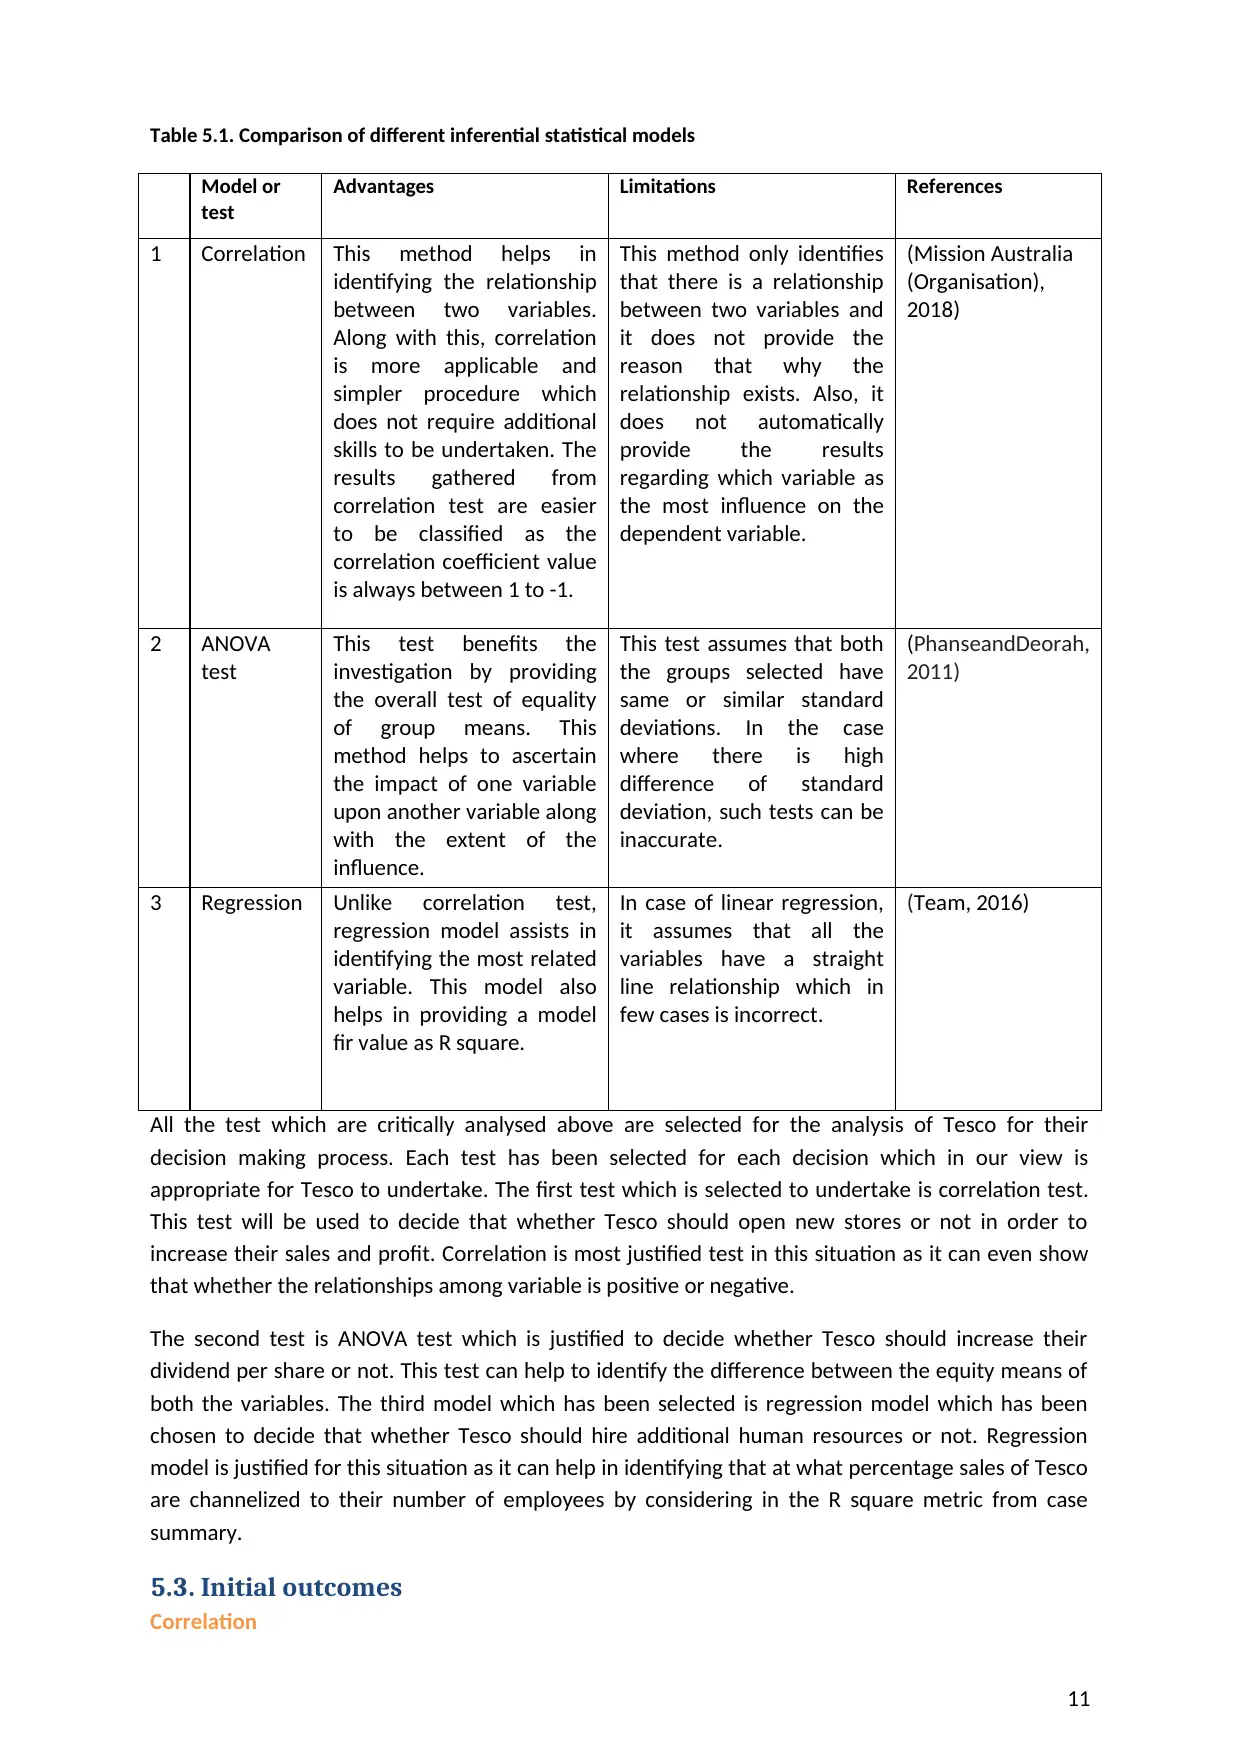
Table 5.1. Comparison of different inferential statistical models
Model or
test
Advantages Limitations References
1 Correlation This method helps in
identifying the relationship
between two variables.
Along with this, correlation
is more applicable and
simpler procedure which
does not require additional
skills to be undertaken. The
results gathered from
correlation test are easier
to be classified as the
correlation coefficient value
is always between 1 to -1.
This method only identifies
that there is a relationship
between two variables and
it does not provide the
reason that why the
relationship exists. Also, it
does not automatically
provide the results
regarding which variable as
the most influence on the
dependent variable.
(Mission Australia
(Organisation),
2018)
2 ANOVA
test
This test benefits the
investigation by providing
the overall test of equality
of group means. This
method helps to ascertain
the impact of one variable
upon another variable along
with the extent of the
influence.
This test assumes that both
the groups selected have
same or similar standard
deviations. In the case
where there is high
difference of standard
deviation, such tests can be
inaccurate.
(PhanseandDeorah,
2011)
3 Regression Unlike correlation test,
regression model assists in
identifying the most related
variable. This model also
helps in providing a model
fir value as R square.
In case of linear regression,
it assumes that all the
variables have a straight
line relationship which in
few cases is incorrect.
(Team, 2016)
All the test which are critically analysed above are selected for the analysis of Tesco for their
decision making process. Each test has been selected for each decision which in our view is
appropriate for Tesco to undertake. The first test which is selected to undertake is correlation test.
This test will be used to decide that whether Tesco should open new stores or not in order to
increase their sales and profit. Correlation is most justified test in this situation as it can even show
that whether the relationships among variable is positive or negative.
The second test is ANOVA test which is justified to decide whether Tesco should increase their
dividend per share or not. This test can help to identify the difference between the equity means of
both the variables. The third model which has been selected is regression model which has been
chosen to decide that whether Tesco should hire additional human resources or not. Regression
model is justified for this situation as it can help in identifying that at what percentage sales of Tesco
are channelized to their number of employees by considering in the R square metric from case
summary.
5.3. Initial outcomes
Correlation
11
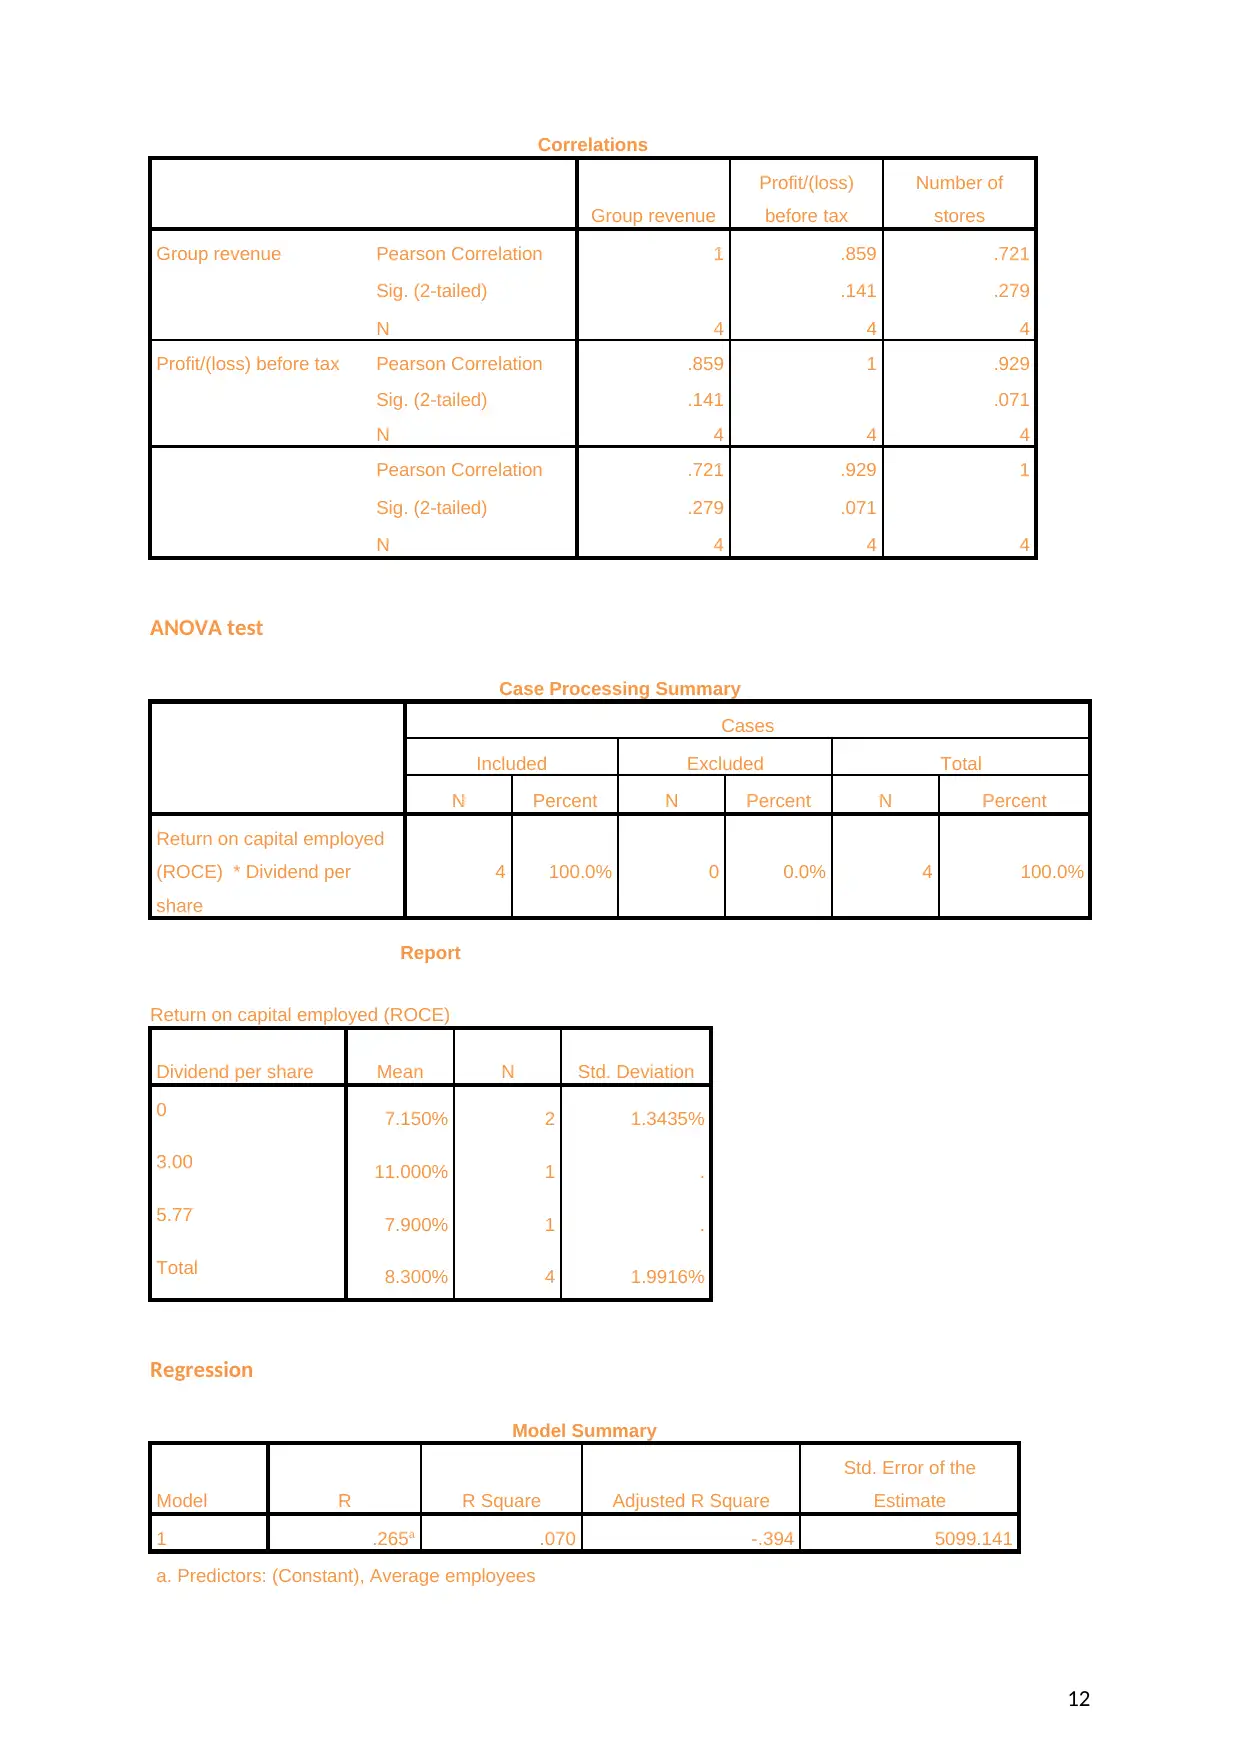
Correlations
Group revenue
Profit/(loss)
before tax
Number of
stores
Group revenue Pearson Correlation 1 .859 .721
Sig. (2-tailed) .141 .279
N 4 4 4
Profit/(loss) before tax Pearson Correlation .859 1 .929
Sig. (2-tailed) .141 .071
N 4 4 4
Pearson Correlation .721 .929 1
Sig. (2-tailed) .279 .071
N 4 4 4
ANOVA test
Case Processing Summary
Cases
Included Excluded Total
N Percent N Percent N Percent
Return on capital employed
(ROCE) * Dividend per
share
4 100.0% 0 0.0% 4 100.0%
Report
Return on capital employed (ROCE)
Dividend per share Mean N Std. Deviation
0 7.150% 2 1.3435%
3.00 11.000% 1 .
5.77 7.900% 1 .
Total 8.300% 4 1.9916%
Regression
Model Summary
Model R R Square Adjusted R Square
Std. Error of the
Estimate
1 .265a .070 -.394 5099.141
a. Predictors: (Constant), Average employees
12
⊘ This is a preview!⊘
Do you want full access?
Subscribe today to unlock all pages.
Trusted by 1+ million students worldwide
1 out of 19
Related Documents


Your All-in-One AI-Powered Toolkit for Academic Success.
+13062052269
info@desklib.com
Available 24*7 on WhatsApp / Email
![[object Object]](/_next/static/media/star-bottom.7253800d.svg)
Unlock your academic potential
Copyright © 2020–2026 A2Z Services. All Rights Reserved. Developed and managed by ZUCOL.