Data Handling & Business Intelligence: Excel and SPSS Analysis
VerifiedAdded on 2023/06/18
|19
|3196
|406
Report
AI Summary
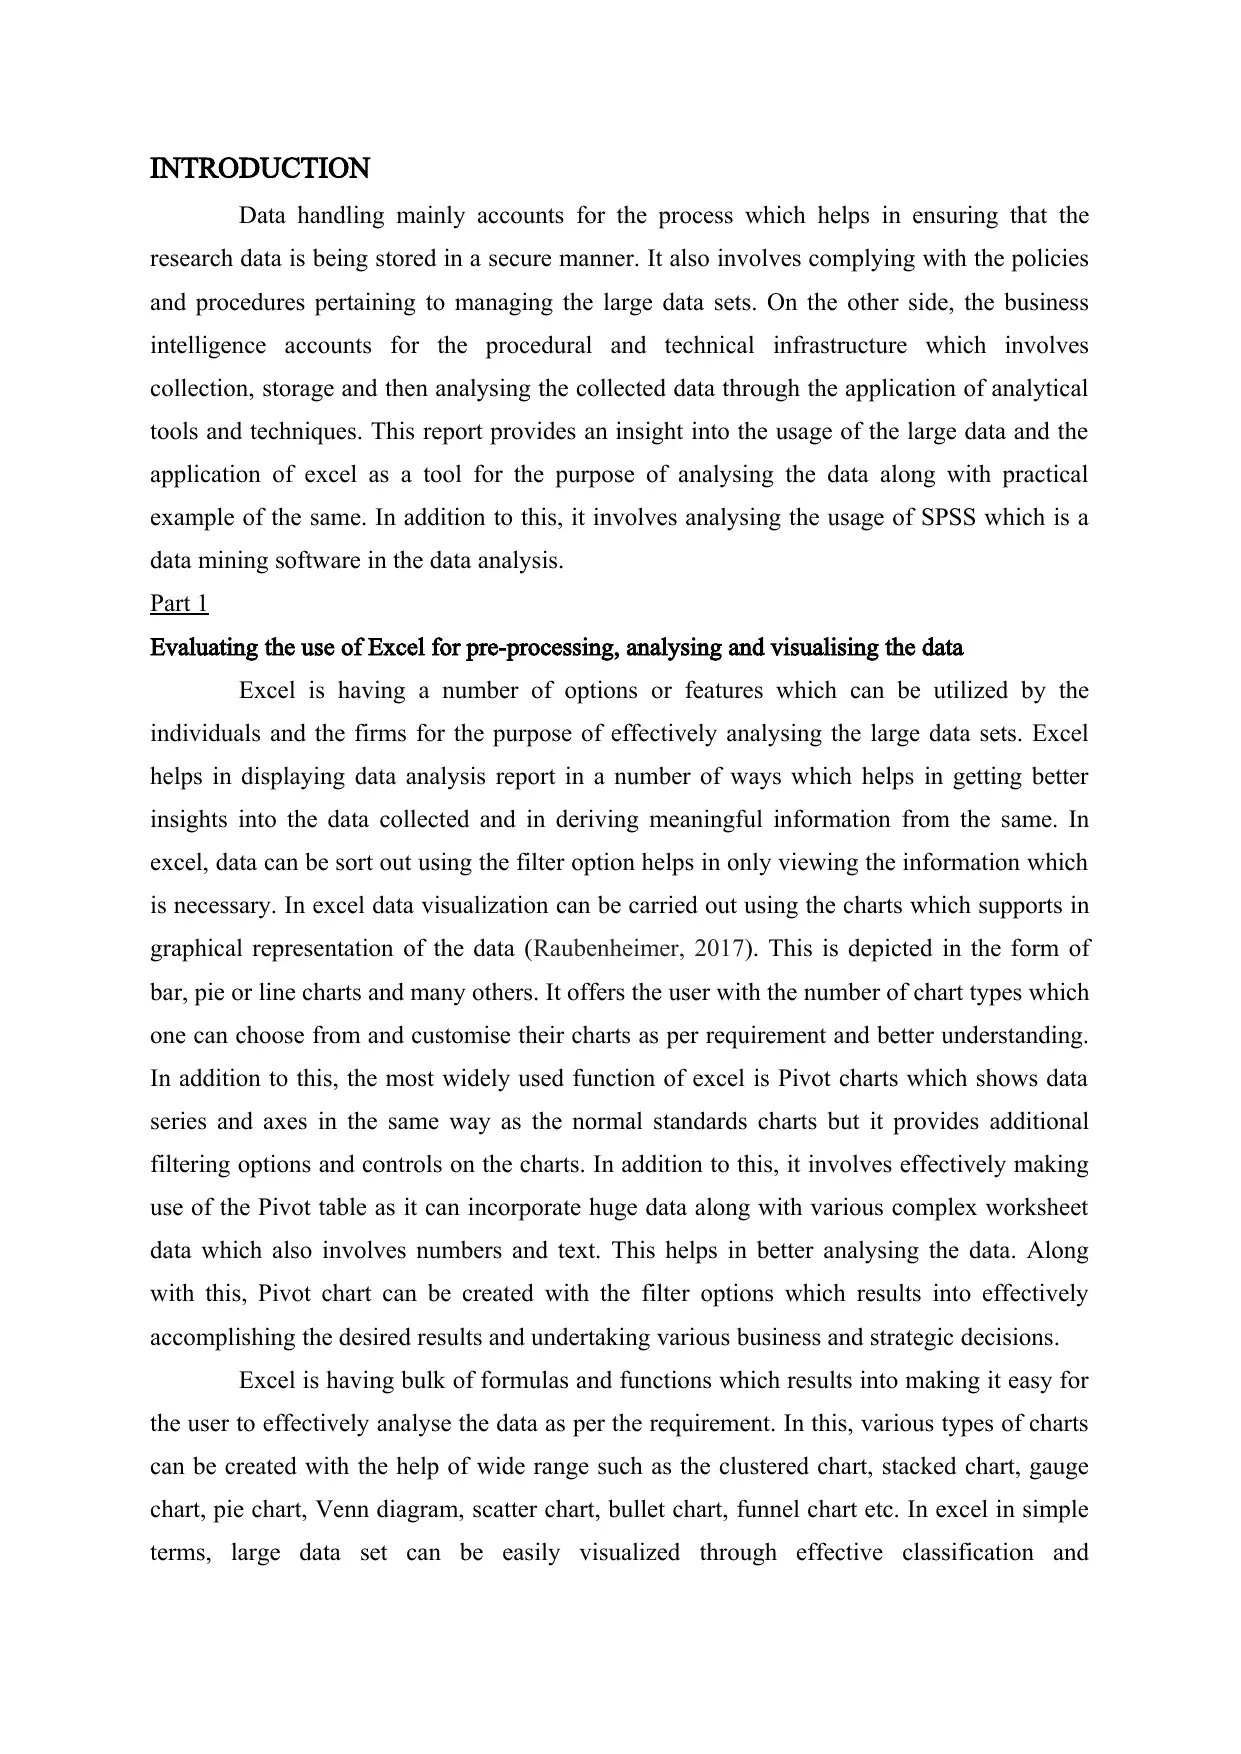
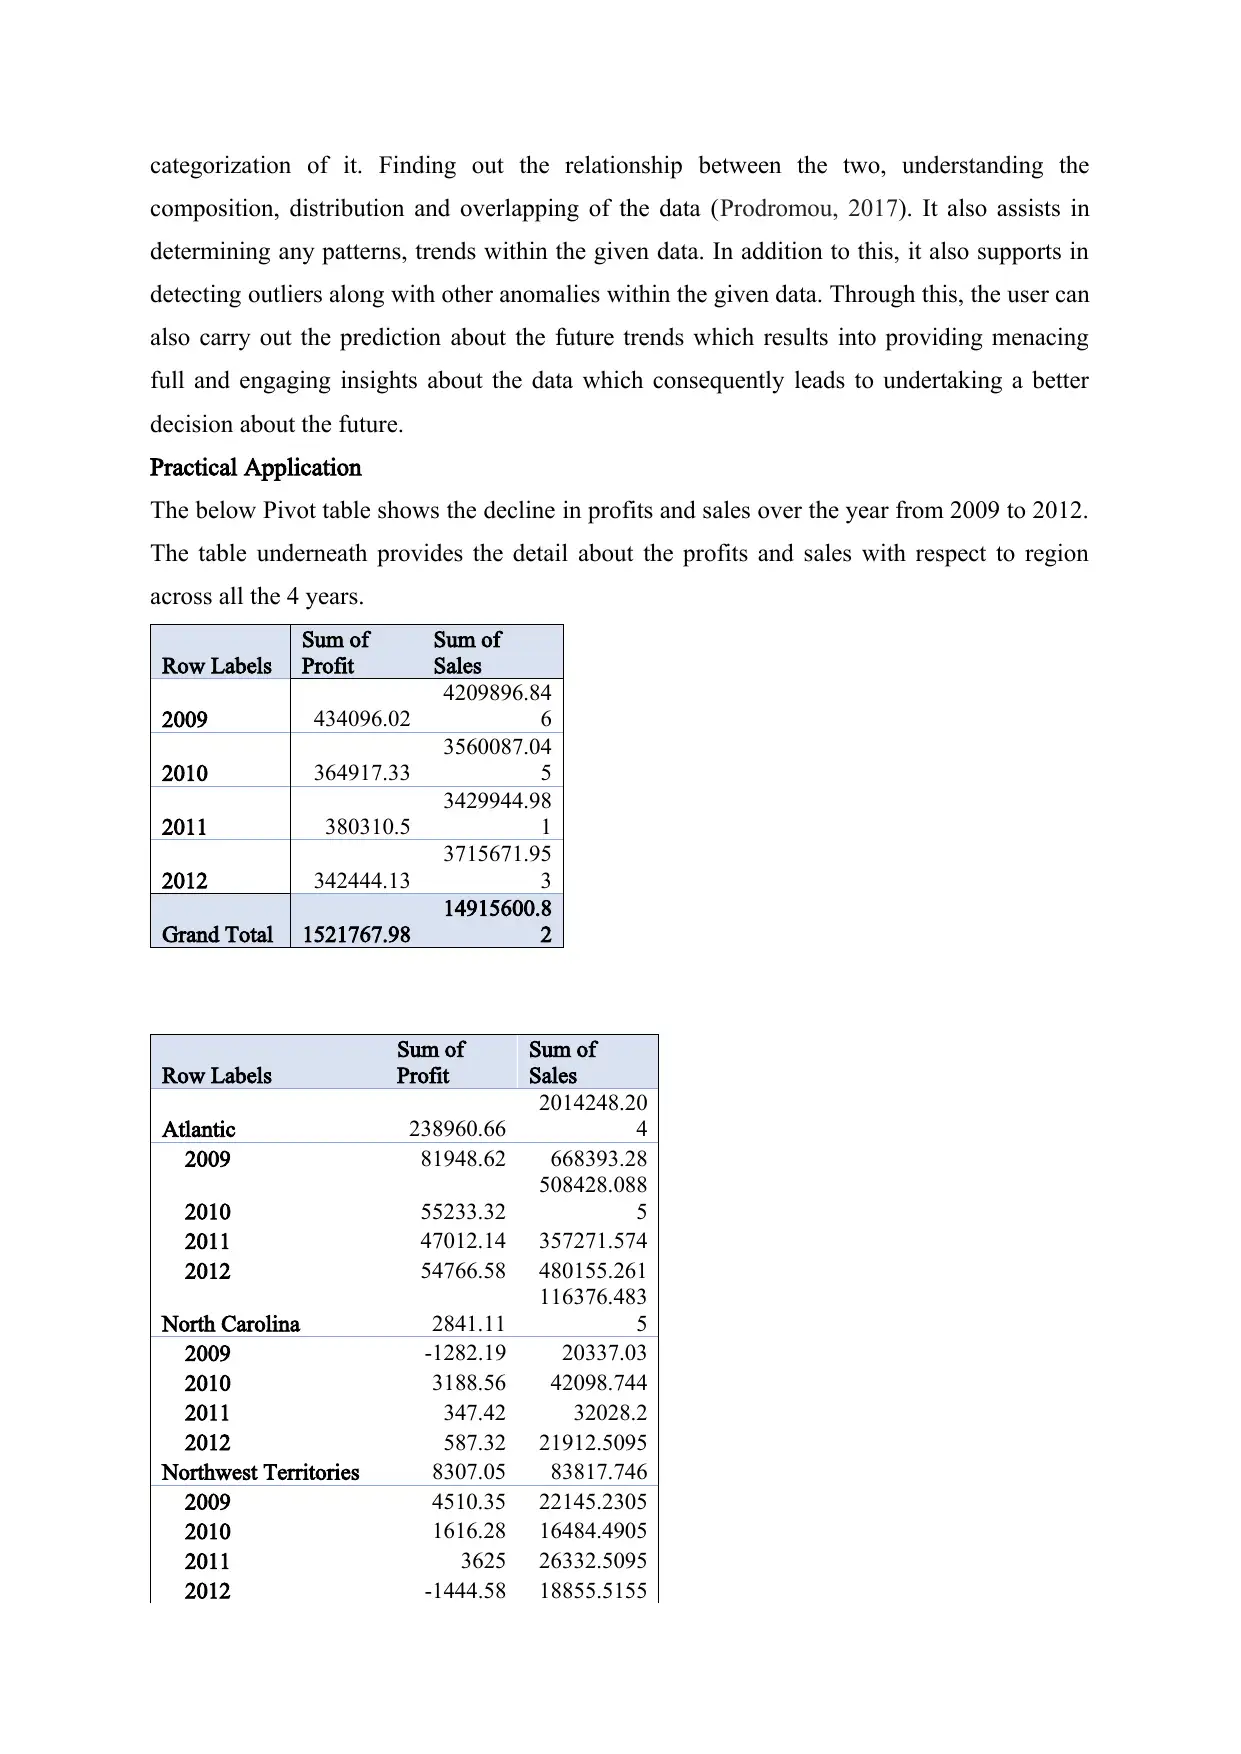
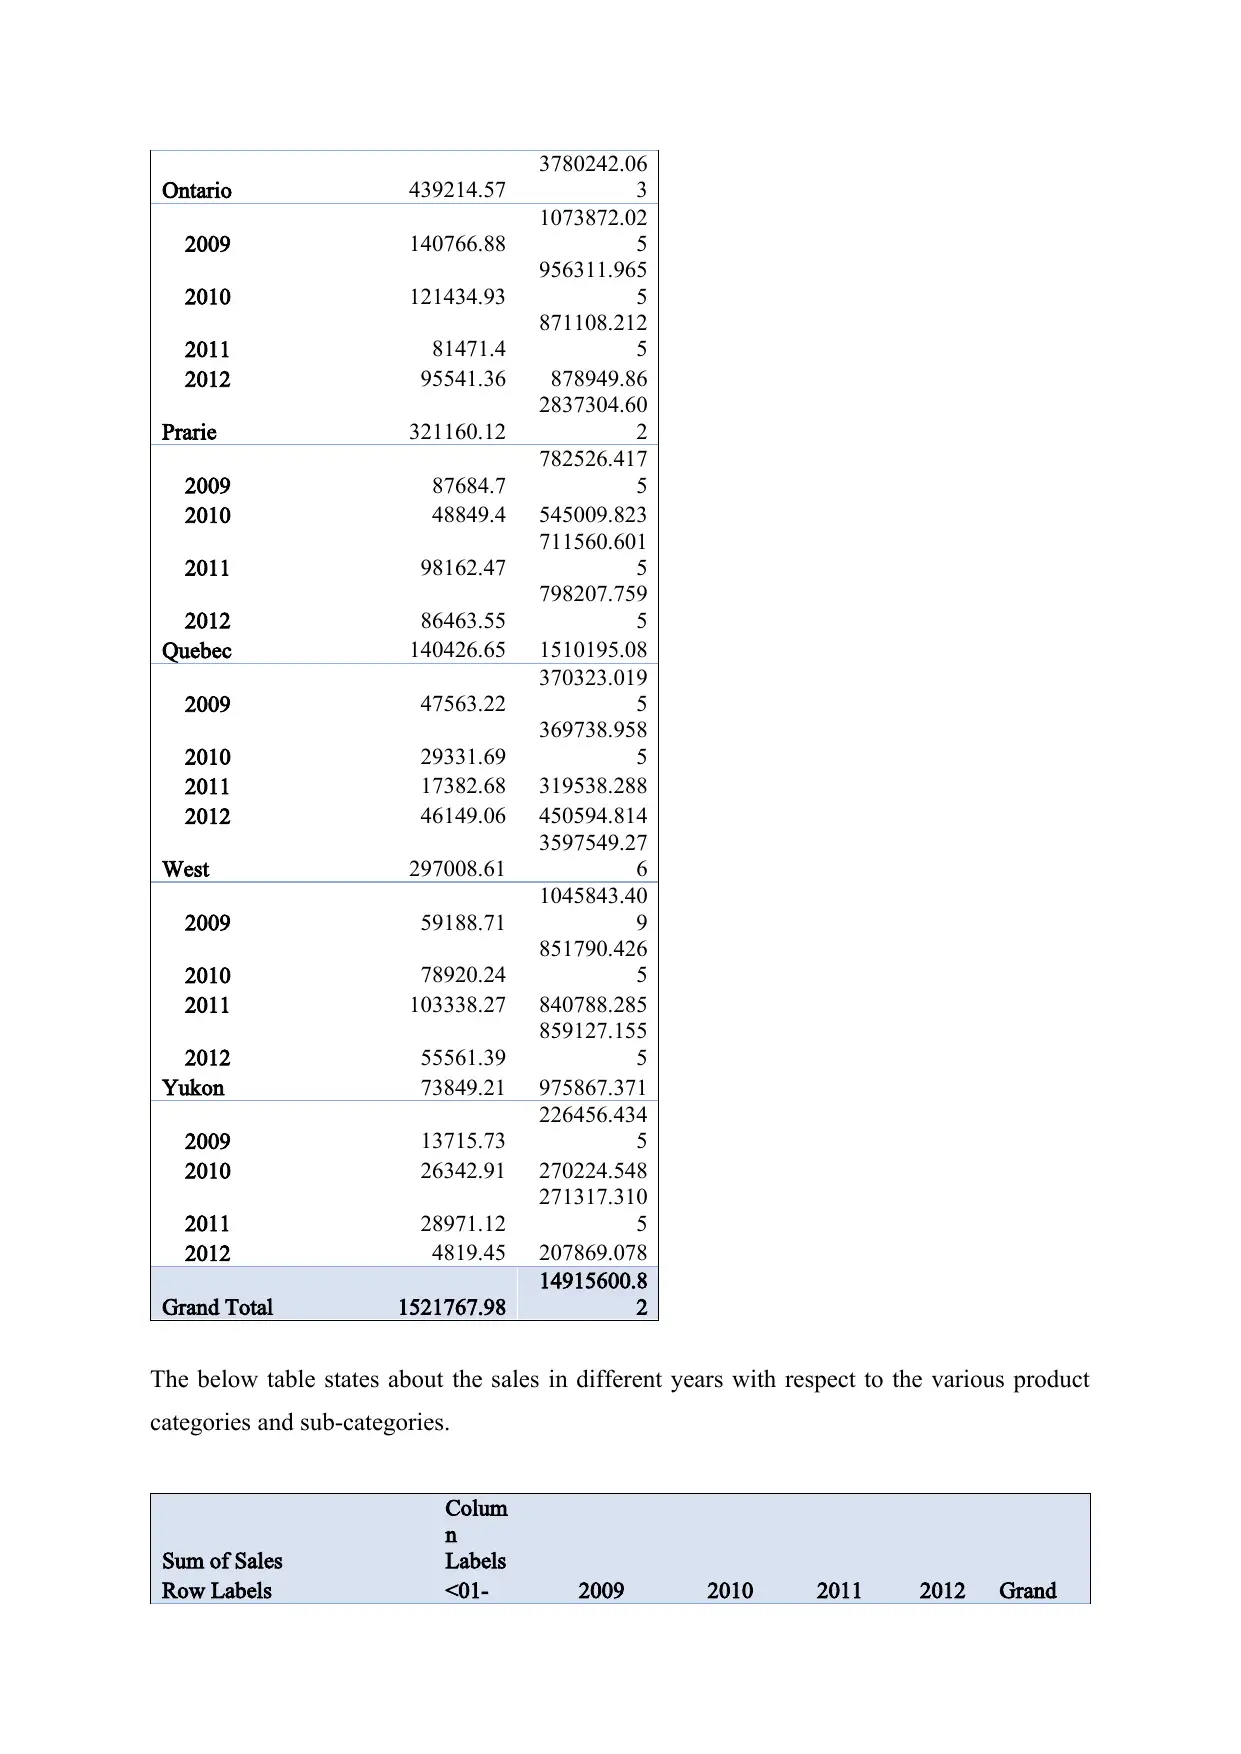
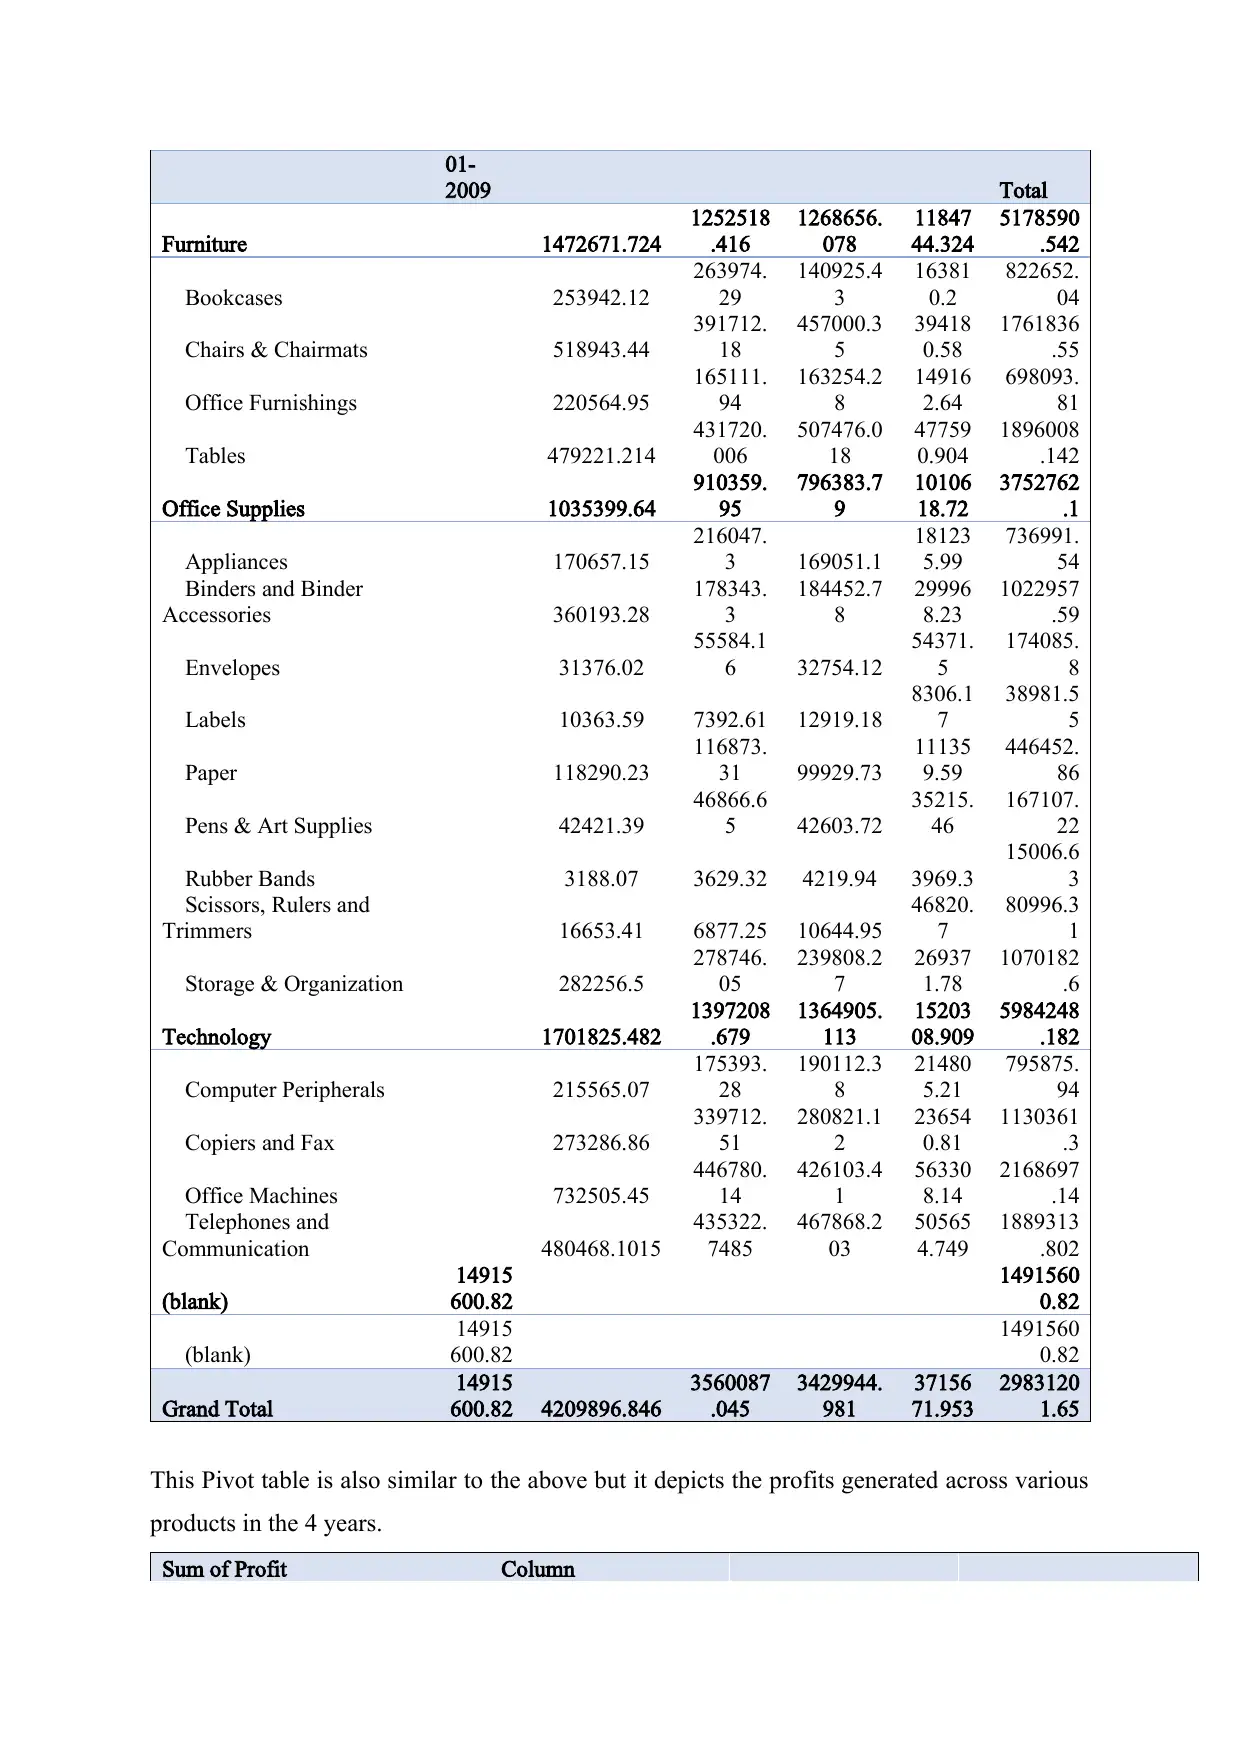
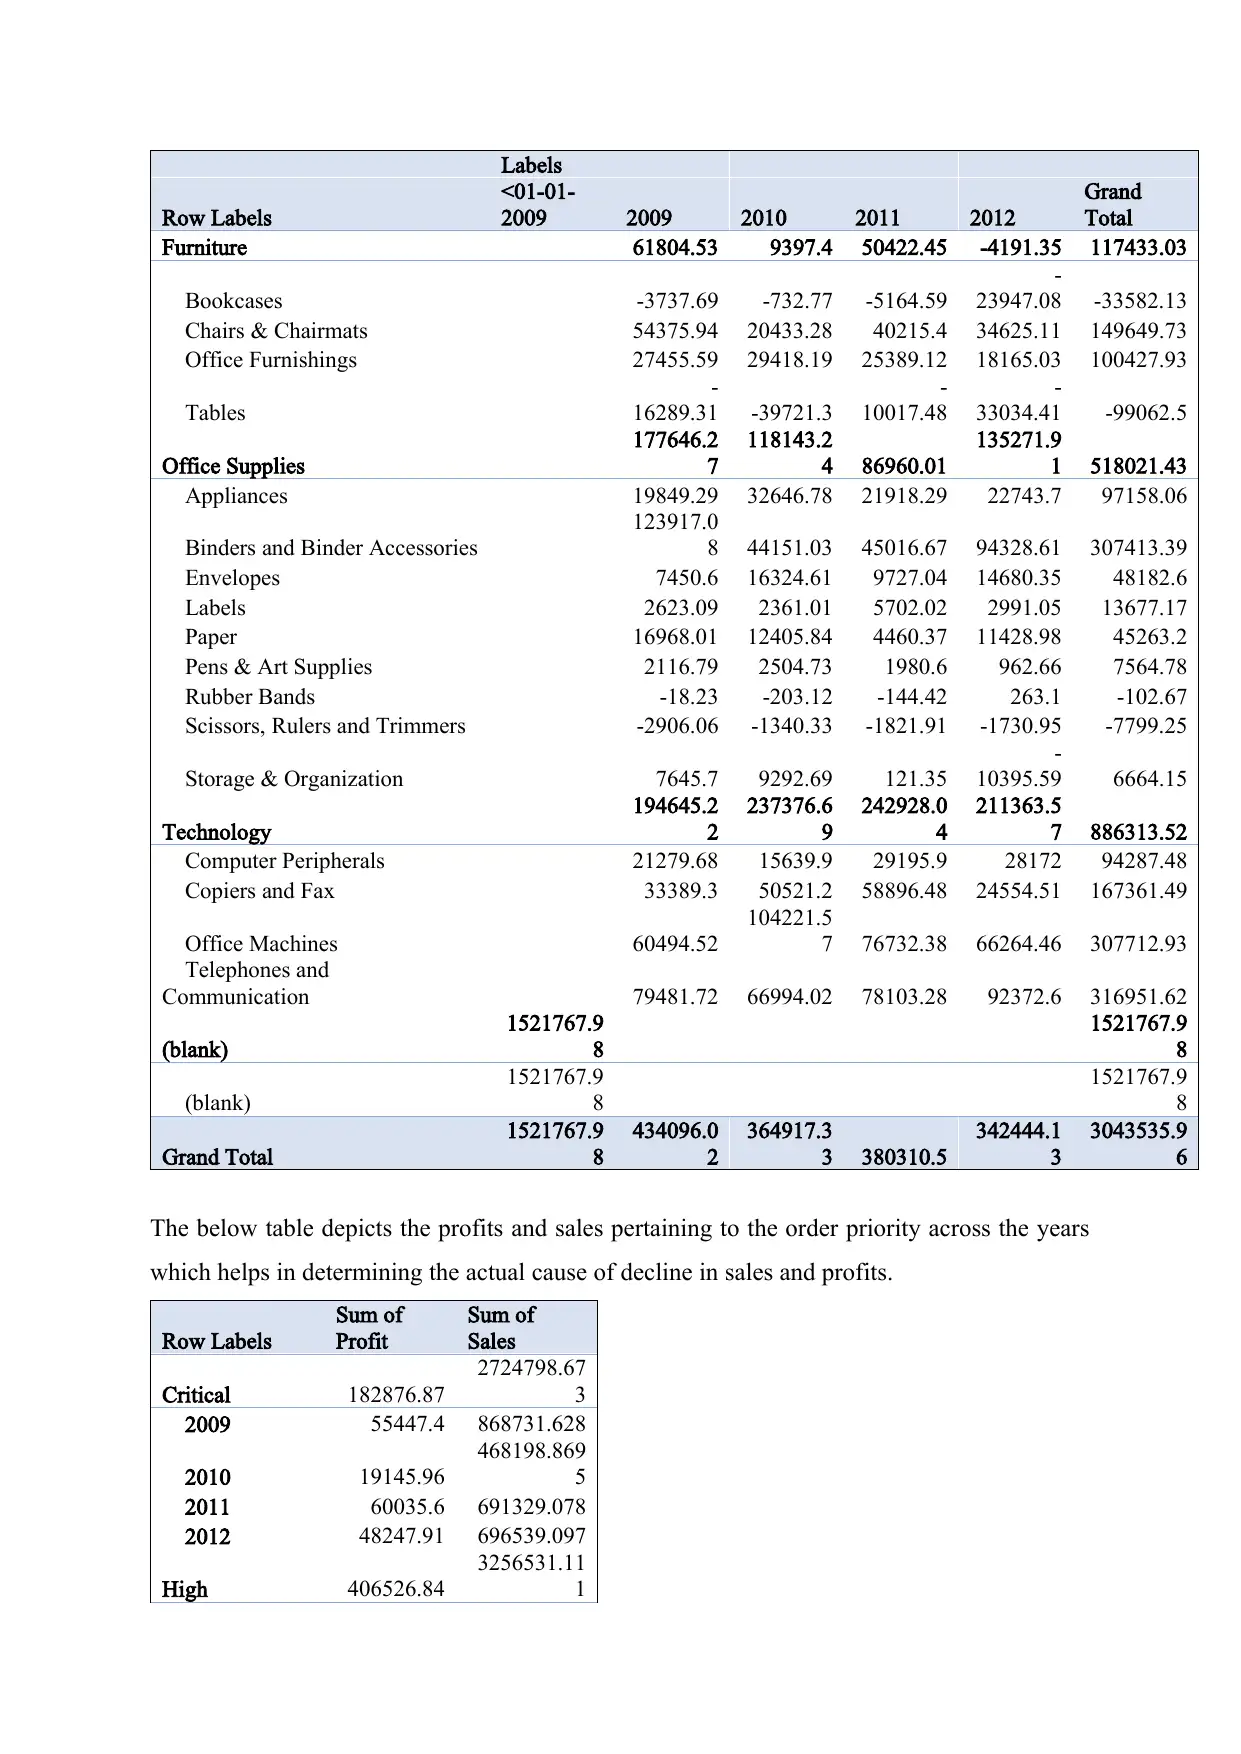
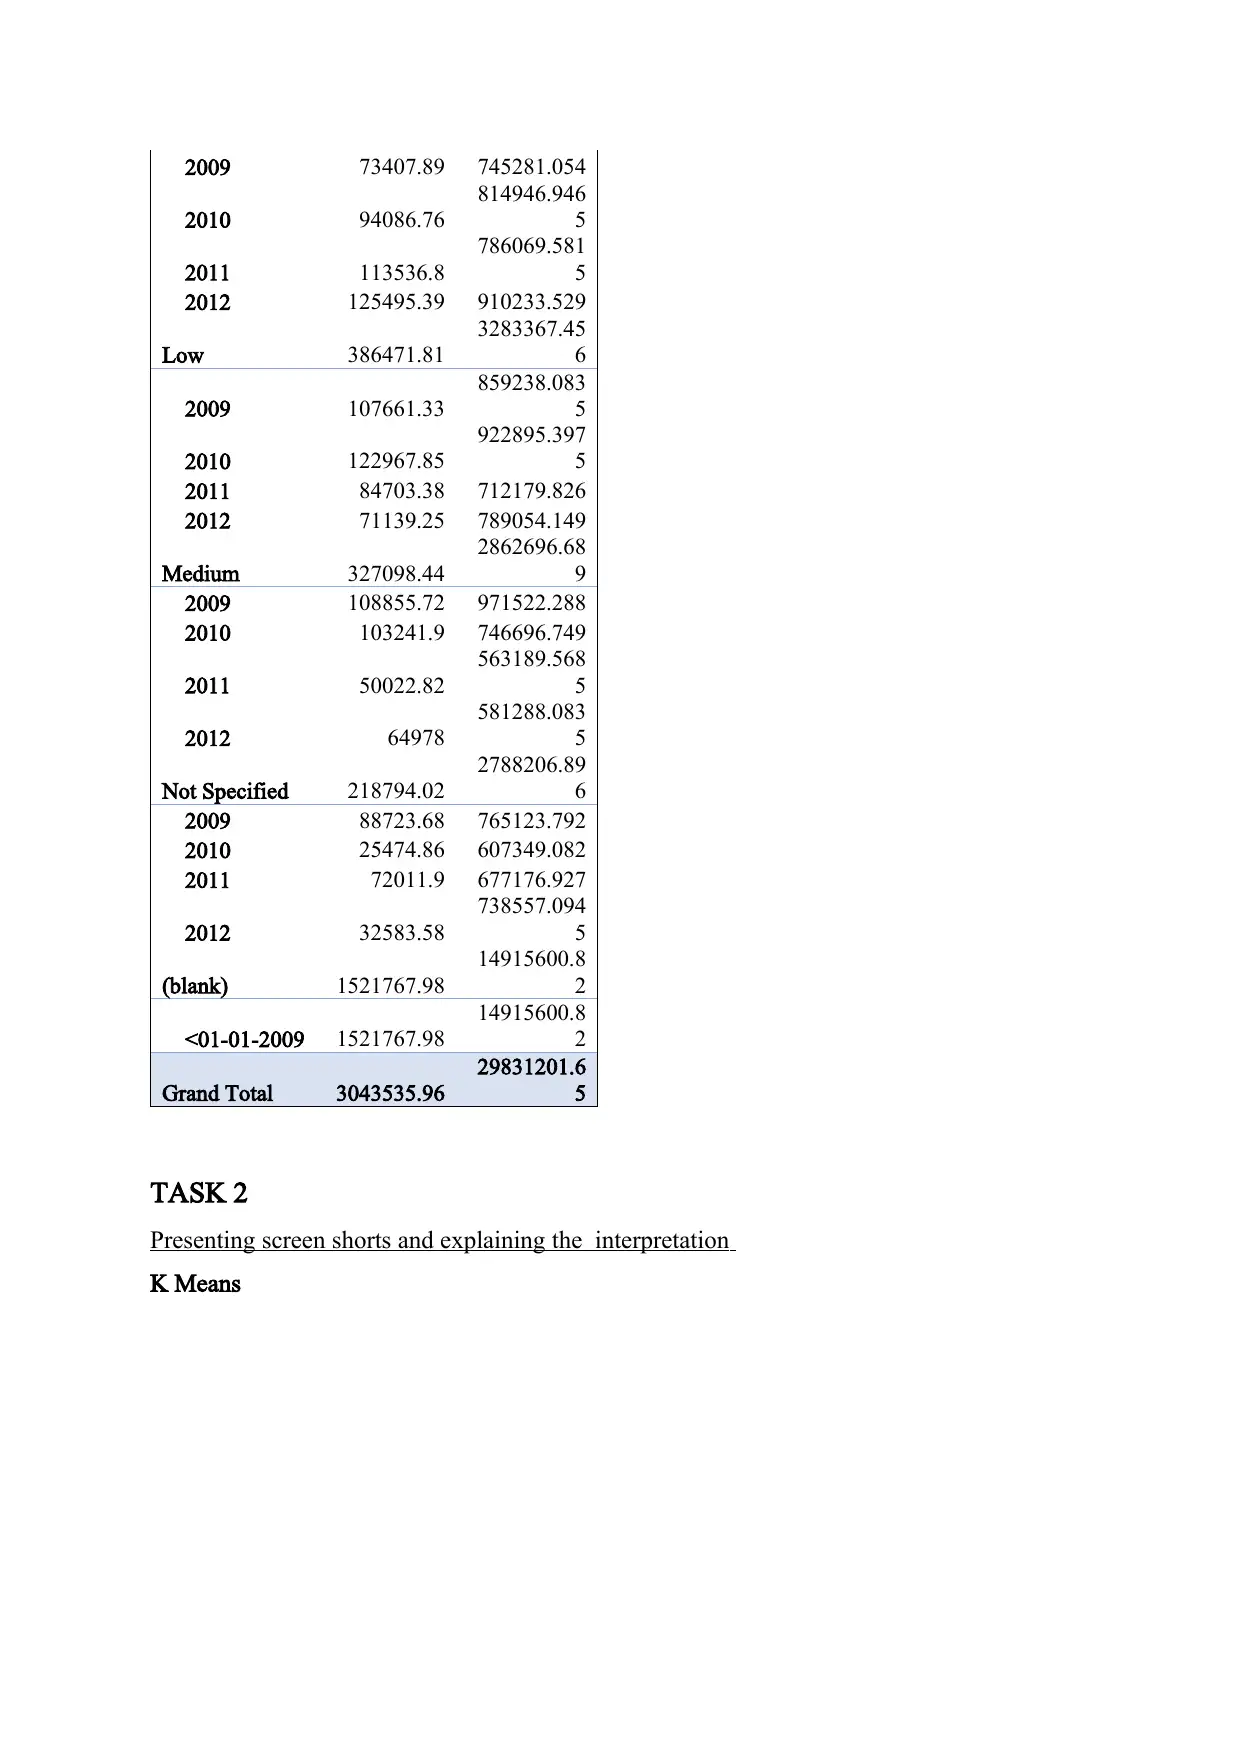
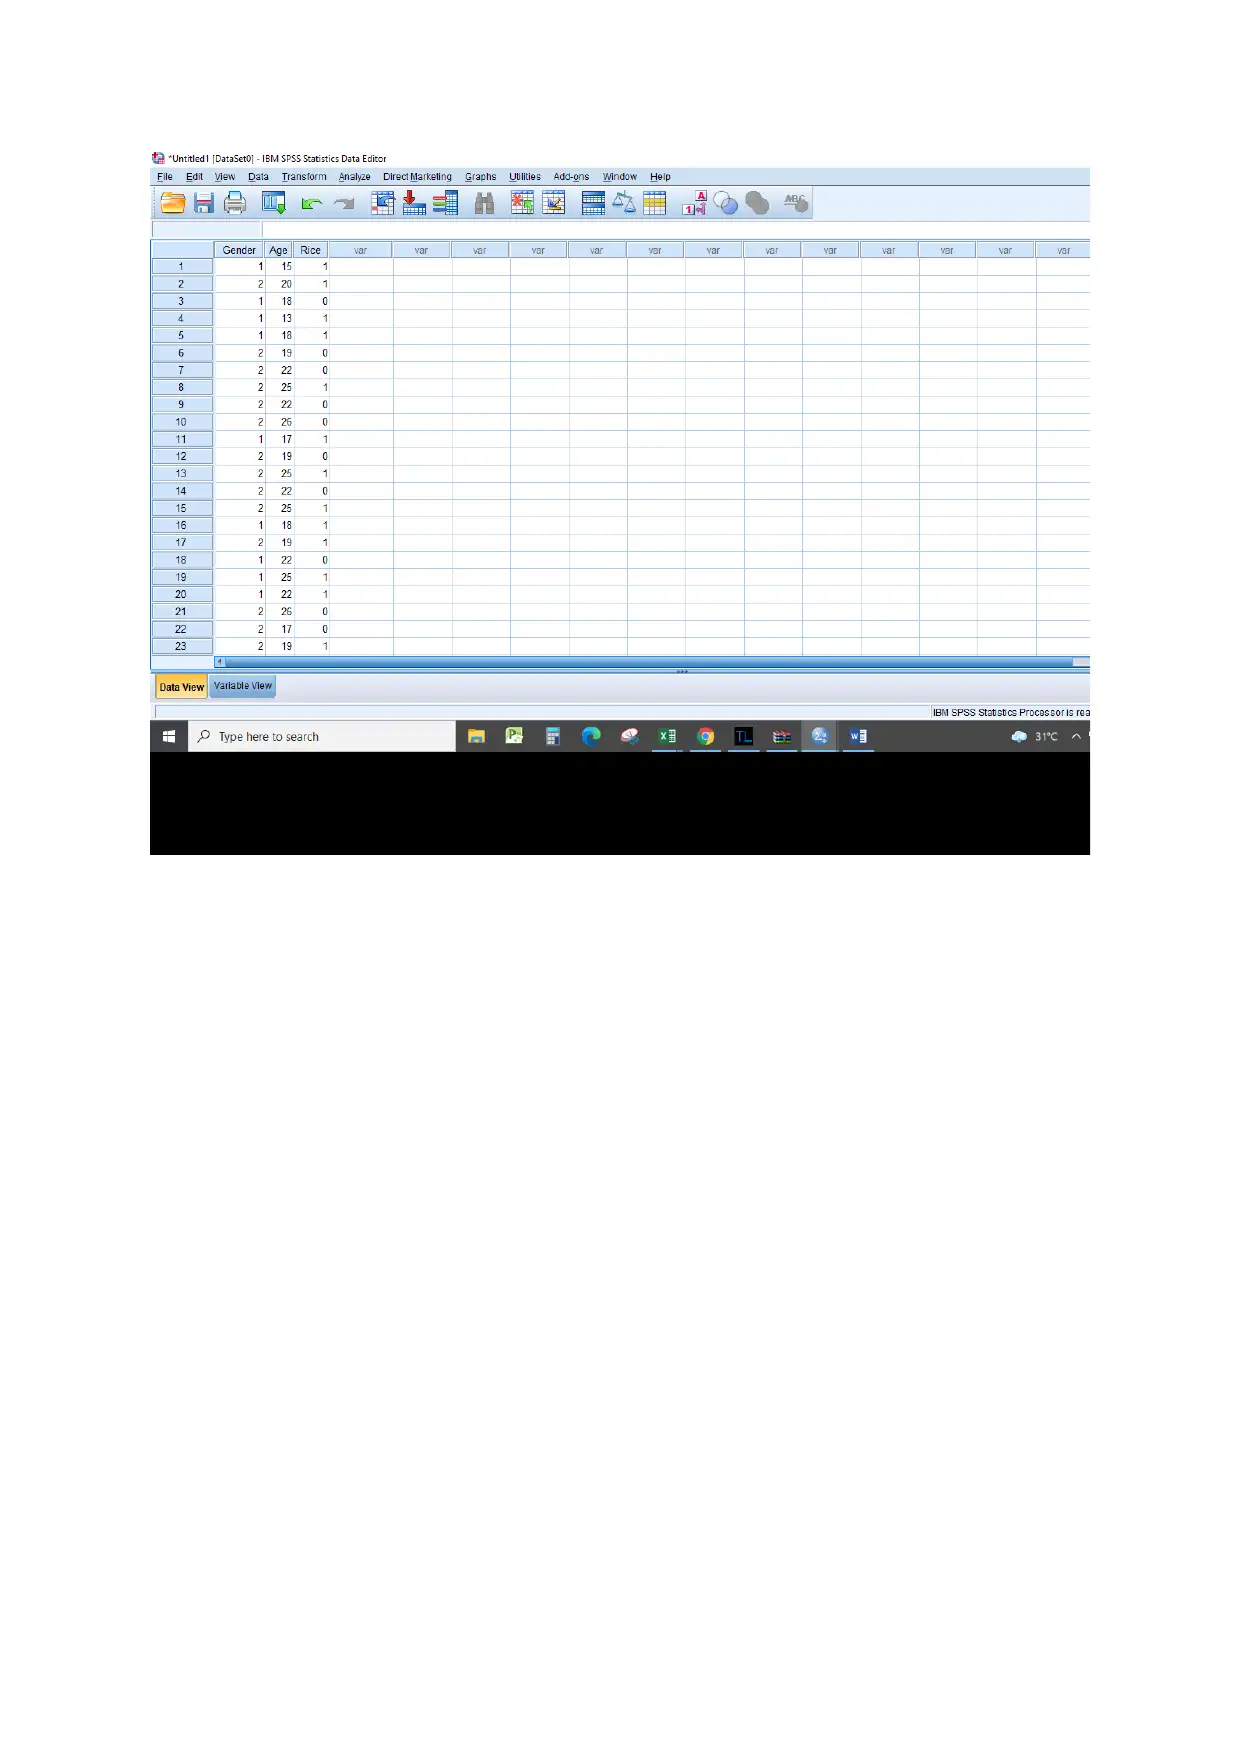
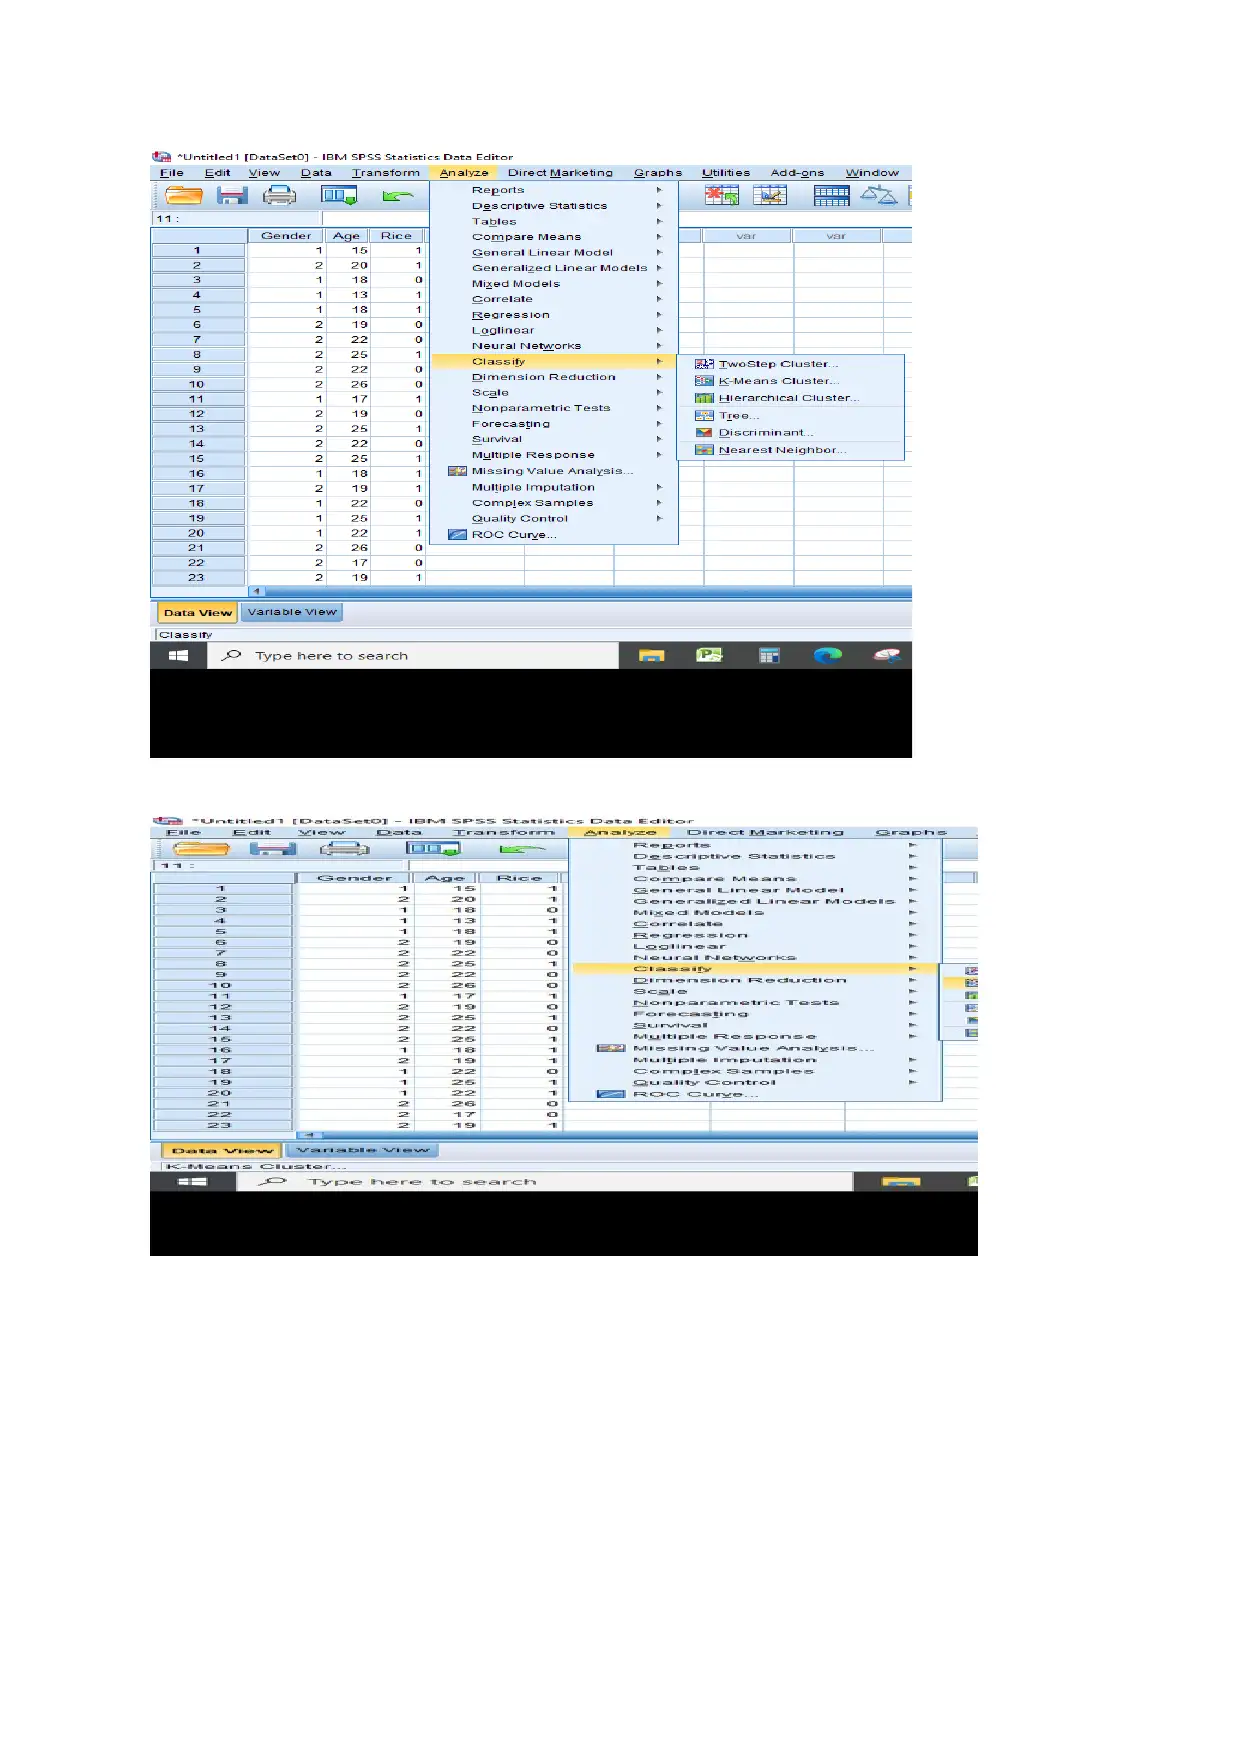
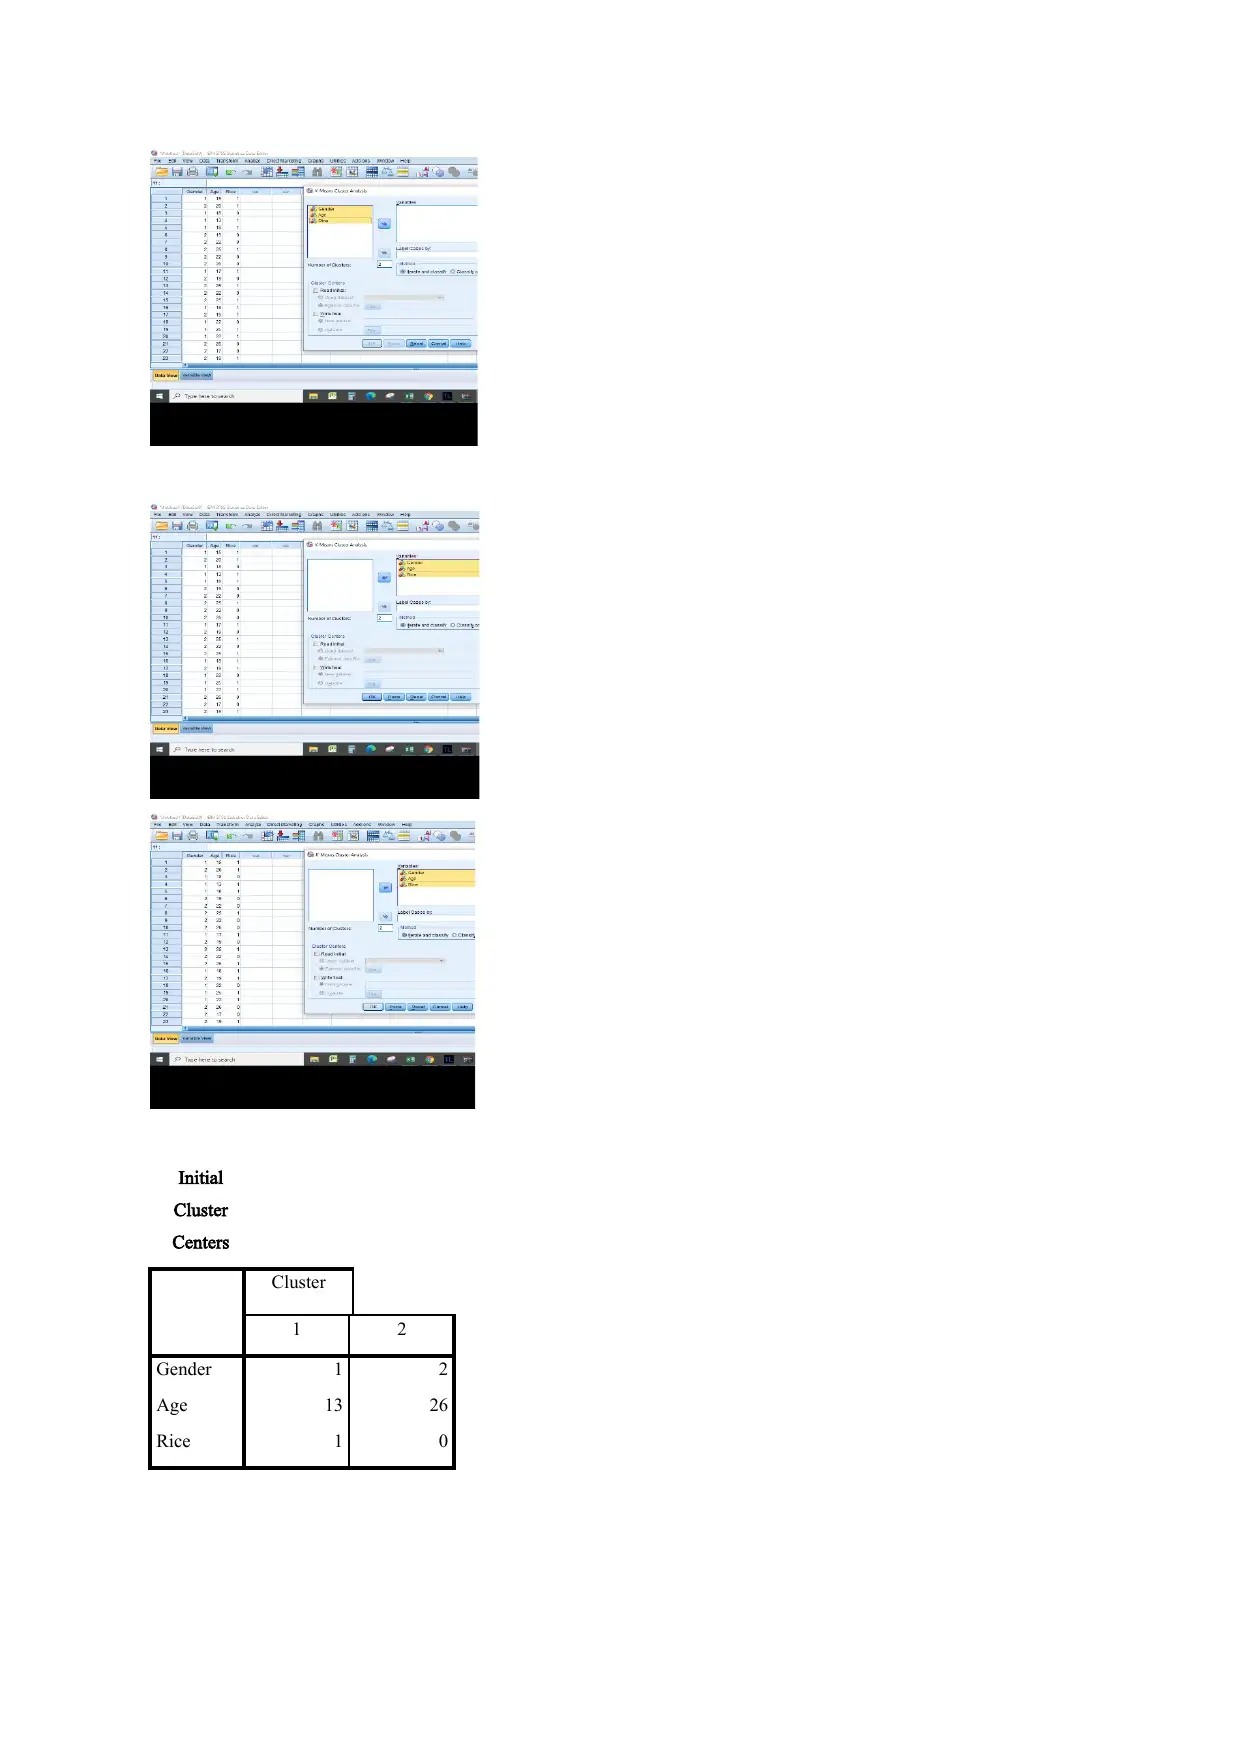
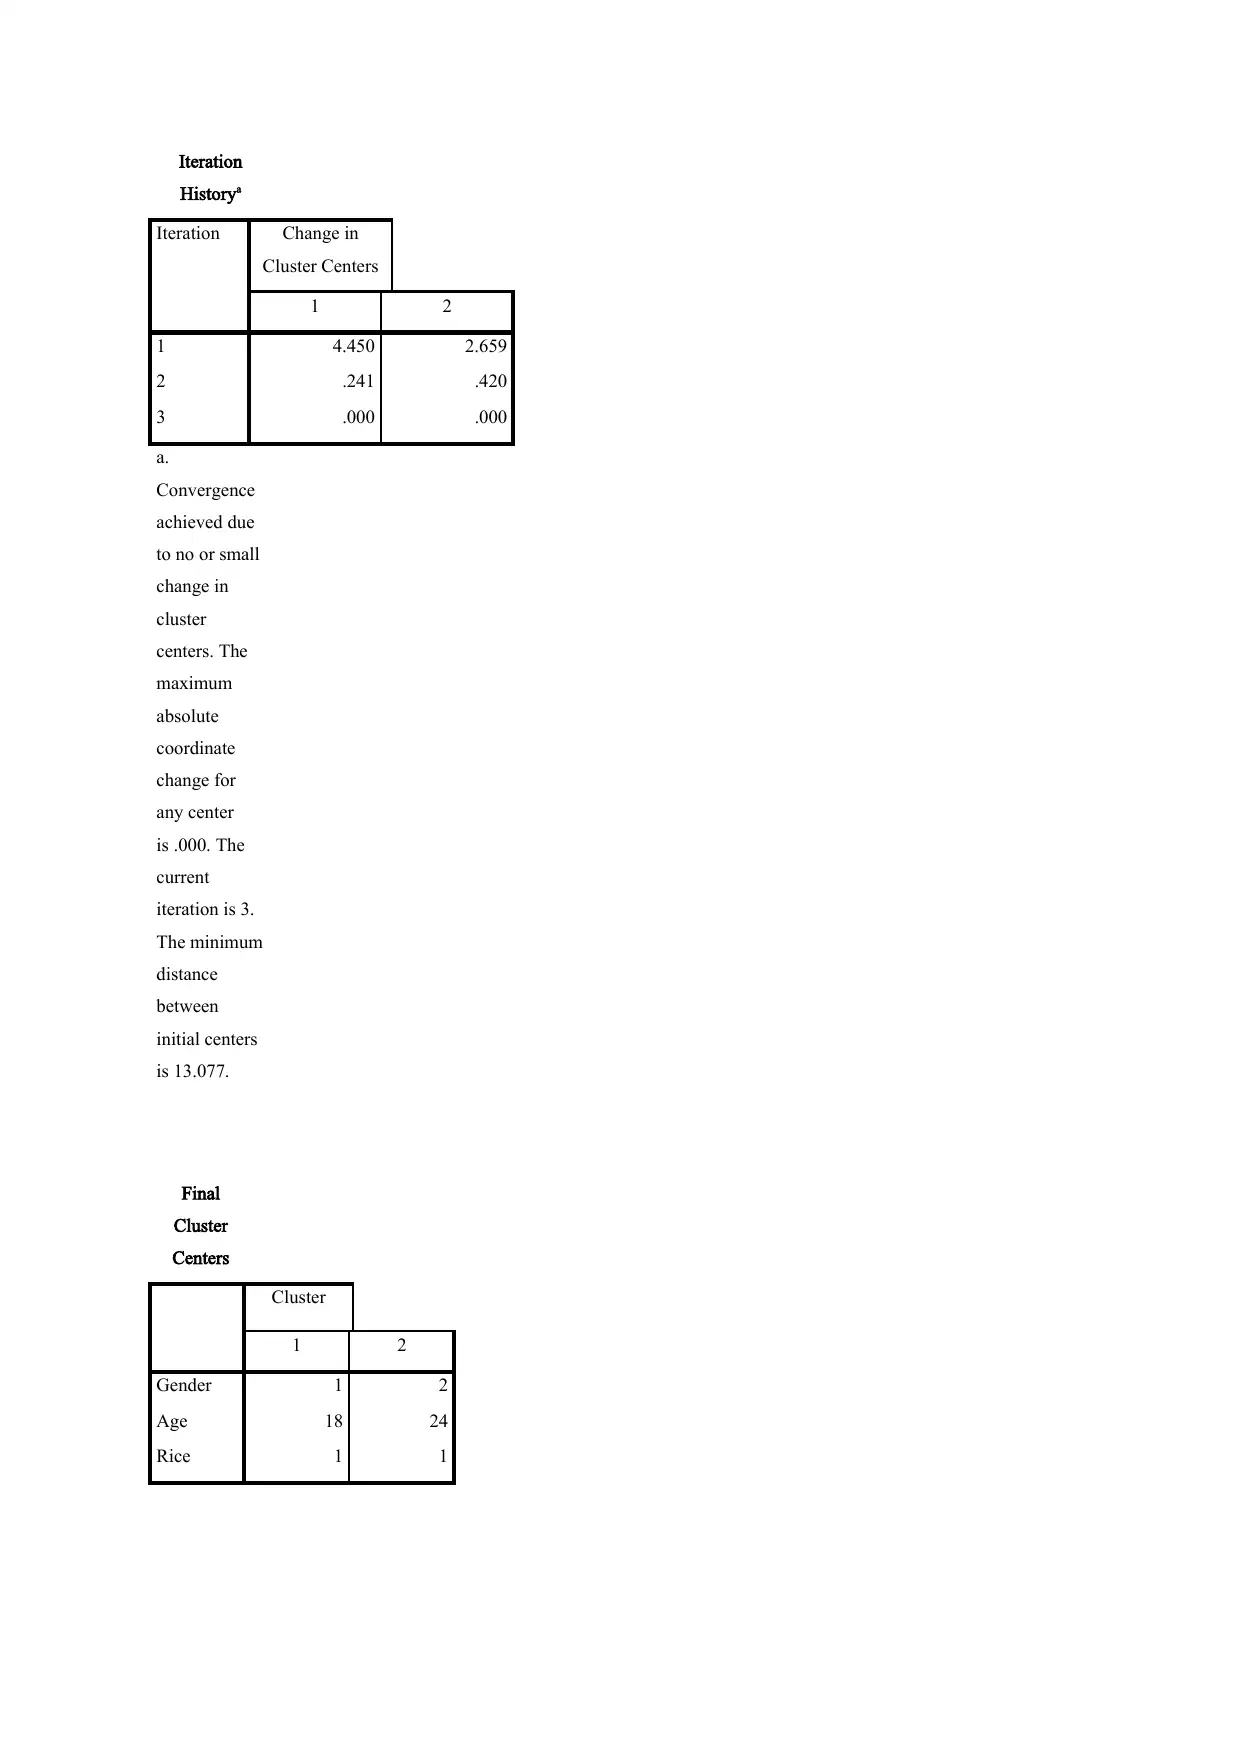
This report provides an overview of data handling and business intelligence, focusing on the application of Excel and SPSS for data analysis. It evaluates Excel's capabilities for preprocessing, analyzing, and visualizing data, including the use of pivot tables and various chart types to derive meaningful insights. A practical application demonstrates declining profits and sales from 2009 to 2012, analyzed by region and product category. The report also presents a cluster analysis using SPSS, interpreting the results related to gender, age, and rice consumption. Furthermore, it explains various data mining methods, such as association, classification, decision trees, and cluster analysis, highlighting their applications in business. Finally, the report discusses the advantages and disadvantages of using SPSS over Excel for data analysis, concluding with a summary of the key findings and their implications for business decision-making.
1 out of 19
Related Documents


Your All-in-One AI-Powered Toolkit for Academic Success.
+13062052269
info@desklib.com
Available 24*7 on WhatsApp / Email
![[object Object]](/_next/static/media/star-bottom.7253800d.svg)
Copyright © 2020–2026 A2Z Services. All Rights Reserved. Developed and managed by ZUCOL.