LCBB5000 Data Handling and Business Intelligence: Excel vs SPSS
VerifiedAdded on 2023/06/18
|17
|3223
|274
Report
AI Summary
This report assesses the use of Excel for data pre-processing, analysis, and visualization, highlighting its features like number functions, pivot tables, and charting tools. It evaluates Excel's ability to transform raw data into understandable formats and conduct statistical analysis. The report also includes a practical application of pivot tables for analyzing sales and profitability data for a superstore, interpreting trends and identifying areas for improvement. Furthermore, it describes common data mining methods such as classification, clustering, and association rules. Finally, the report compares the advantages and disadvantages of using SPSS versus Excel for data analysis, considering factors like statistical capabilities, data handling capacity, and ease of use. The document is available on Desklib, a platform offering study tools and resources for students.

DATA HANDLING AND
BUSINESS INTELLIGENCE
1
BUSINESS INTELLIGENCE
1
Paraphrase This Document
Need a fresh take? Get an instant paraphrase of this document with our AI Paraphraser
TABLE OF CONTENTS
TABLE OF CONTENTS................................................................................................................2
PART A...........................................................................................................................................3
Evaluate the use of Excel for pre-processing the data, analysing the data and visualising the
data...............................................................................................................................................3
PART 2............................................................................................................................................7
2.1................................................................................................................................................7
2.2 Describing the most common data mining methods............................................................13
2.3..............................................................................................................................................14
Advantages and disadvantages of SPSS over Excel..................................................................14
REFERENCES..............................................................................................................................17
2
PART A
Evaluate the use of Excel for pre-processing the data, analysing the data and visualising the data
Excel is utilized for various purposes in turn ability to accomplish the objectives can
become successful. Data processing is the procedure which is concerned with converting the raw
information is understandable manner. The reason behind it is to get the ability to have analyse
data in order to formulate appropriate decision. There are several features available in excel that
provides assistance in exerting data mining, analysing and decision making procedure efficient.
Use of excel in data processing become possible due to presence of different kind of
features such as is number, find, mid, if error, if, trim, count blank, etc. These widely contribute
in achieving ability identify the relevant pattern, lacking areas so that strategic decision can be
formulated (Irafahmi and Williams, 2021). Data analysis is concerned with evaluating each
segment of provided data to have sufficient & reliable kind of information for gaining accuracy.
Spreadsheet is great tool for fitting solutions as it emphasizes on extracting actionable insights.
This allows to get the various advantages to establish relationship so that relevant pattern can be
identified. It organizes the raw data into readable format that permits the user to customize field
and functions for gaining proper visualization. Full scale data product can be built by applying
any of the suitable function into cells which allows to obtain proper format that can be visualized
by using different displaying tools like charts, etc. in order to match the changing requirement
of customers excel pay attention on upgrading its features which is highly beneficial for users.
Data analysis can be done by applying pivot table tool available in excel which provides
assistance in making large statistical into desirable manner. Establishing relationship can be done
by users through taking data analytical tool pivot table, graph, harts, etc. These mentioned
course of action allows to convert the data in organized and analyzable structure so that relevant
interpretation can be done. In excel there is availability of features like sorting, conditioning
formatting, filter, what if analysis, solver, etc. that permits the company to convert data
according to requirement. Advance excel play crucial role in all functional areas of organization
which allows to get significant amount of efficiency and accuracy. Report formulation by
utilizing the specified manner of tactics available in excel which provides different kinds of
aspects that are essential in obtaining higher level of accuracy & efficiency in turn strategic
3
⊘ This is a preview!⊘
Do you want full access?
Subscribe today to unlock all pages.
Trusted by 1+ million students worldwide
decision can be taken. It is essential for the companies to draw conclusion regarding data via
utilizing advance analytical tool like excel for having ability to make proper strategic decision.
Excel is powerful and flexible tool used for analytical activity to get broad data
evaluation and visualization capabilities. For the purpose of presenting data graph, charts play
crucial role in reflecting complex and critical information in understandable manner. Making
comparison via setting relationship among two or more variables through graphical presenting
chart and bars can be exerted in effectual manner (Dunbar, 2020). From the evaluation it can be
articulated that company of any scale can use excel in order to make proper evaluation and
analysis of the projected data. In addition to this, it can be evaluated that companies in order to
make proper evaluation via conducting data analysis via taking the excel tool into practices.
These can give several different kinds of pros to organization which includes best way to store,
transform, clean, visualize, etc. which largely contribute in making appropriate decision. Data
analysis can be done by firm for making evaluation of market trends, competitors performance,
time consuming, proper integration, implication, streamlining, etc.
In excel there are several functions which can be used by companies to make proper
evaluation in turn higher productivity and profitability via considering the significant
components through identifying with help of available options. There are certain options in
excel that ensures accuracy and reliability which motivates the different kinds of users to utilize
this tool. These benefits can help in having capabilities of achieving the desire level of
information that can contribute in maximizing profitability & sales.
Pivot table can be sued by organization to have proper evaluation and analysis sales and
profit. It is widely sued by business analyst and other users to have proper ability to make
evaluation of vast static data to summarize, analyze and interpret in significant manner. It is one
of the systematic procedure that advanced features which enables user to get efficiency in
arranging data according to requirement (Harvey, 2018.). It includes few steps which can be
used to get guidance for making comparing of prevailing trends. The steps are as follows:
Click on the cells of table range and then go to insert option available in the ribbon of
excel in next to home tab.
In the next step pivot table option will be displayed which need to be selected in order to
obtain summarize data. For creating pivot table two questions will appear in form of
4
Paraphrase This Document
Need a fresh take? Get an instant paraphrase of this document with our AI Paraphraser
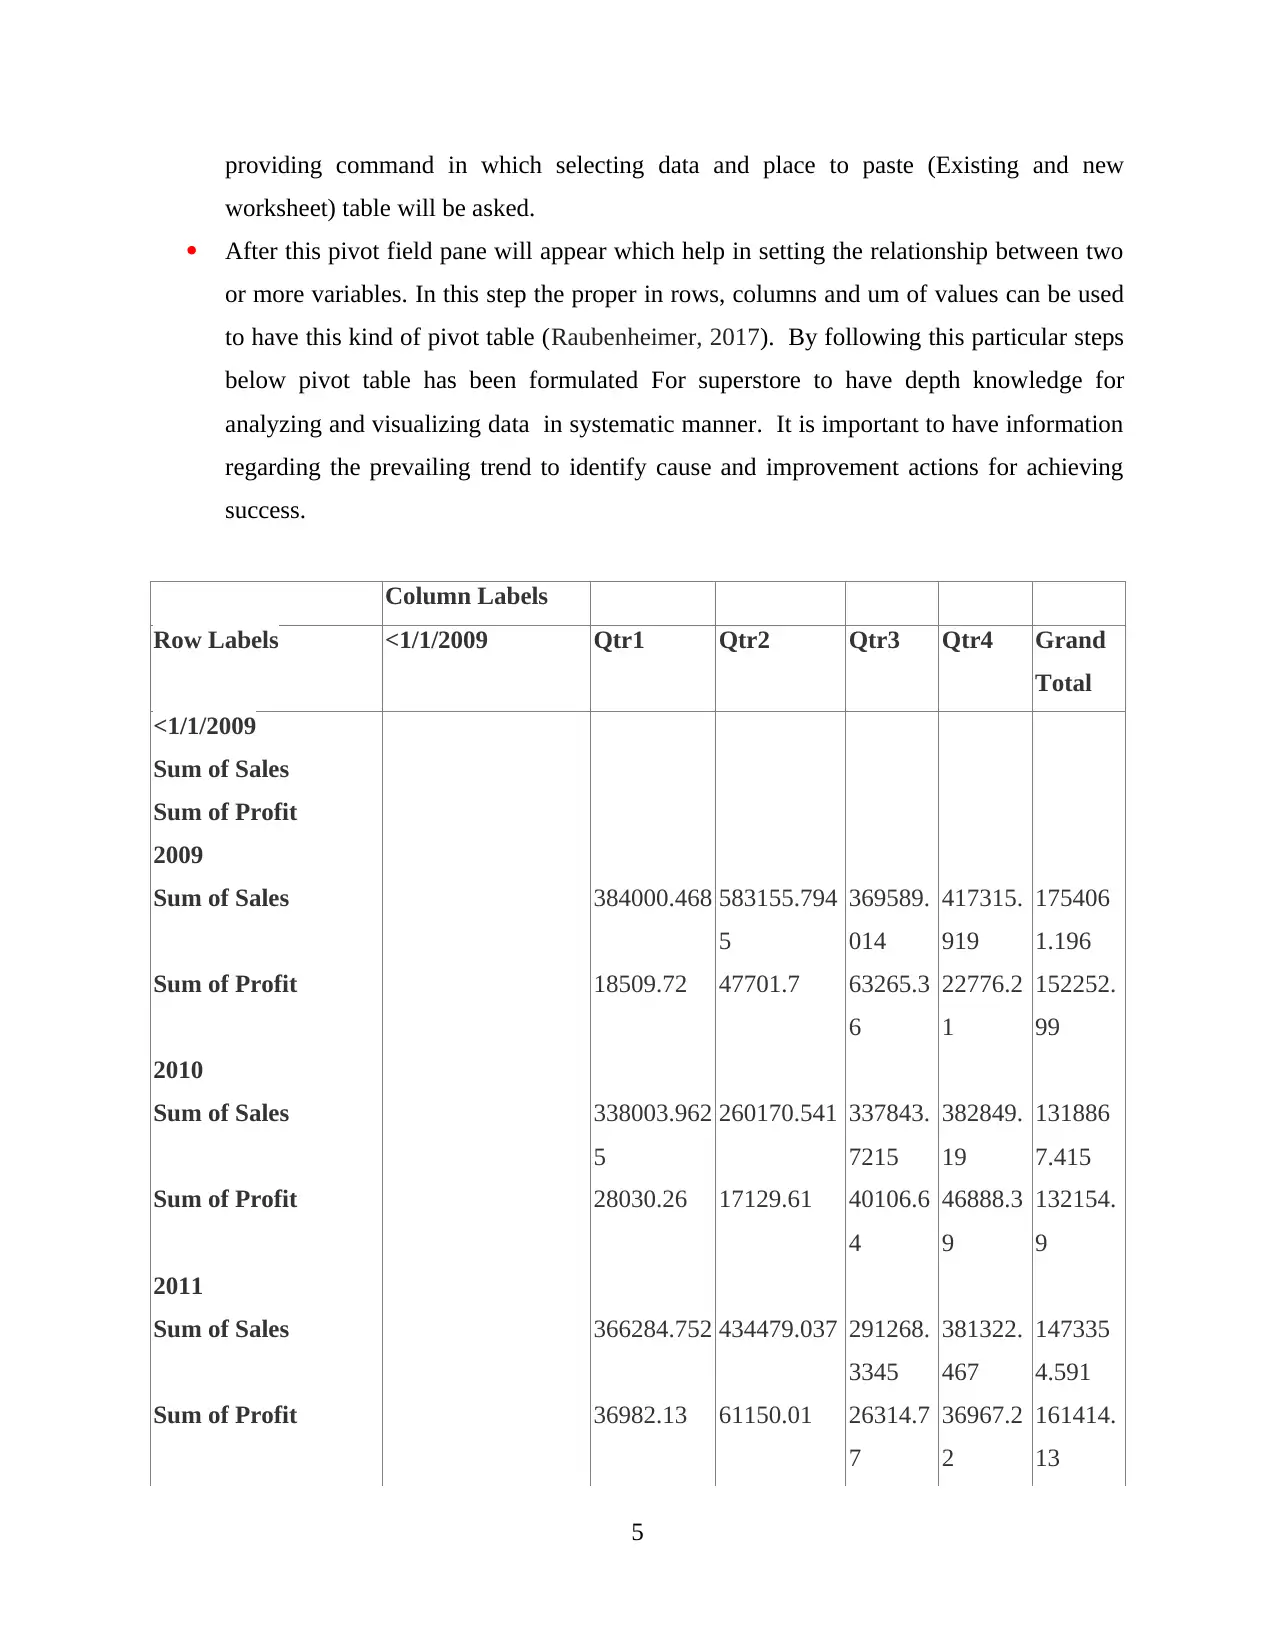
providing command in which selecting data and place to paste (Existing and new
worksheet) table will be asked.
After this pivot field pane will appear which help in setting the relationship between two
or more variables. In this step the proper in rows, columns and um of values can be used
to have this kind of pivot table (Raubenheimer, 2017). By following this particular steps
below pivot table has been formulated For superstore to have depth knowledge for
analyzing and visualizing data in systematic manner. It is important to have information
regarding the prevailing trend to identify cause and improvement actions for achieving
success.
Column Labels
Row Labels <1/1/2009 Qtr1 Qtr2 Qtr3 Qtr4 Grand
Total
<1/1/2009
Sum of Sales
Sum of Profit
2009
Sum of Sales 384000.468 583155.794
5
369589.
014
417315.
919
175406
1.196
Sum of Profit 18509.72 47701.7 63265.3
6
22776.2
1
152252.
99
2010
Sum of Sales 338003.962
5
260170.541 337843.
7215
382849.
19
131886
7.415
Sum of Profit 28030.26 17129.61 40106.6
4
46888.3
9
132154.
9
2011
Sum of Sales 366284.752 434479.037 291268.
3345
381322.
467
147335
4.591
Sum of Profit 36982.13 61150.01 26314.7
7
36967.2
2
161414.
13
5
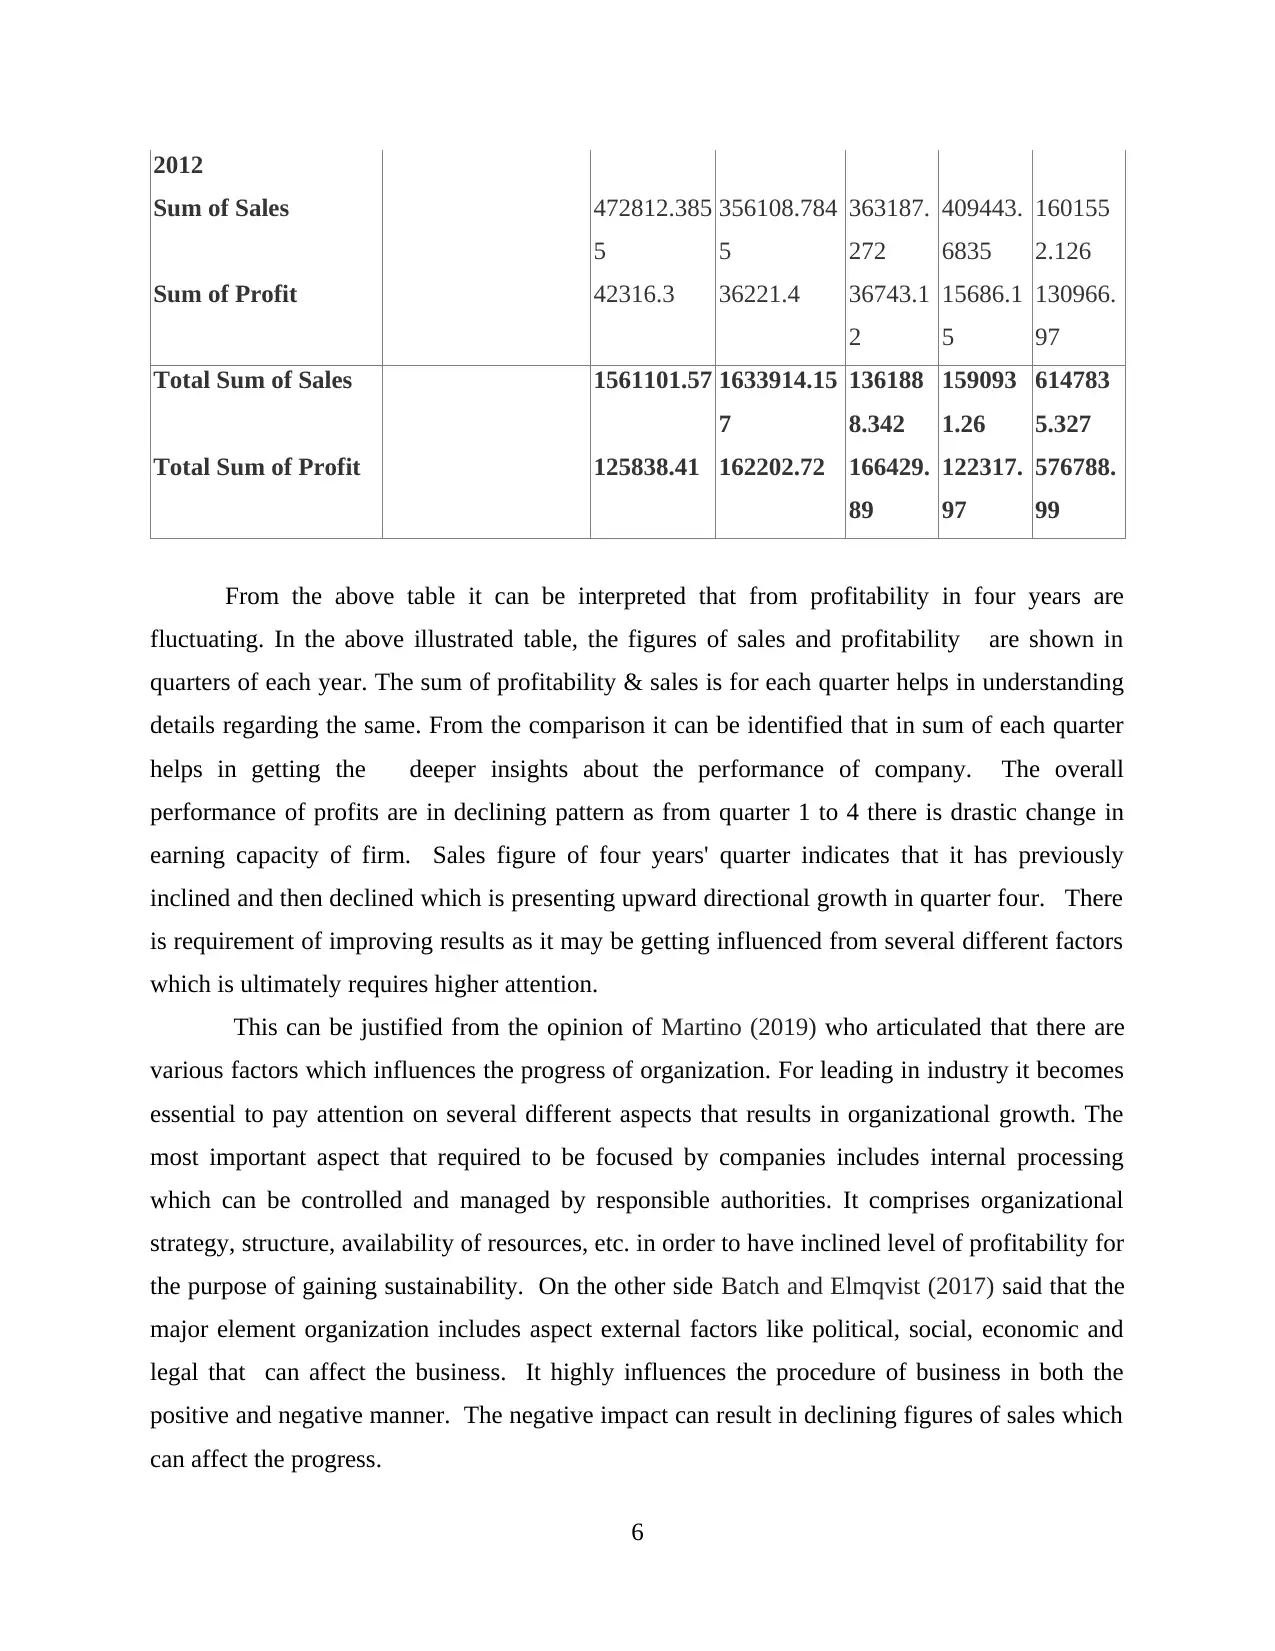
2012
Sum of Sales 472812.385
5
356108.784
5
363187.
272
409443.
6835
160155
2.126
Sum of Profit 42316.3 36221.4 36743.1
2
15686.1
5
130966.
97
Total Sum of Sales 1561101.57 1633914.15
7
136188
8.342
159093
1.26
614783
5.327
Total Sum of Profit 125838.41 162202.72 166429.
89
122317.
97
576788.
99
From the above table it can be interpreted that from profitability in four years are
fluctuating. In the above illustrated table, the figures of sales and profitability are shown in
quarters of each year. The sum of profitability & sales is for each quarter helps in understanding
details regarding the same. From the comparison it can be identified that in sum of each quarter
helps in getting the deeper insights about the performance of company. The overall
performance of profits are in declining pattern as from quarter 1 to 4 there is drastic change in
earning capacity of firm. Sales figure of four years' quarter indicates that it has previously
inclined and then declined which is presenting upward directional growth in quarter four. There
is requirement of improving results as it may be getting influenced from several different factors
which is ultimately requires higher attention.
This can be justified from the opinion of Martino (2019) who articulated that there are
various factors which influences the progress of organization. For leading in industry it becomes
essential to pay attention on several different aspects that results in organizational growth. The
most important aspect that required to be focused by companies includes internal processing
which can be controlled and managed by responsible authorities. It comprises organizational
strategy, structure, availability of resources, etc. in order to have inclined level of profitability for
the purpose of gaining sustainability. On the other side Batch and Elmqvist (2017) said that the
major element organization includes aspect external factors like political, social, economic and
legal that can affect the business. It highly influences the procedure of business in both the
positive and negative manner. The negative impact can result in declining figures of sales which
can affect the progress.
6
⊘ This is a preview!⊘
Do you want full access?
Subscribe today to unlock all pages.
Trusted by 1+ million students worldwide
On the basis of evaluation, it can be interpreted that sales & profitability are fluctuation
g and can affect the company negatively. In addition to this, it can be interpreted that that
organization can get affected due to increase in cost. The reason behind this can be said that
lower profitability will not allow the firm to cover its operational and declined revenue can
influence in overall growth of company. The cause of such factor is that it can be understood
by giving deeper emphasis on components that are increasing profitability. It can be impacted by
discount policy of firm which is provided by company to its customers for boosting growth and
development via covering larger range of market share. For having higher level of sustainability
firm can focus on inclining the attention of customers towards organizational products &
services. Implementing discount policy, marketing & promotional practices can help in having
the ability to attract customers for gaining competitiveness and profitability to lead in industry in
effective pattern.
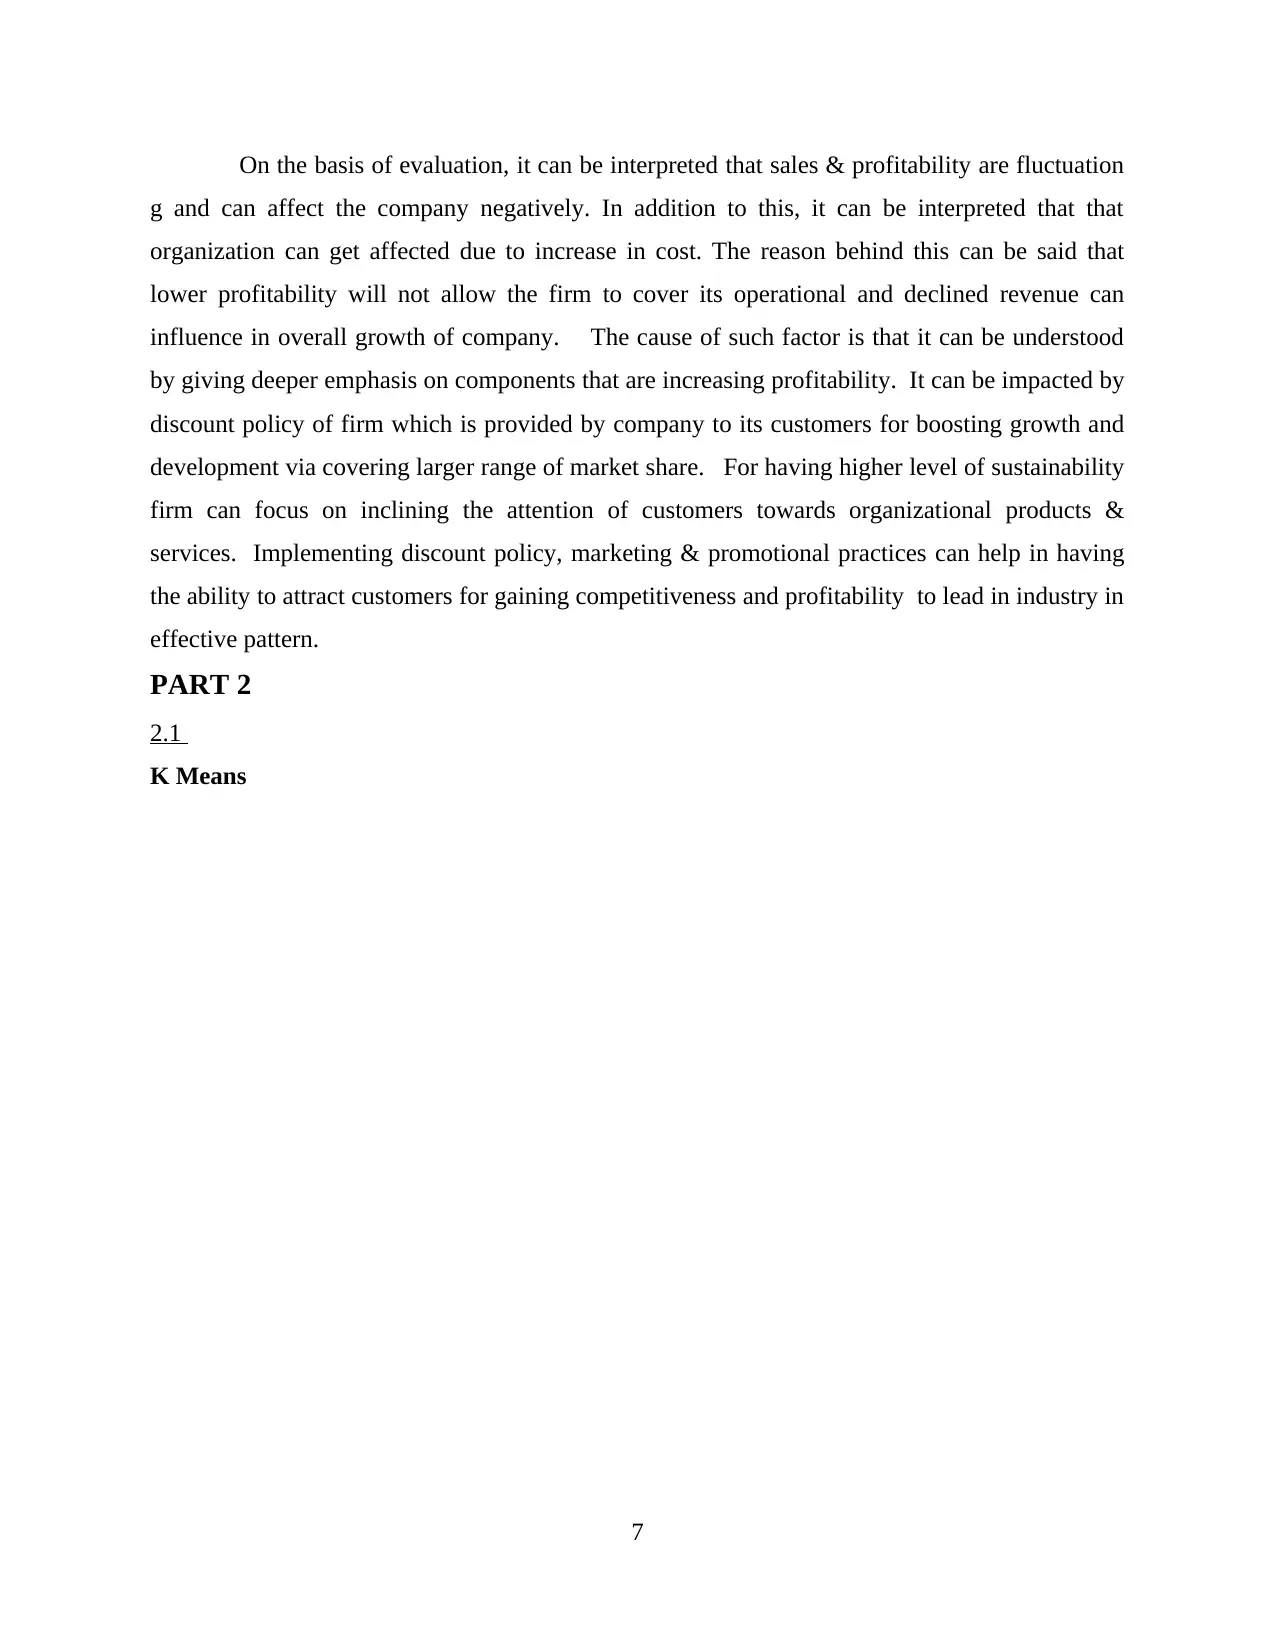
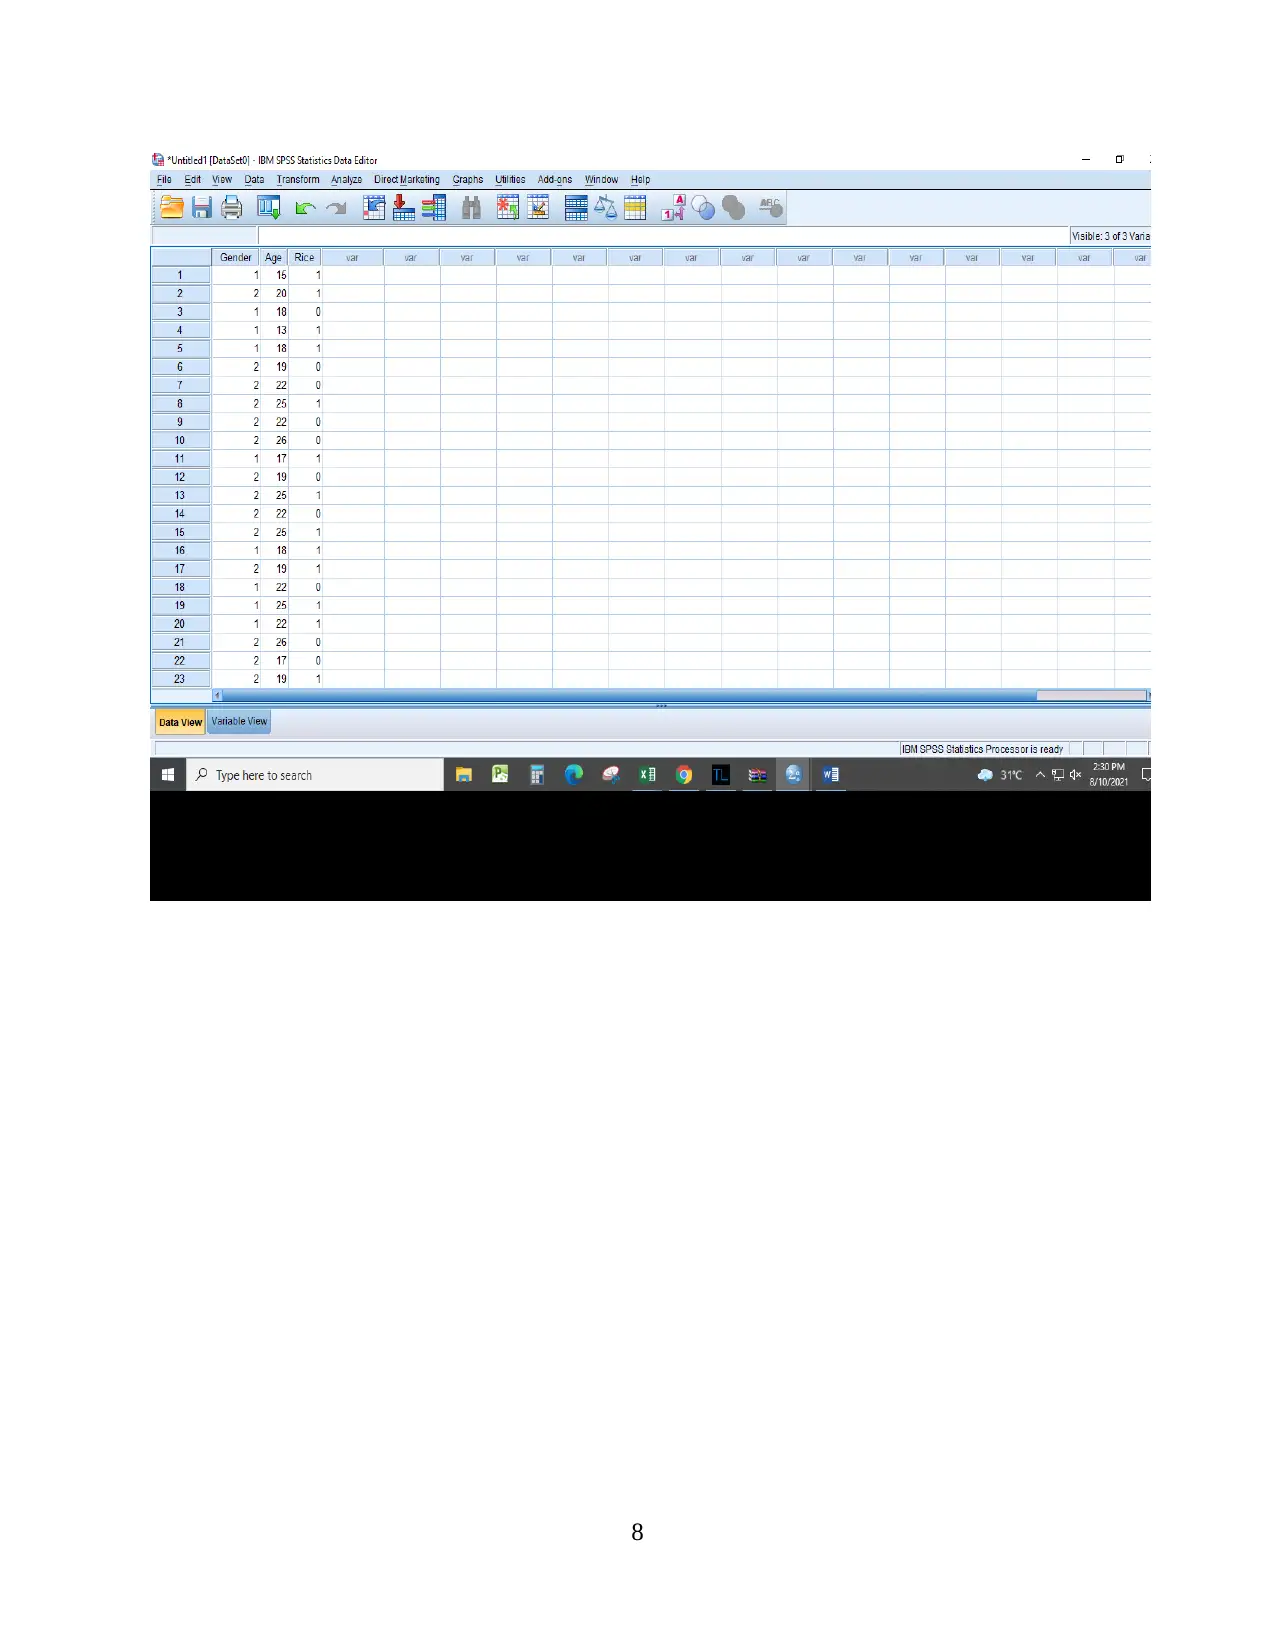
PART 2
2.1
K Means
7
g and can affect the company negatively. In addition to this, it can be interpreted that that
organization can get affected due to increase in cost. The reason behind this can be said that
lower profitability will not allow the firm to cover its operational and declined revenue can
influence in overall growth of company. The cause of such factor is that it can be understood
by giving deeper emphasis on components that are increasing profitability. It can be impacted by
discount policy of firm which is provided by company to its customers for boosting growth and
development via covering larger range of market share. For having higher level of sustainability
firm can focus on inclining the attention of customers towards organizational products &
services. Implementing discount policy, marketing & promotional practices can help in having
the ability to attract customers for gaining competitiveness and profitability to lead in industry in
effective pattern.
PART 2
2.1
K Means
7
Paraphrase This Document
Need a fresh take? Get an instant paraphrase of this document with our AI Paraphraser
8
9
⊘ This is a preview!⊘
Do you want full access?
Subscribe today to unlock all pages.
Trusted by 1+ million students worldwide
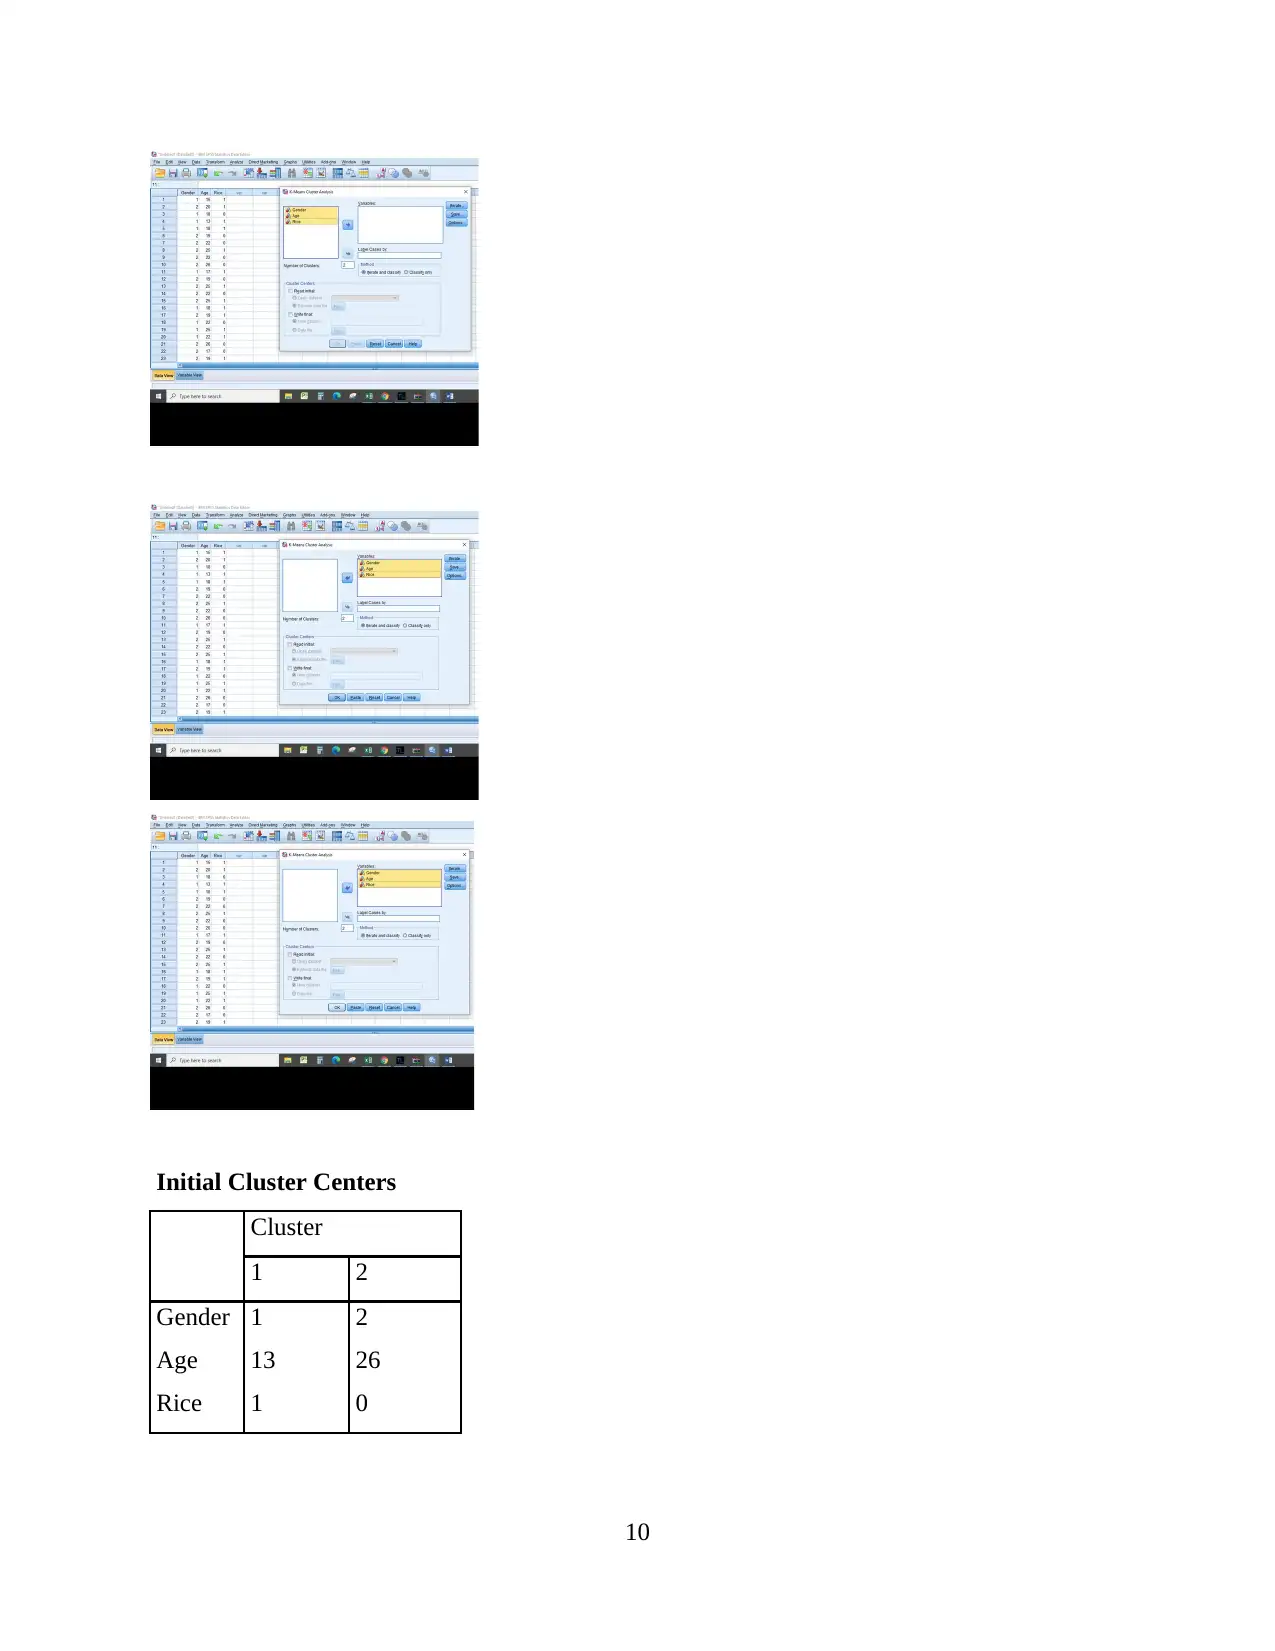
Initial Cluster Centers
Cluster
1 2
Gender 1 2
Age 13 26
Rice 1 0
10
Cluster
1 2
Gender 1 2
Age 13 26
Rice 1 0
10
Paraphrase This Document
Need a fresh take? Get an instant paraphrase of this document with our AI Paraphraser
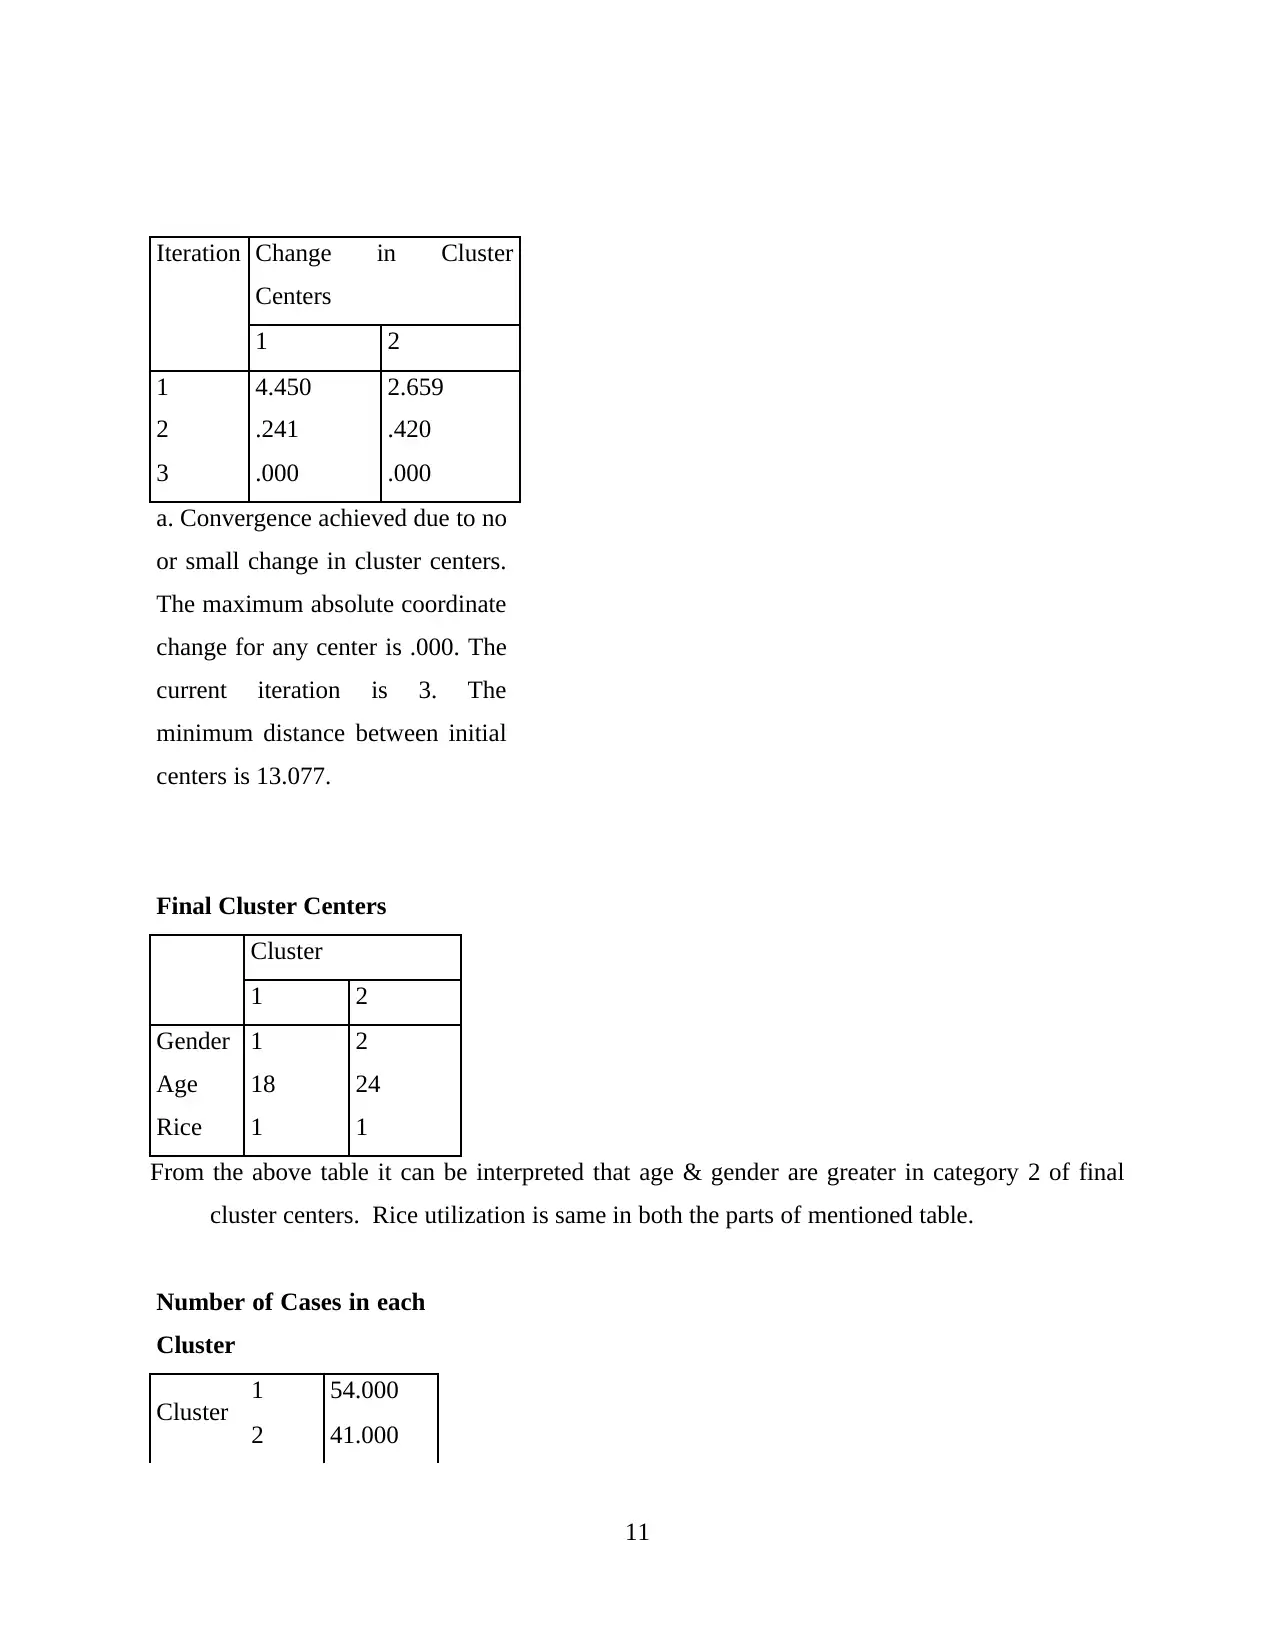
Iteration Change in Cluster
Centers
1 2
1 4.450 2.659
2 .241 .420
3 .000 .000
a. Convergence achieved due to no
or small change in cluster centers.
The maximum absolute coordinate
change for any center is .000. The
current iteration is 3. The
minimum distance between initial
centers is 13.077.
Final Cluster Centers
Cluster
1 2
Gender 1 2
Age 18 24
Rice 1 1
From the above table it can be interpreted that age & gender are greater in category 2 of final
cluster centers. Rice utilization is same in both the parts of mentioned table.
Number of Cases in each
Cluster
Cluster 1 54.000
2 41.000
11
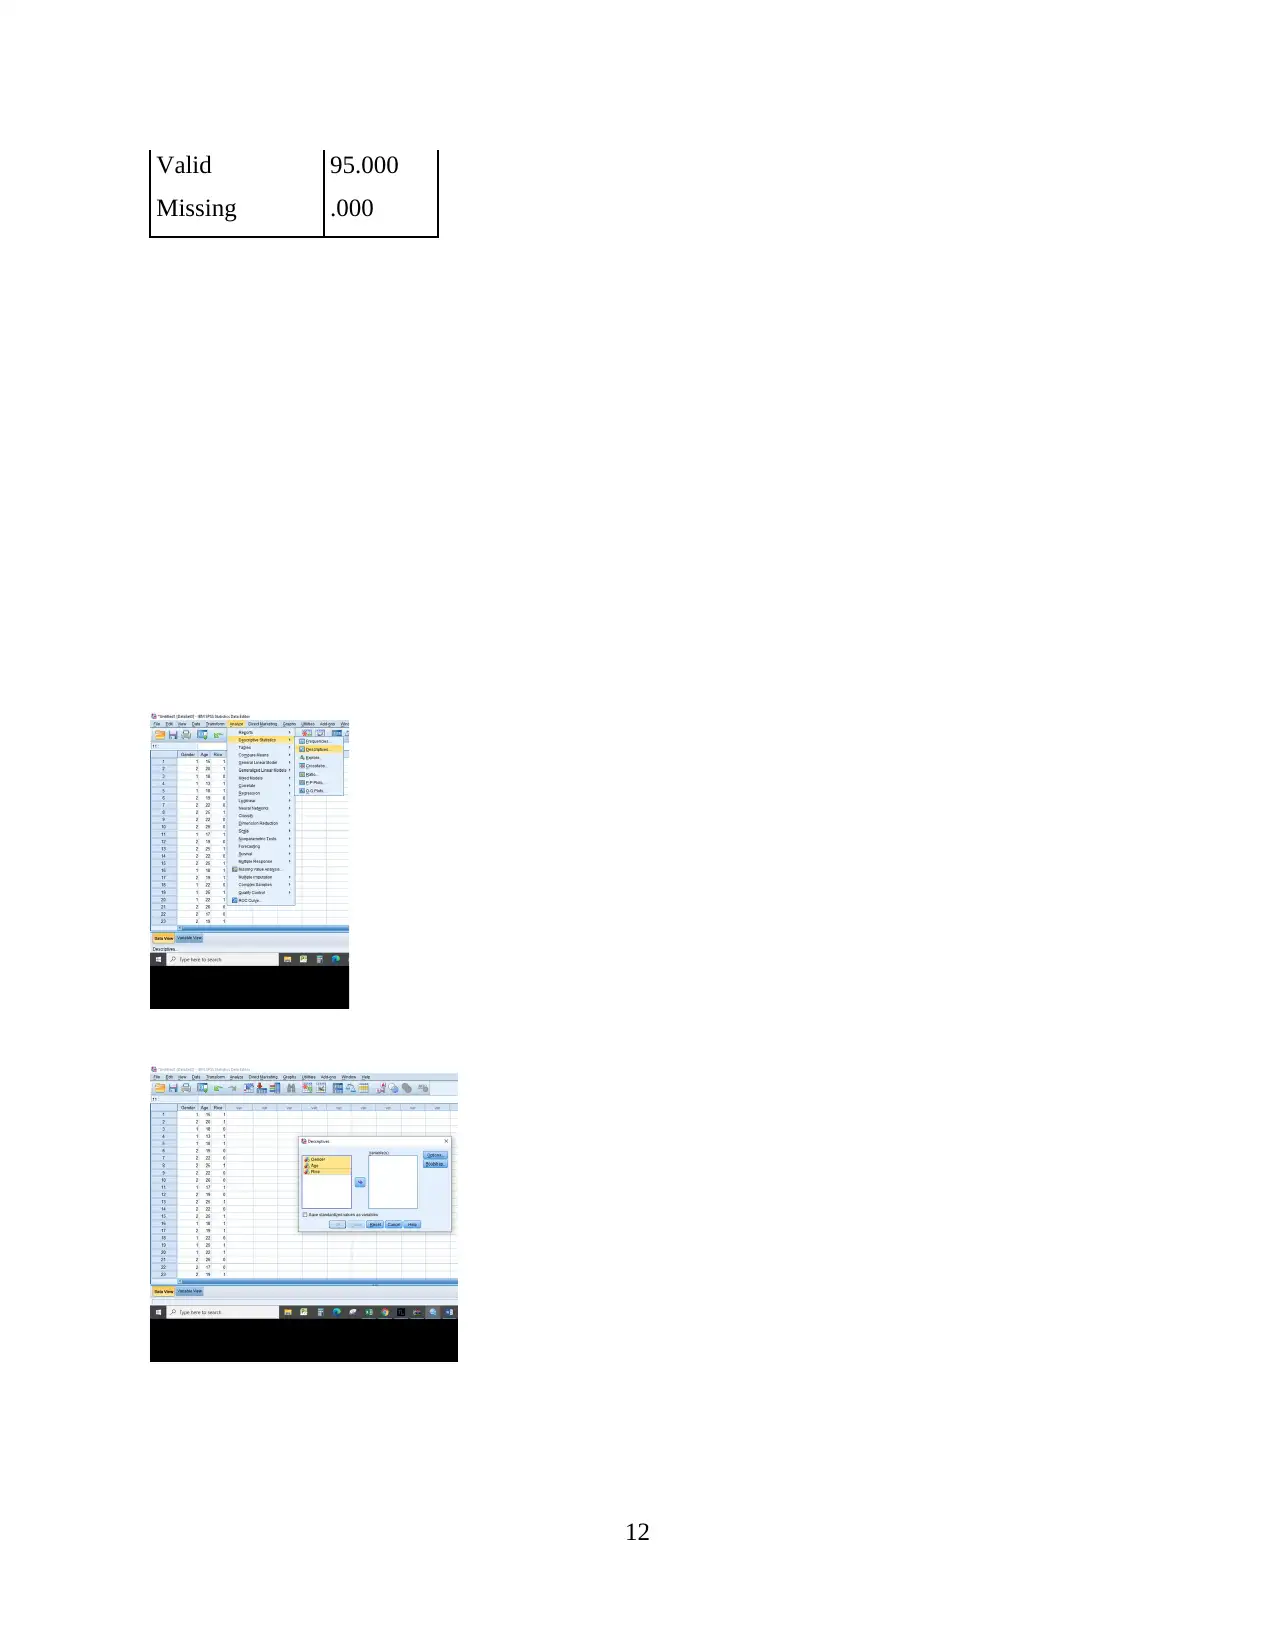
Valid 95.000
Missing .000
12
Missing .000
12
⊘ This is a preview!⊘
Do you want full access?
Subscribe today to unlock all pages.
Trusted by 1+ million students worldwide
1 out of 17
Related Documents


Your All-in-One AI-Powered Toolkit for Academic Success.
+13062052269
info@desklib.com
Available 24*7 on WhatsApp / Email
![[object Object]](/_next/static/media/star-bottom.7253800d.svg)
Unlock your academic potential
Copyright © 2020–2026 A2Z Services. All Rights Reserved. Developed and managed by ZUCOL.