Data Mining for Predicting Patient Details Affected by Hepatitis Disease
VerifiedAdded on 2023/05/27
|33
|2709
|467
AI Summary
This project predicts patient details affected by Hepatitis disease using data mining techniques. It discusses the decision tree algorithm, splitting method, and pruning techniques used to build classification models. It also compares the effectiveness of Bayesian network and Naive Bayes algorithm. The accuracy rates, visual tree diagram, confusion matrix, ROC curve, and lift chart are also provided.
Contribute Materials
Your contribution can guide someone’s learning journey. Share your
documents today.
1
Data Mining
Data Mining
Secure Best Marks with AI Grader
Need help grading? Try our AI Grader for instant feedback on your assignments.
Table of Contents
1 Introduction.......................................................................................................................2
2 Task - 1...............................................................................................................................2
2.1 Suitable Tree Building algorithm.............................................................................2
2.2 Splitting Method........................................................................................................2
2.3 Output Results...........................................................................................................3
2.4 Accuracy Rates..........................................................................................................7
2.5 Visual Tree diagram..................................................................................................7
3 Task - 2...............................................................................................................................7
3.1 Description of the Classification Model...................................................................7
4 Task - 3...............................................................................................................................8
4.1 Confidence Factor to 30%........................................................................................8
5 Task - 4.............................................................................................................................11
5.1 Set the REF Parameter to TRUE...........................................................................11
6 Task - 5.............................................................................................................................13
6.1 Set the parameter unpruned to TRUE..................................................................13
7 Task - 6.............................................................................................................................15
7.1 Models comparative Ability to other two models.................................................15
7.2 Bayesian Network....................................................................................................16
7.3 Naïve Bayes Network..............................................................................................19
8 Task - 7.............................................................................................................................20
8.1 Confusion Matrix.....................................................................................................20
8.2 ROC Curve...............................................................................................................21
8.3 Lift Chart.................................................................................................................23
9 Task - 8.............................................................................................................................25
9.1 Generate the set of rules along the sub tree path.................................................25
10 Conclusion....................................................................................................................31
References...............................................................................................................................32
1
1 Introduction
The main objective of this project is to predict the patient details, which are affected by
the Hepatitis disease. The data prediction is completed by using the weka data mining tool.
Basically, data prediction uses two models such as, predication and classification models.
The classification model has various methods to predict the required information. Here, we
are using the decision tree to build the classification models for the Hepatitis disease related
data.
First, we are choosing the appropriate building algorithms to build a model and split the
Hepatitis disease data for training and testing purposes. Once an appropriate building
algorithms are selected, then later the user needs to provide the detailed technical description
of the classification model. Next, it is possible to utilize the tree induction method for the
classification models. Then, change the confidence factor to 30%, set the Parameter unpruned
to TRUE and set the reduced error pruning to True. Also, it is required to explain and report
on, building the classification models and their changes in the model accuracy. Additionally,
show the ROC curve, lift chart and confusion matrix for the models. Finally, generate the set
of rules.
2 Task - 1
2.1 Suitable Tree Building algorithm
To predict the patient information in the data of Hepatitis disease, which is selected
by the J48 decision tree algorithm. The J48 classification is used to provide an effective
prediction for the provided data (Arabnia, Stahlbock, Abou-Nasr & Weiss, n.d.).
2.2 Splitting Method
To evaluate a classifier, use the spitting method. This method is used for splitting the
provided data randomly into testing and training parts.
It is possible to access a classifier by splitting the provided data set randomly
into the testing and training set.
If we evaluate the classifier many time, it slightly changes the results and
calculates the standard deviation.
The train set and test set changes the results by different splits and it produces
slightly different results.
2
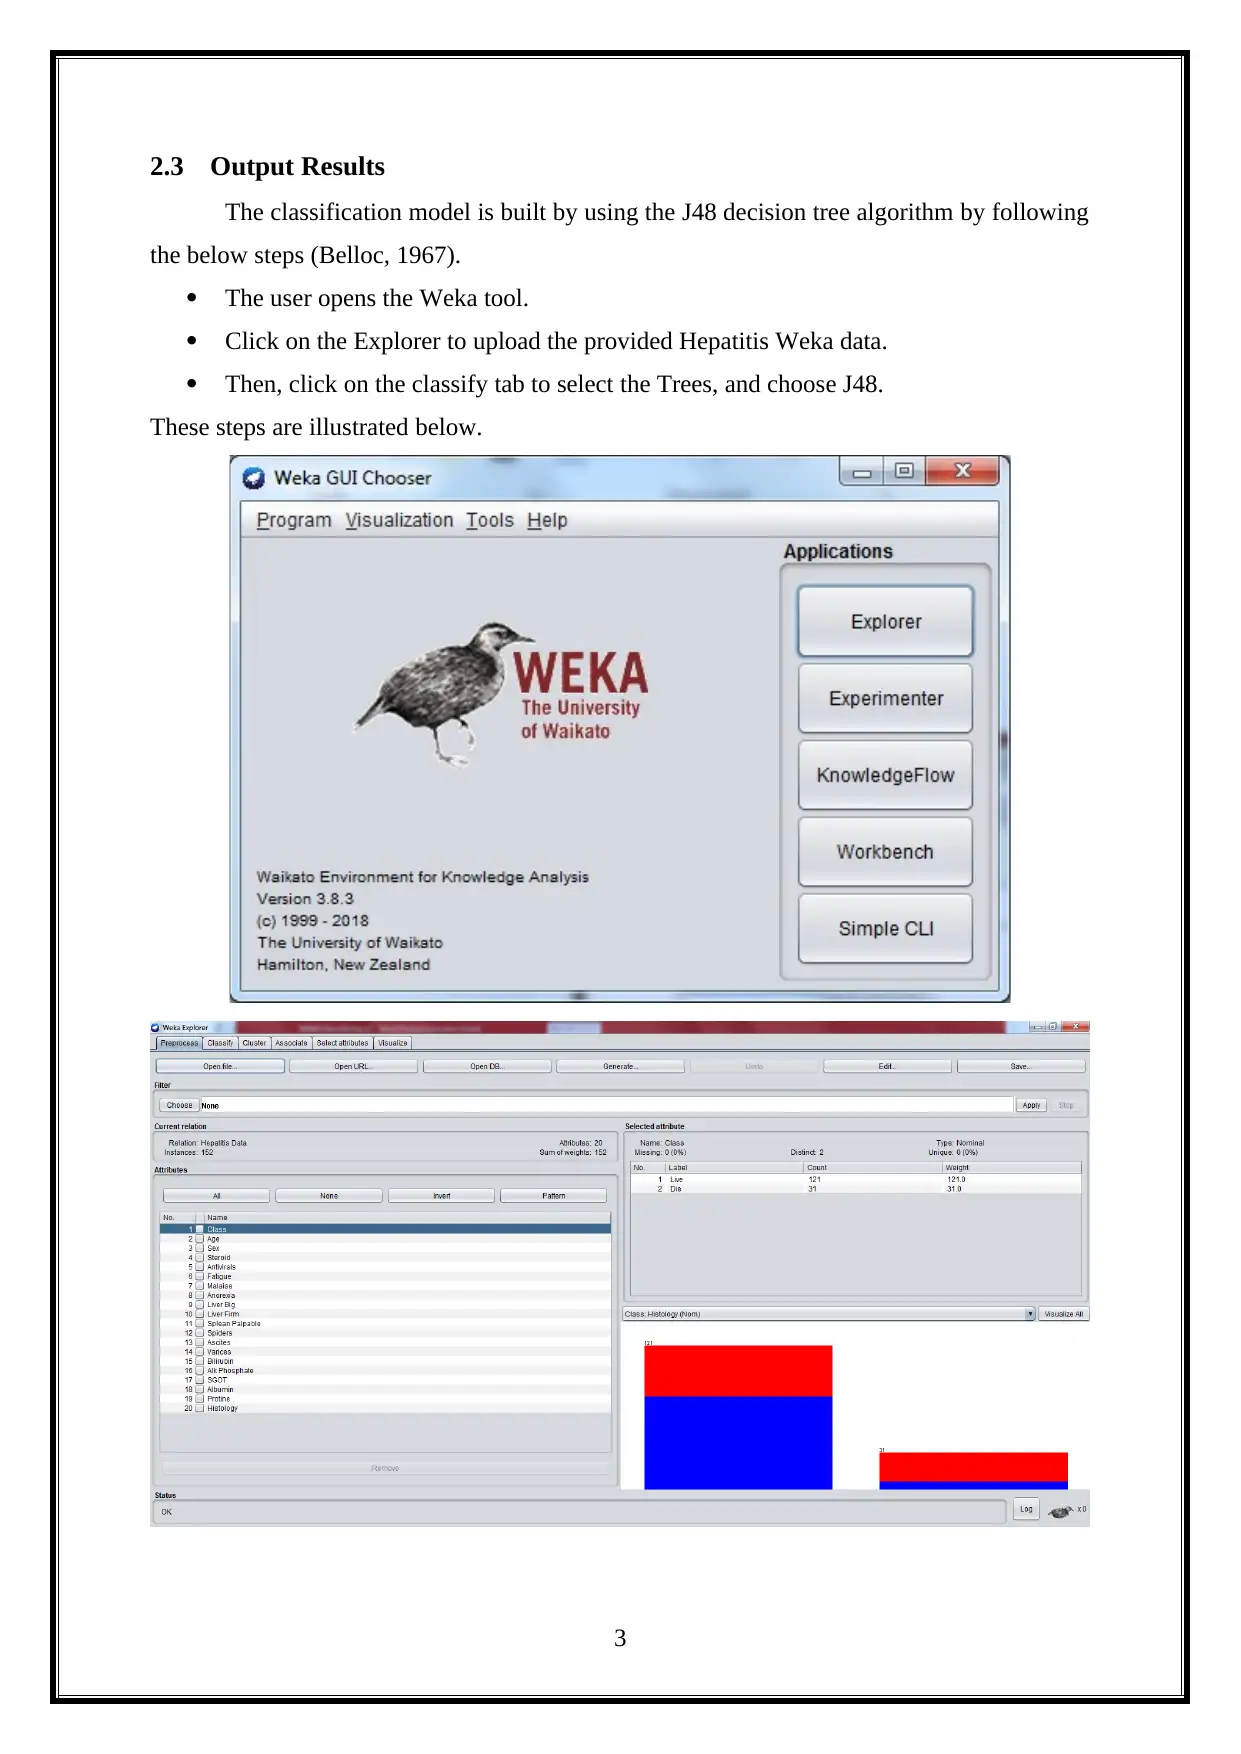
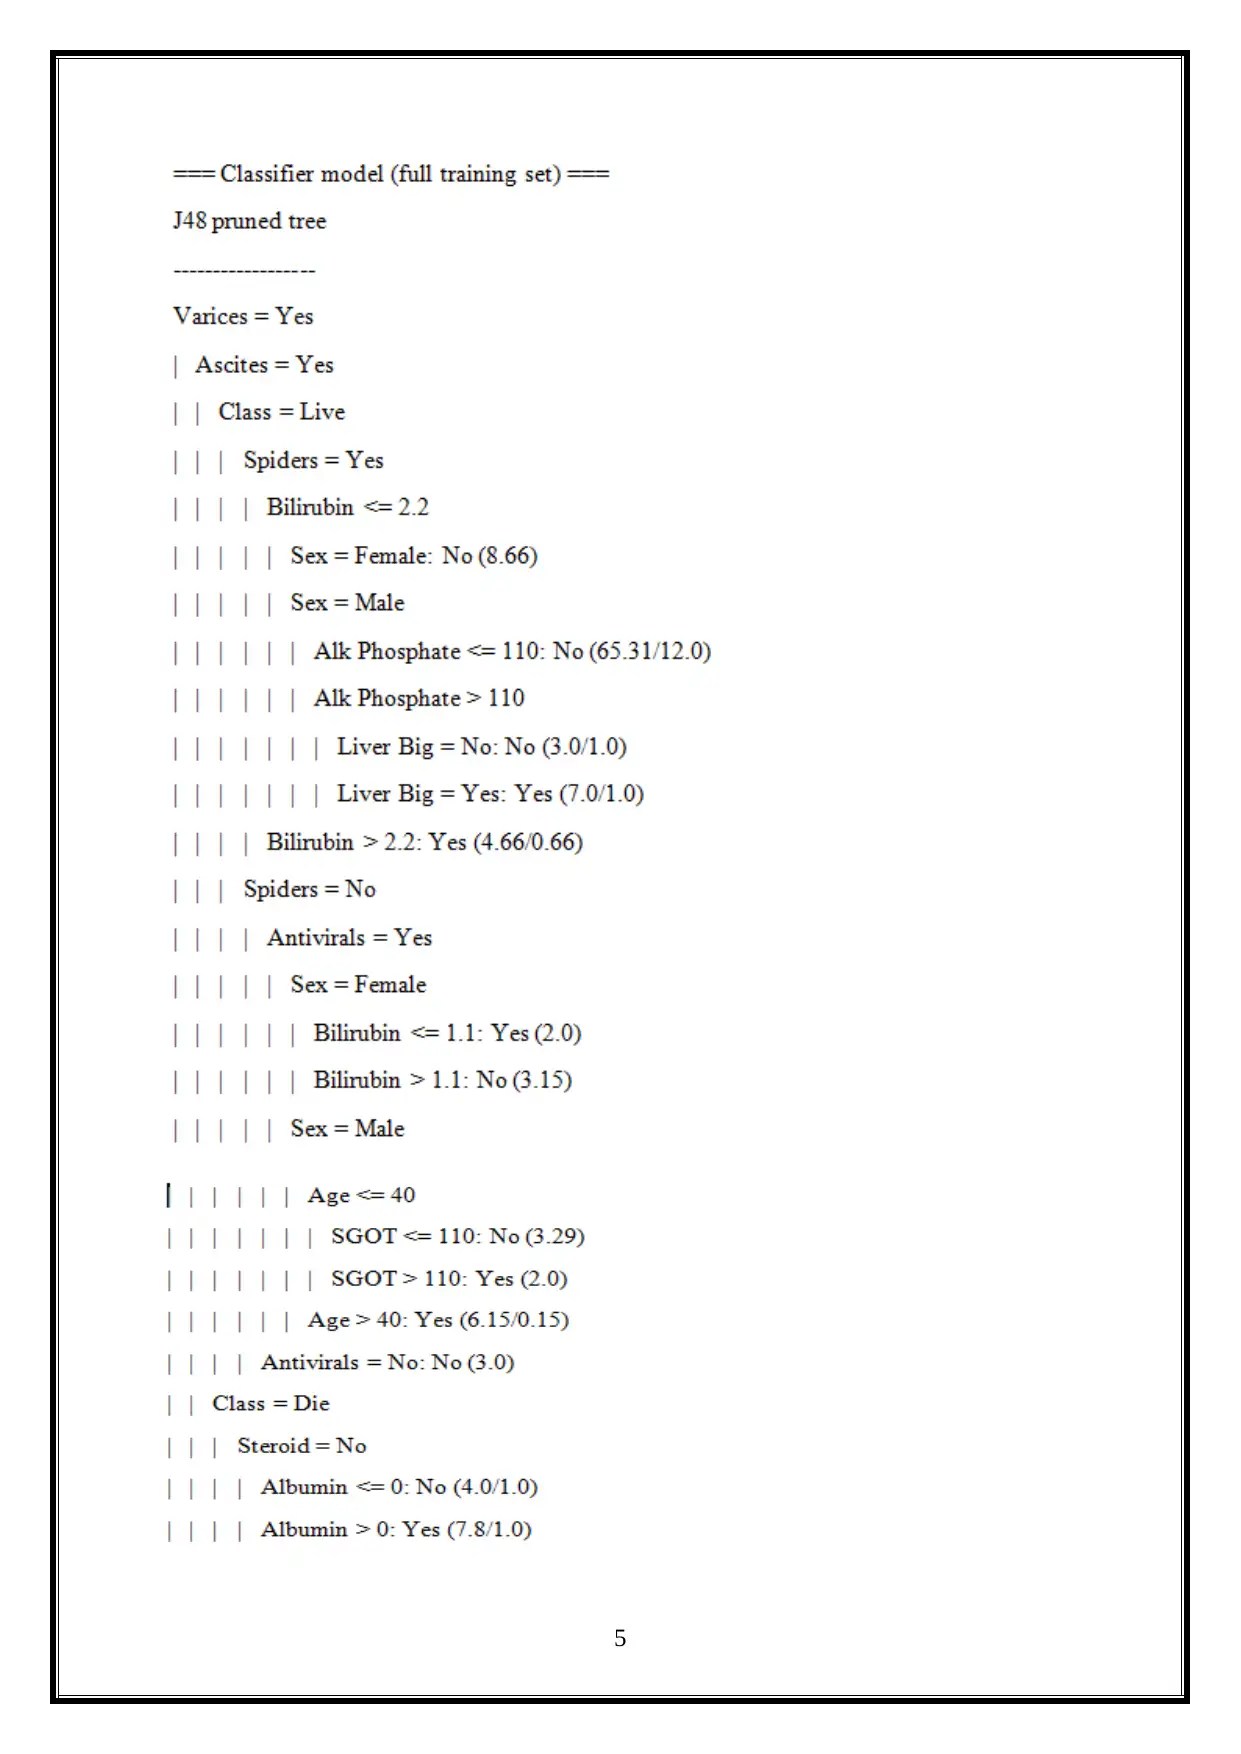
2.3 Output Results
The classification model is built by using the J48 decision tree algorithm by following
the below steps (Belloc, 1967).
The user opens the Weka tool.
Click on the Explorer to upload the provided Hepatitis Weka data.
Then, click on the classify tab to select the Trees, and choose J48.
These steps are illustrated below.
3
Secure Best Marks with AI Grader
Need help grading? Try our AI Grader for instant feedback on your assignments.

4
5
6
Paraphrase This Document
Need a fresh take? Get an instant paraphrase of this document with our AI Paraphraser
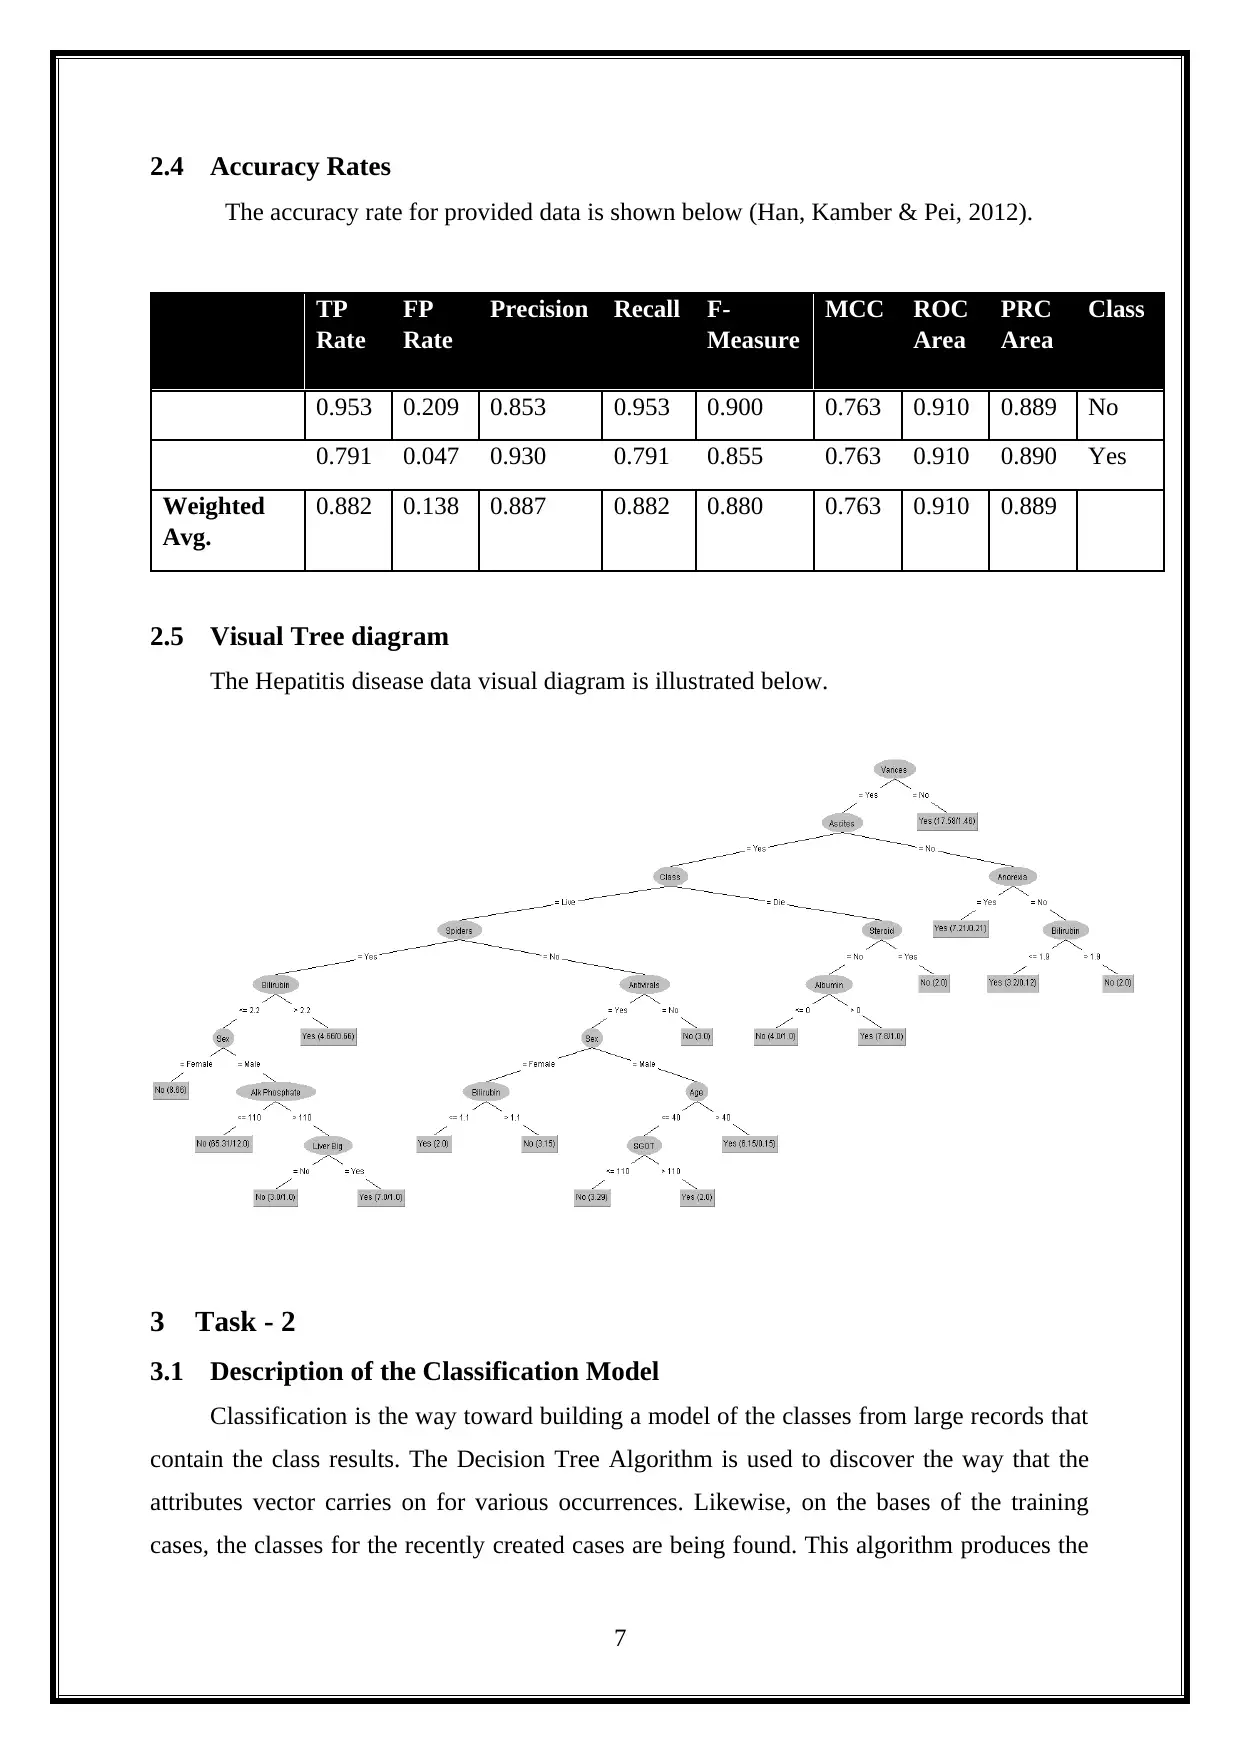
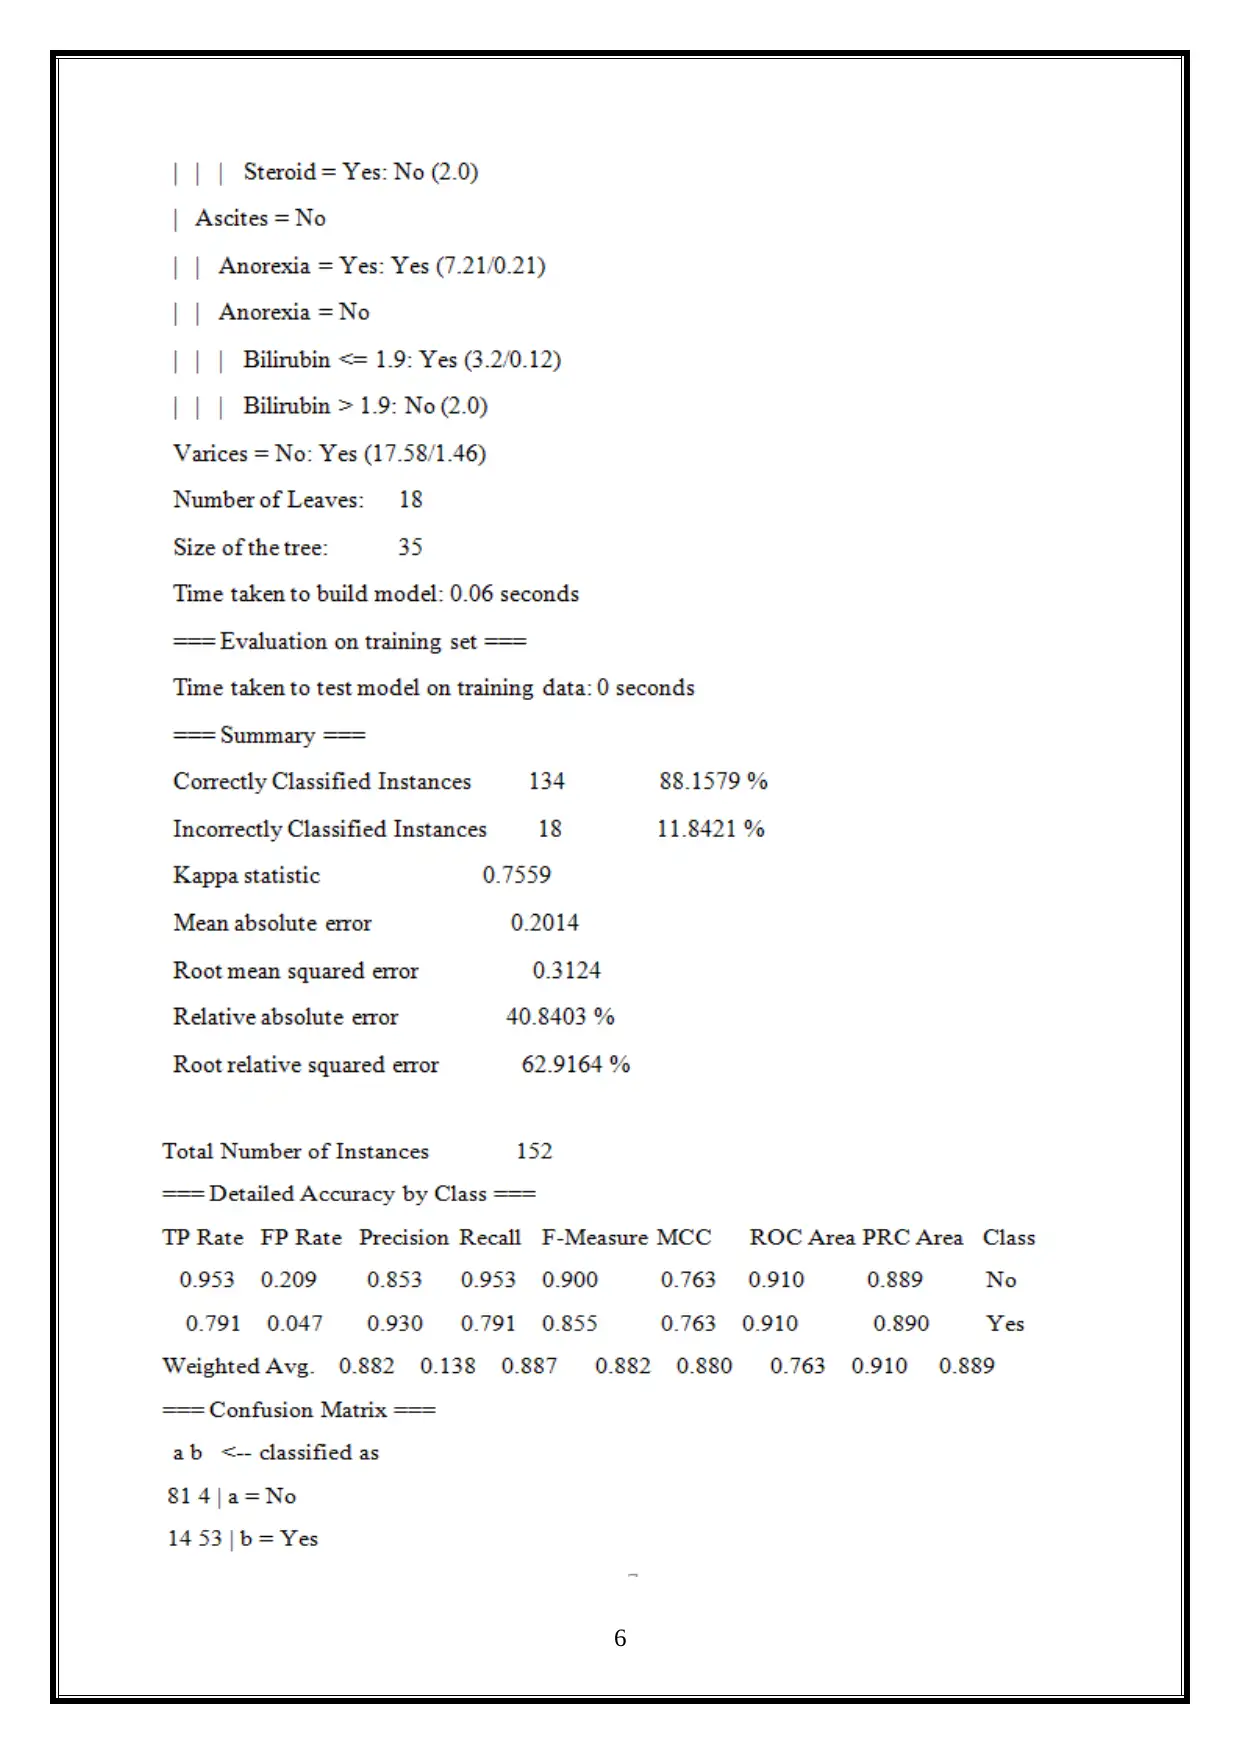
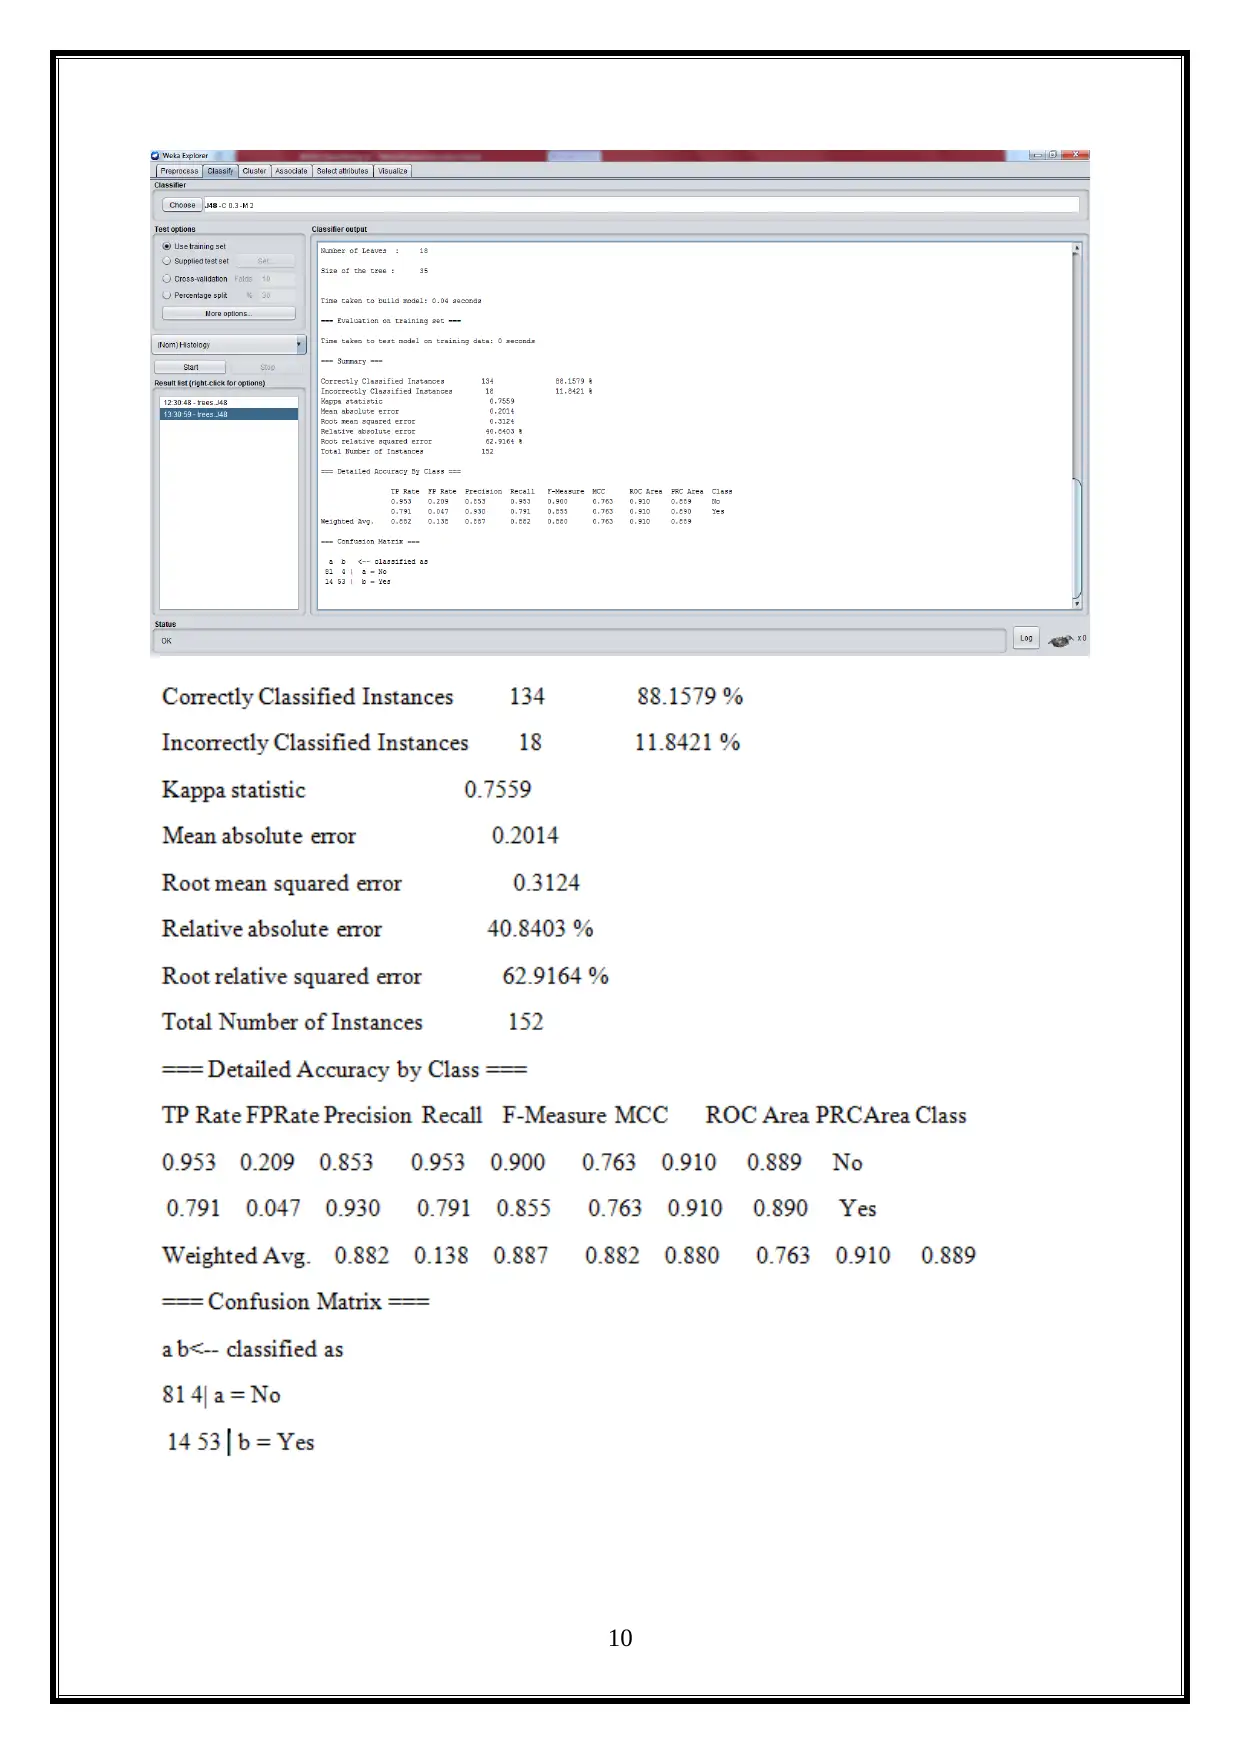
2.4 Accuracy Rates
The accuracy rate for provided data is shown below (Han, Kamber & Pei, 2012).
TP
Rate
FP
Rate
Precision Recall F-
Measure
MCC ROC
Area
PRC
Area
Class
0.953 0.209 0.853 0.953 0.900 0.763 0.910 0.889 No
0.791 0.047 0.930 0.791 0.855 0.763 0.910 0.890 Yes
Weighted
Avg.
0.882 0.138 0.887 0.882 0.880 0.763 0.910 0.889
2.5 Visual Tree diagram
The Hepatitis disease data visual diagram is illustrated below.
3 Task - 2
3.1 Description of the Classification Model
Classification is the way toward building a model of the classes from large records that
contain the class results. The Decision Tree Algorithm is used to discover the way that the
attributes vector carries on for various occurrences. Likewise, on the bases of the training
cases, the classes for the recently created cases are being found. This algorithm produces the
7
rules for the prediction of the objective variable. With the assistance of tree classification
algorithm, the basic conveyance of data is effectively sensible (Li, 2012).
J48 is an increase of ID3. The extra highlights of J48 represents the missing qualities,
decision trees pruning, derivation of rules, continuous attribute value range and so on.
In the WEKA data mining tool, J48 is an open source Java usage of the C4.5 algorithm.
The WEKA tool is used to provide various decisions related with the tree pruning. If there
should arise an occurrence of potential over the fitting pruning, then it can be utilized as a
device for précising. In different algorithms, the classification is performed recursively till
each and every leaf (which are the data classification) should be as perfect as it could be
expected under the circumstances. This algorithm produces the standards from which the
specific personality of that data is created. The goal is a logical assumption of the decision
tree, until the point that it picks up the balance of the adaptability and accuracy.
We are building the classification models to predict the patient details about the
patients affected by the Hepatitis disease. Additionally, the tree induction method is used,
which is also called as the decision tree induction method.
4 Task - 3
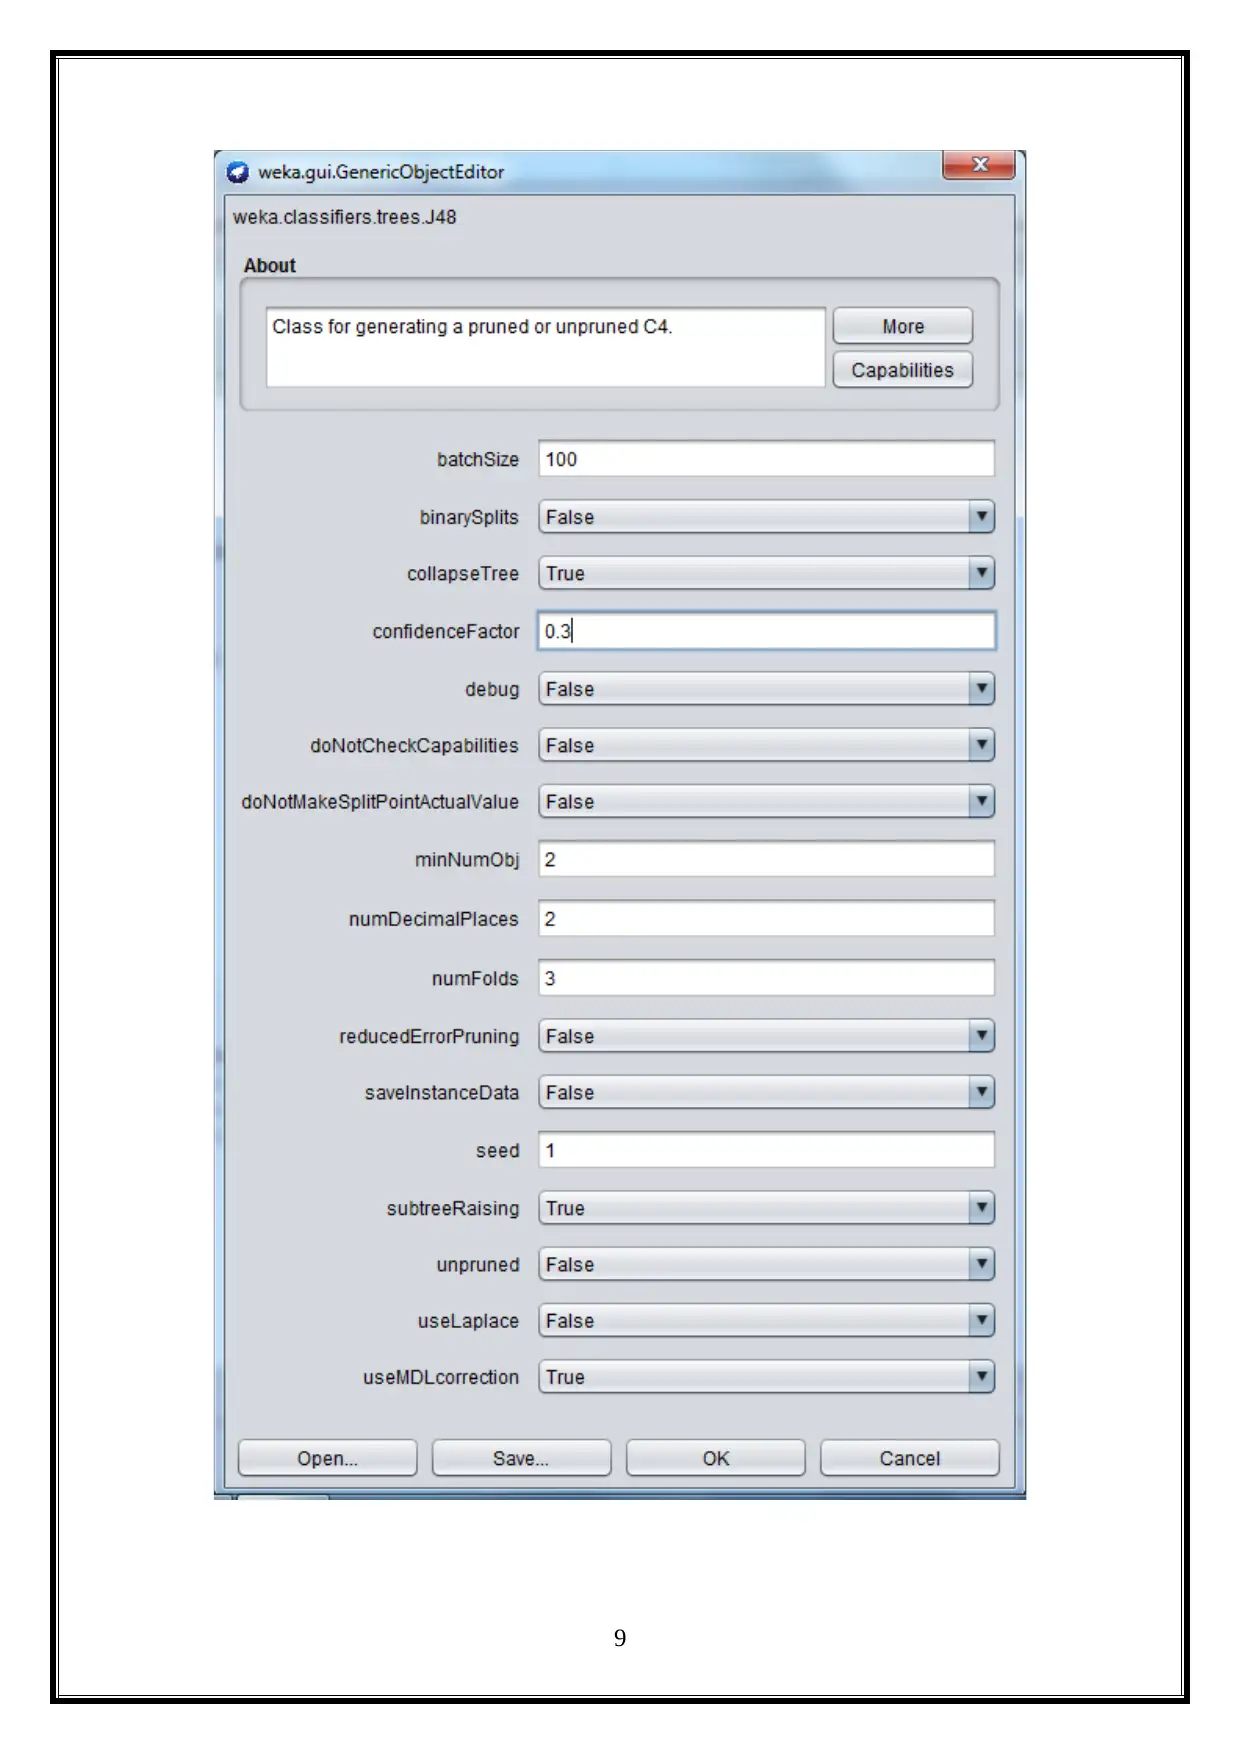
4.1 Confidence Factor to 30%
In this task, the confidence Factor is changed to 30%, and the confidence factor
changes does not change the model accuracy for the provided data. It is shown below.
8
algorithm, the basic conveyance of data is effectively sensible (Li, 2012).
J48 is an increase of ID3. The extra highlights of J48 represents the missing qualities,
decision trees pruning, derivation of rules, continuous attribute value range and so on.
In the WEKA data mining tool, J48 is an open source Java usage of the C4.5 algorithm.
The WEKA tool is used to provide various decisions related with the tree pruning. If there
should arise an occurrence of potential over the fitting pruning, then it can be utilized as a
device for précising. In different algorithms, the classification is performed recursively till
each and every leaf (which are the data classification) should be as perfect as it could be
expected under the circumstances. This algorithm produces the standards from which the
specific personality of that data is created. The goal is a logical assumption of the decision
tree, until the point that it picks up the balance of the adaptability and accuracy.
We are building the classification models to predict the patient details about the
patients affected by the Hepatitis disease. Additionally, the tree induction method is used,
which is also called as the decision tree induction method.
4 Task - 3
4.1 Confidence Factor to 30%
In this task, the confidence Factor is changed to 30%, and the confidence factor
changes does not change the model accuracy for the provided data. It is shown below.
8
9
Secure Best Marks with AI Grader
Need help grading? Try our AI Grader for instant feedback on your assignments.
10
5 Task - 4
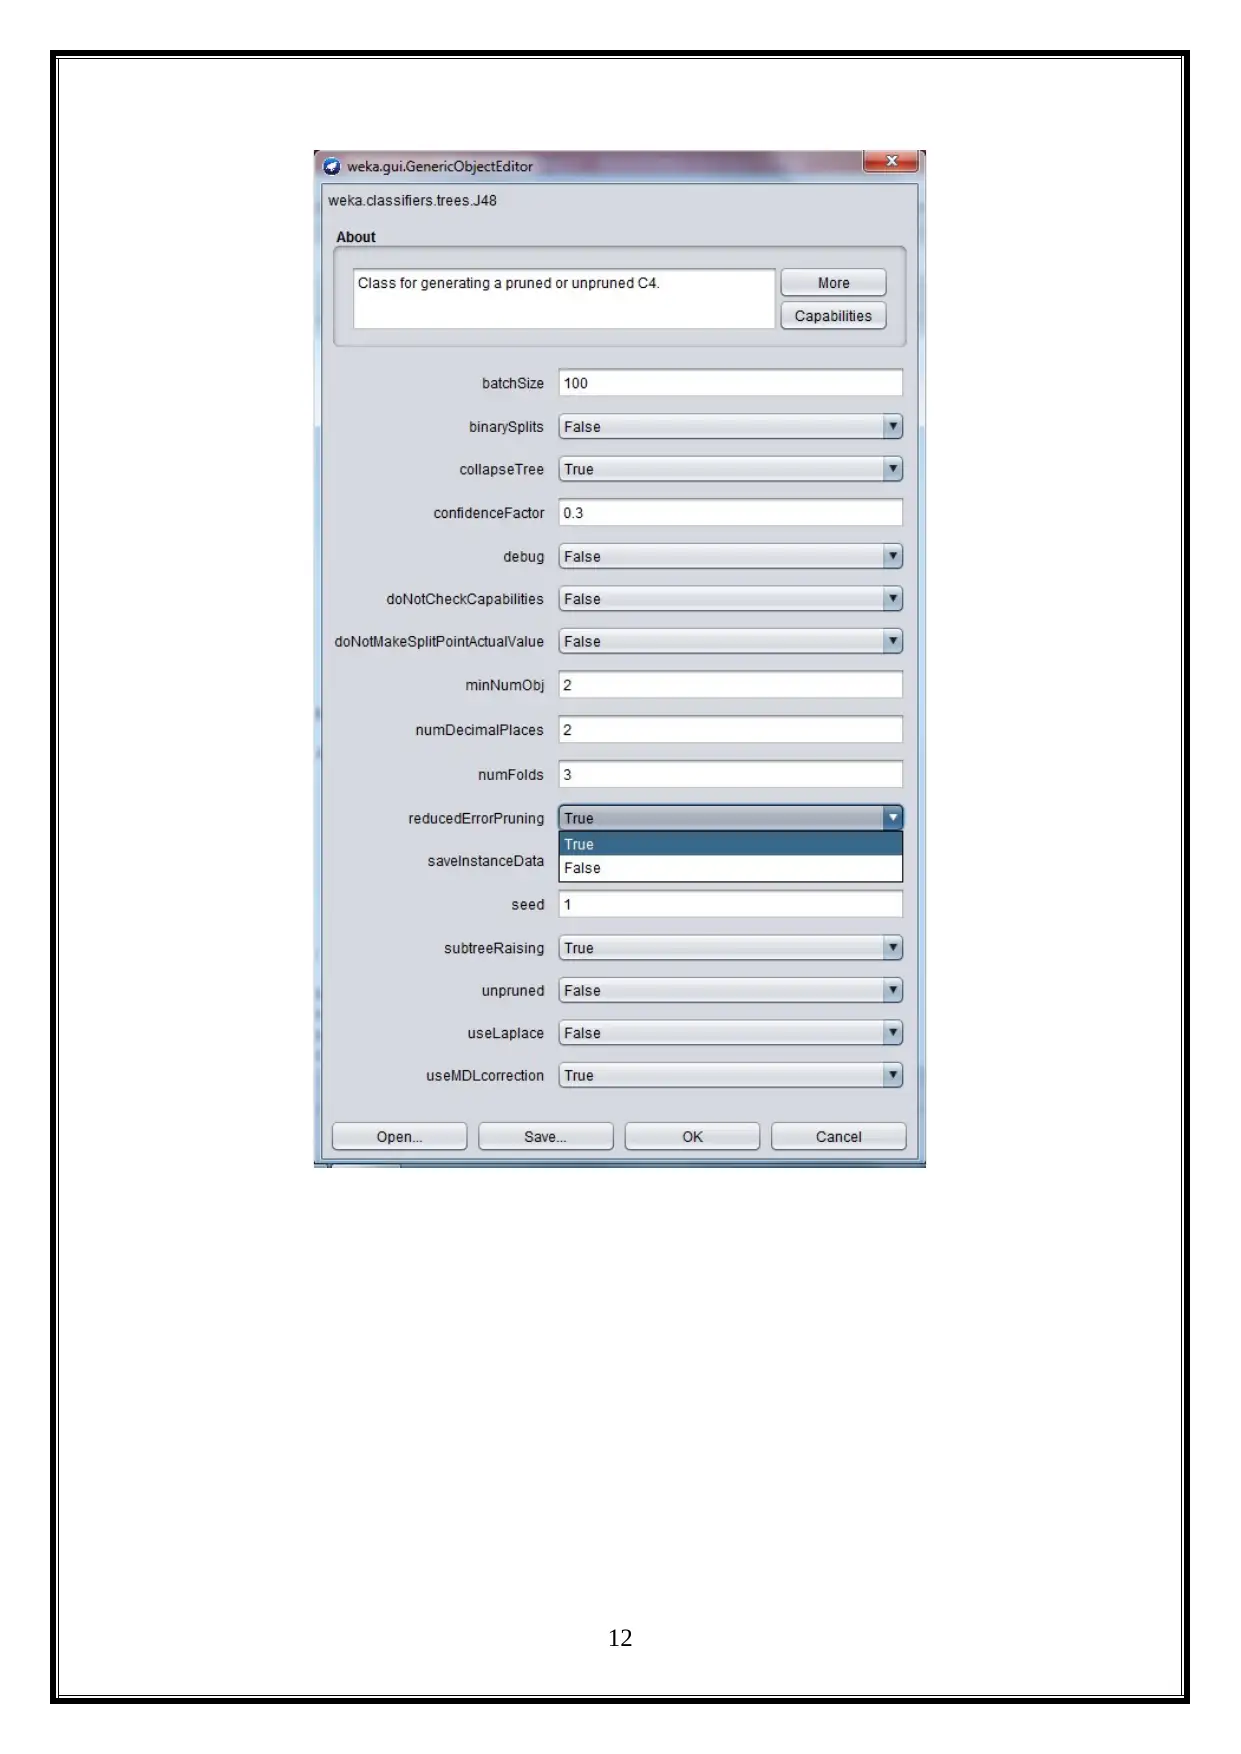
5.1 Set the REF Parameter to TRUE
Here, the reduced error pruning is set as true, because it is used to increase the accurate
detection rate by using the fast pruning algorithm, with respect to the noisy the training data.
It also improves the decision tree algorithm’s accuracy (Michalski, 2014).
Despite the fact that, the decision tree is produced by the ID3, C4.5 is exact and
proficient. However, they regularly give very large trees that make them inconceivable to the
experts. At the point when the decision tree are encouraged, a considerable lot of branches
will reflect the anomalies in the training data. Because of the disorder in the provided data.
This issue of over fitting happens when the learning algorithm keeps on creating hypothesis
that reduces the training set error at the expense of an expanded test set errors. To beat these
issues of over fitting, pruning is important. Pruning the decision tree is the principal step in
streamlining the computational effectiveness and in addition of the classification accuracy.
Pruning for the most part brings about decreasing size of tree, avoids the unnecessary
complexity, and withdraws from over fitting of the data set, while classifying the new data.
Over fitting can prompt an unnecessarily extensive number of rules, a considerable lot of
which have next to no prescient incentive for the concealed data.
It is the simplest and most reasonable strategy in decision tree pruning. This technique
considers every one with the decision hubs, in the tree to have the possibility of pruning,
contain removing the sub tree established at that hub, and makes it a leaf hub. The provided
data is partitioned into three sections such as, the training examples, validation examples used
for pruning the tree, and a lot of test precedents used to estimate the accuracy over the
provided data. On the off chance, that the error rate of the new tree would be equivalent or
smaller than that of the first tree and that sub tree contains no sub tree with a similar property,
at that point the sub tree is supplanted by the leaf hub, and implied pruning is finished.
Generally, do not prune it. The advantages of this technique are its direct computational
complexity. It is shown below (Mitchell, 2017).
11
12
Paraphrase This Document
Need a fresh take? Get an instant paraphrase of this document with our AI Paraphraser
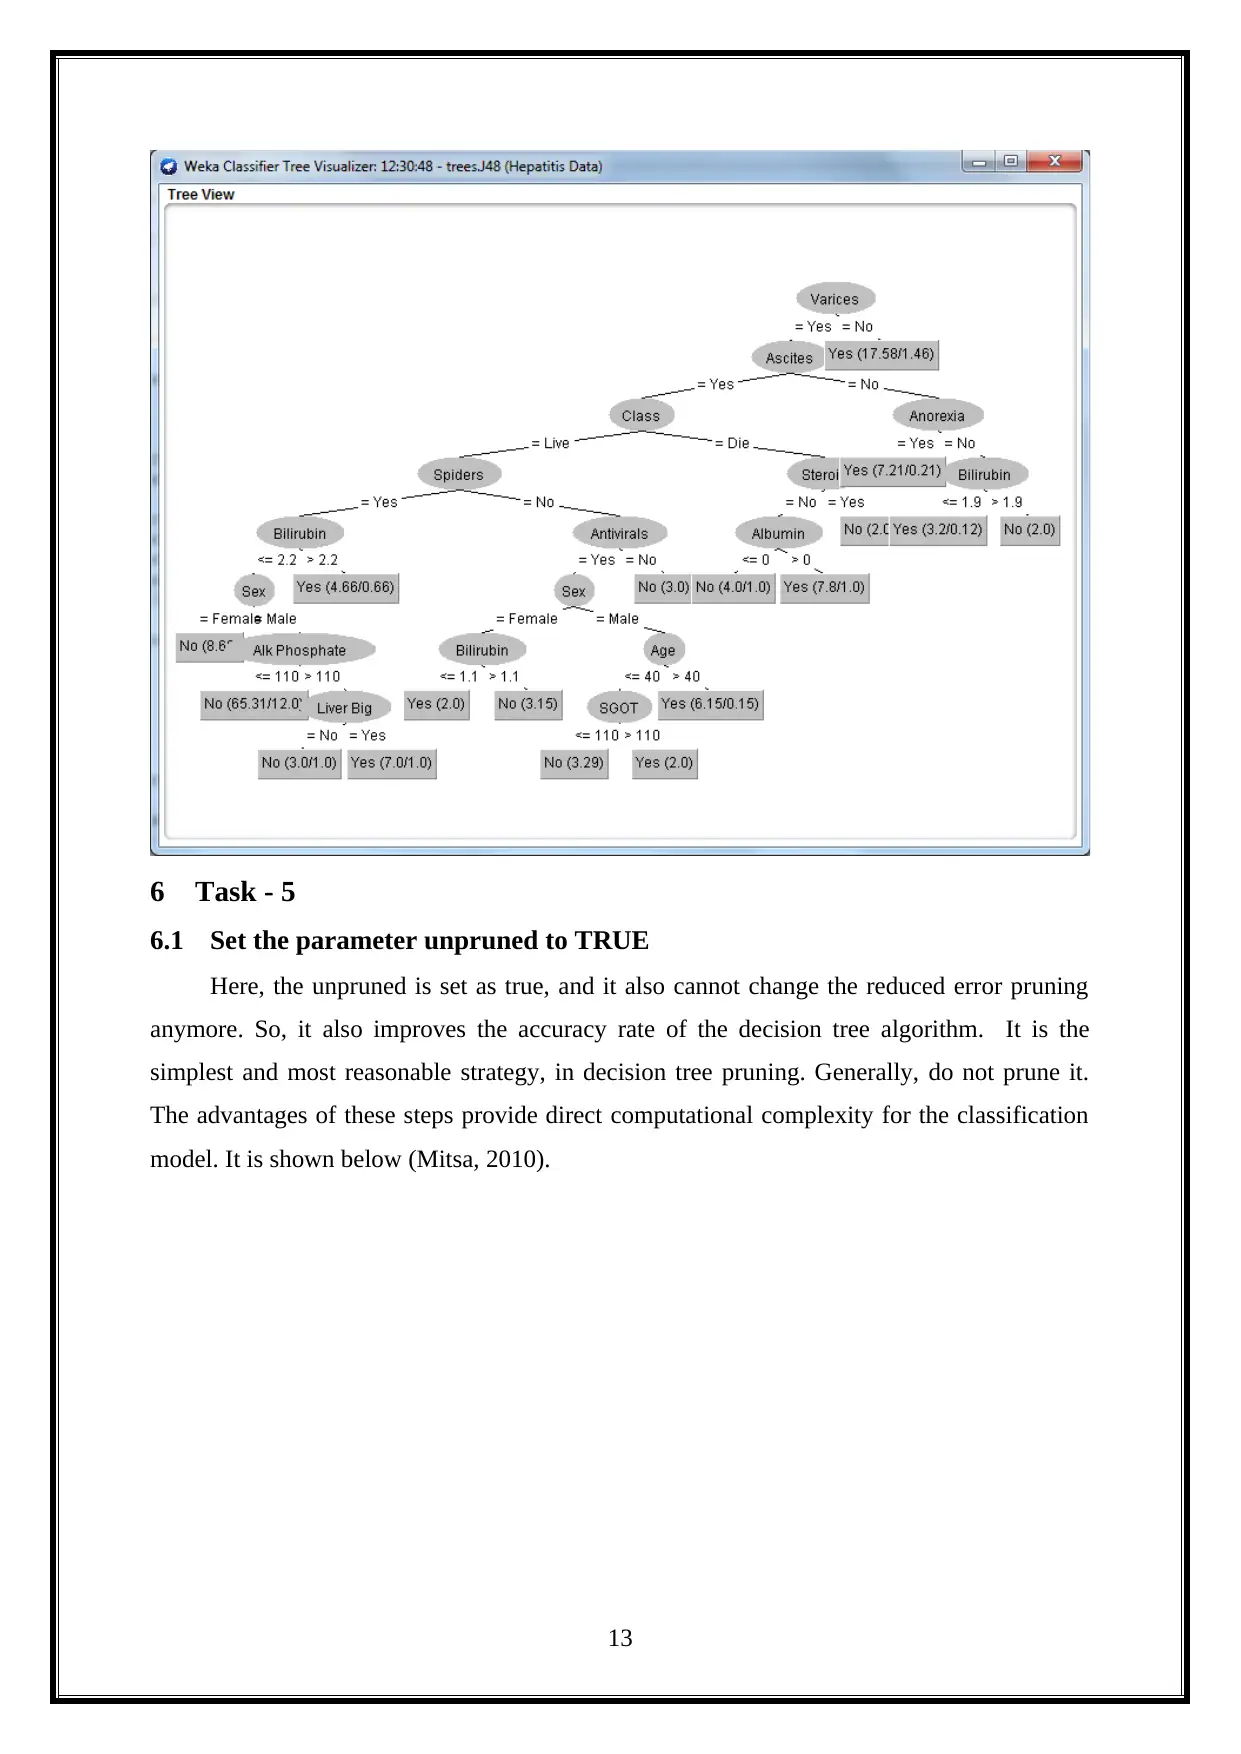
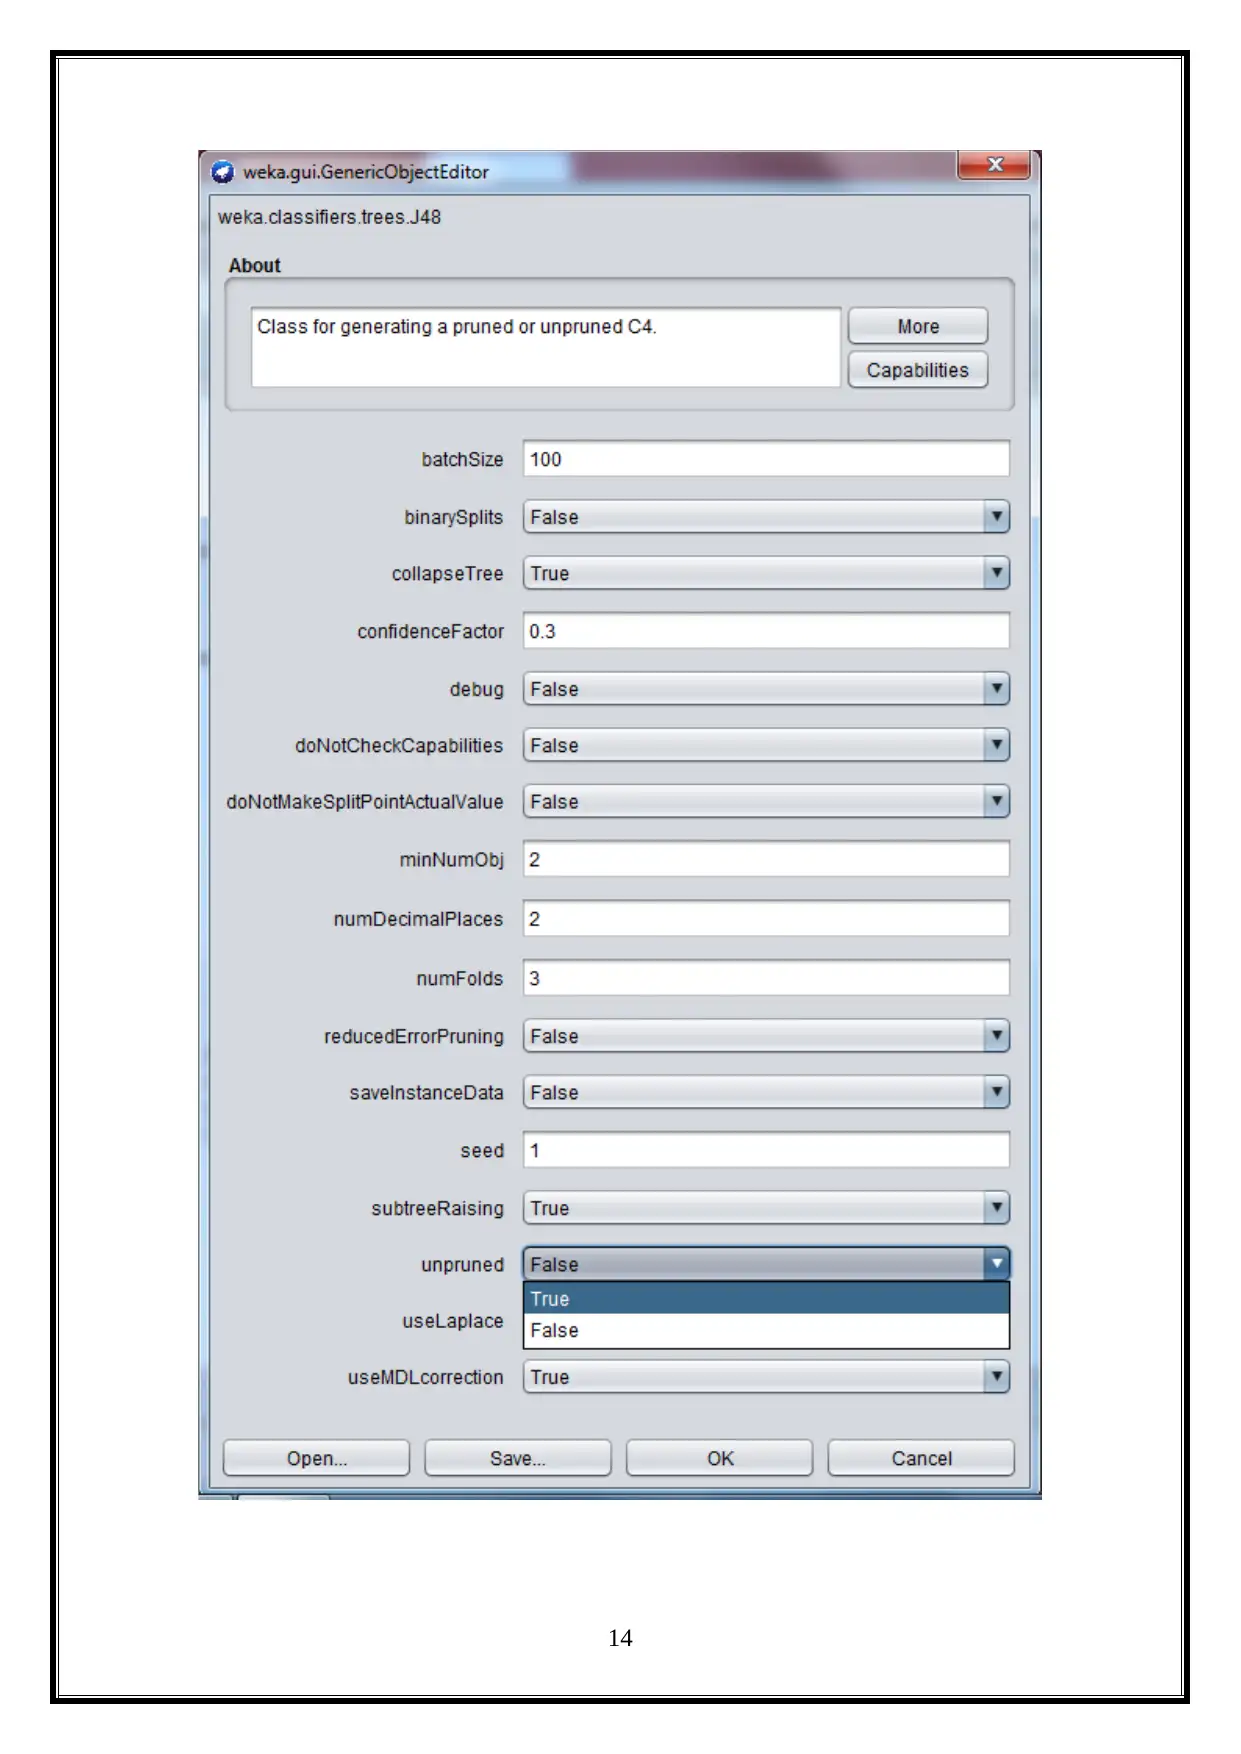
6 Task - 5
6.1 Set the parameter unpruned to TRUE
Here, the unpruned is set as true, and it also cannot change the reduced error pruning
anymore. So, it also improves the accuracy rate of the decision tree algorithm. It is the
simplest and most reasonable strategy, in decision tree pruning. Generally, do not prune it.
The advantages of these steps provide direct computational complexity for the classification
model. It is shown below (Mitsa, 2010).
13
14
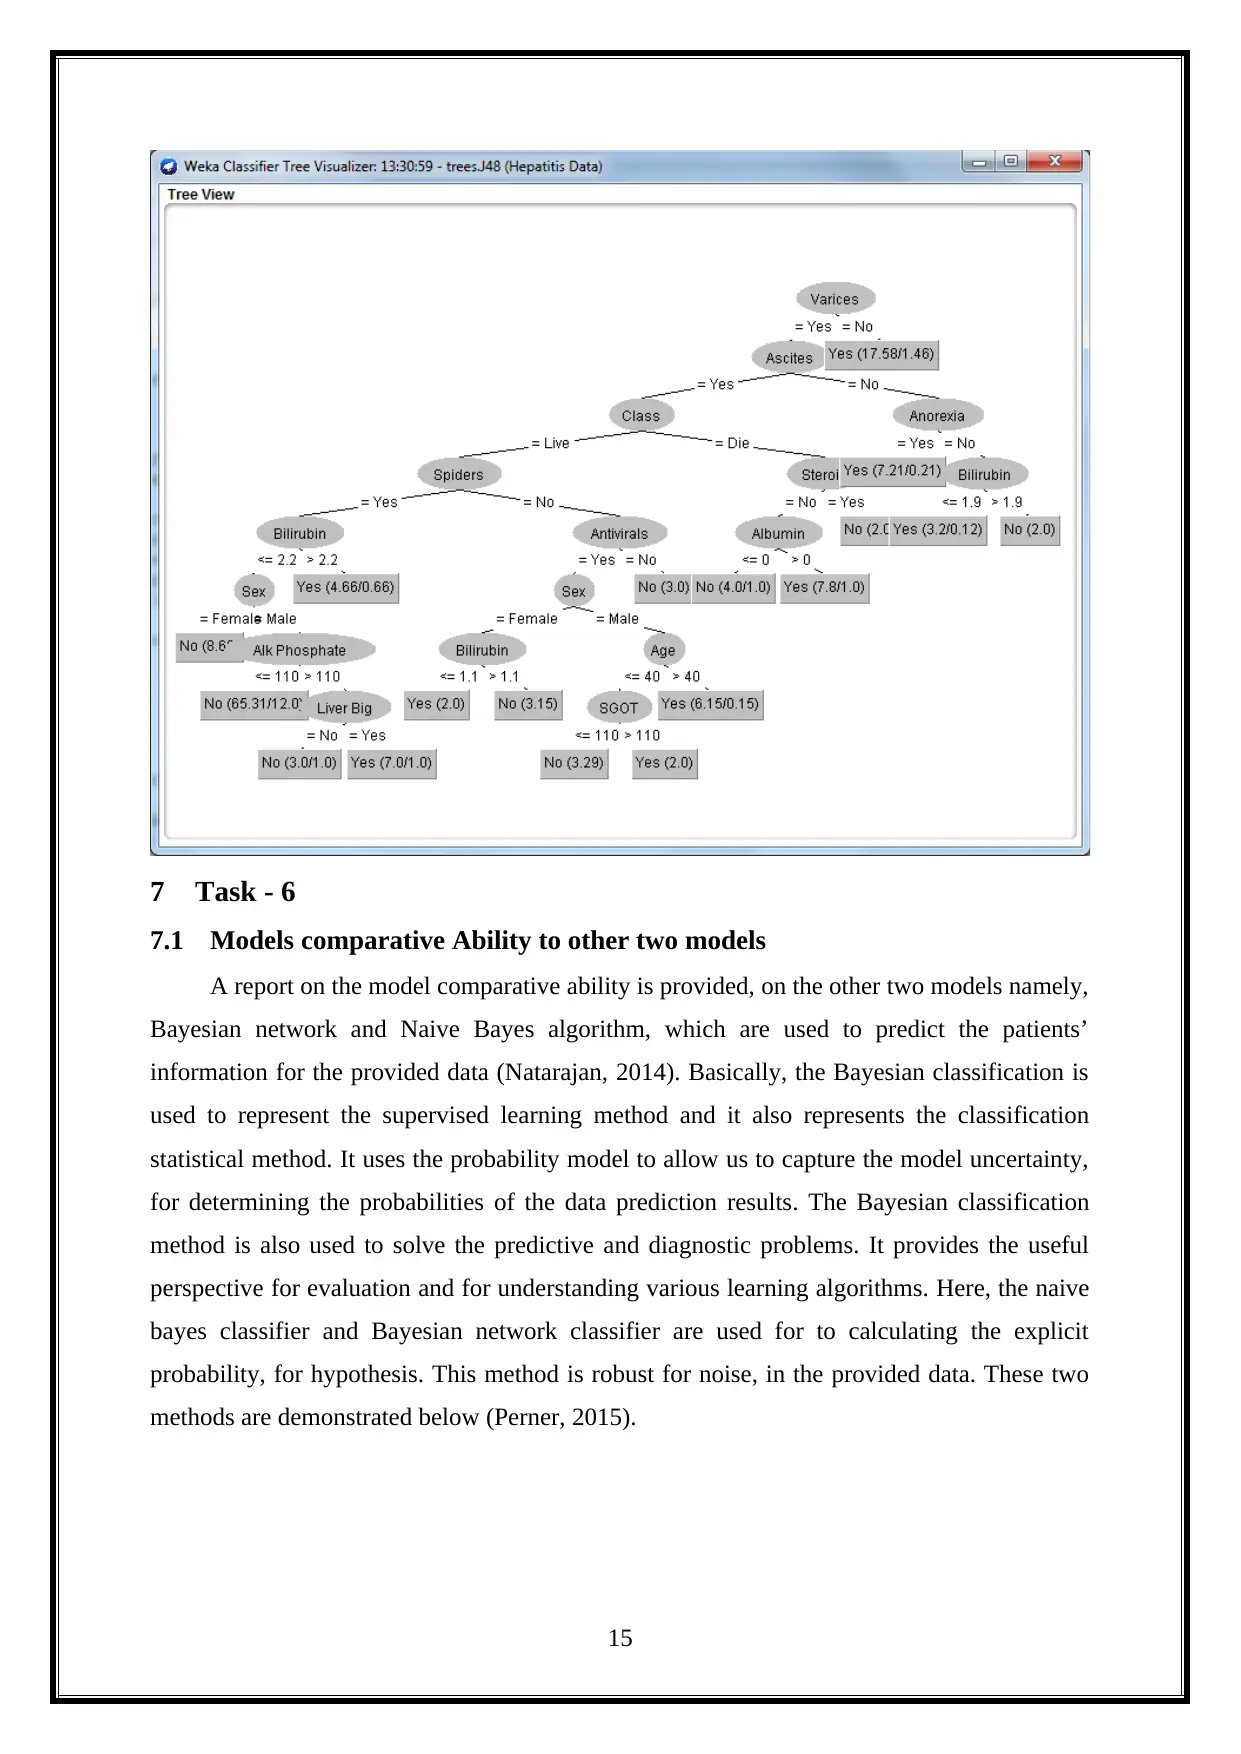
7 Task - 6
7.1 Models comparative Ability to other two models
A report on the model comparative ability is provided, on the other two models namely,
Bayesian network and Naive Bayes algorithm, which are used to predict the patients’
information for the provided data (Natarajan, 2014). Basically, the Bayesian classification is
used to represent the supervised learning method and it also represents the classification
statistical method. It uses the probability model to allow us to capture the model uncertainty,
for determining the probabilities of the data prediction results. The Bayesian classification
method is also used to solve the predictive and diagnostic problems. It provides the useful
perspective for evaluation and for understanding various learning algorithms. Here, the naive
bayes classifier and Bayesian network classifier are used for to calculating the explicit
probability, for hypothesis. This method is robust for noise, in the provided data. These two
methods are demonstrated below (Perner, 2015).
15
Secure Best Marks with AI Grader
Need help grading? Try our AI Grader for instant feedback on your assignments.
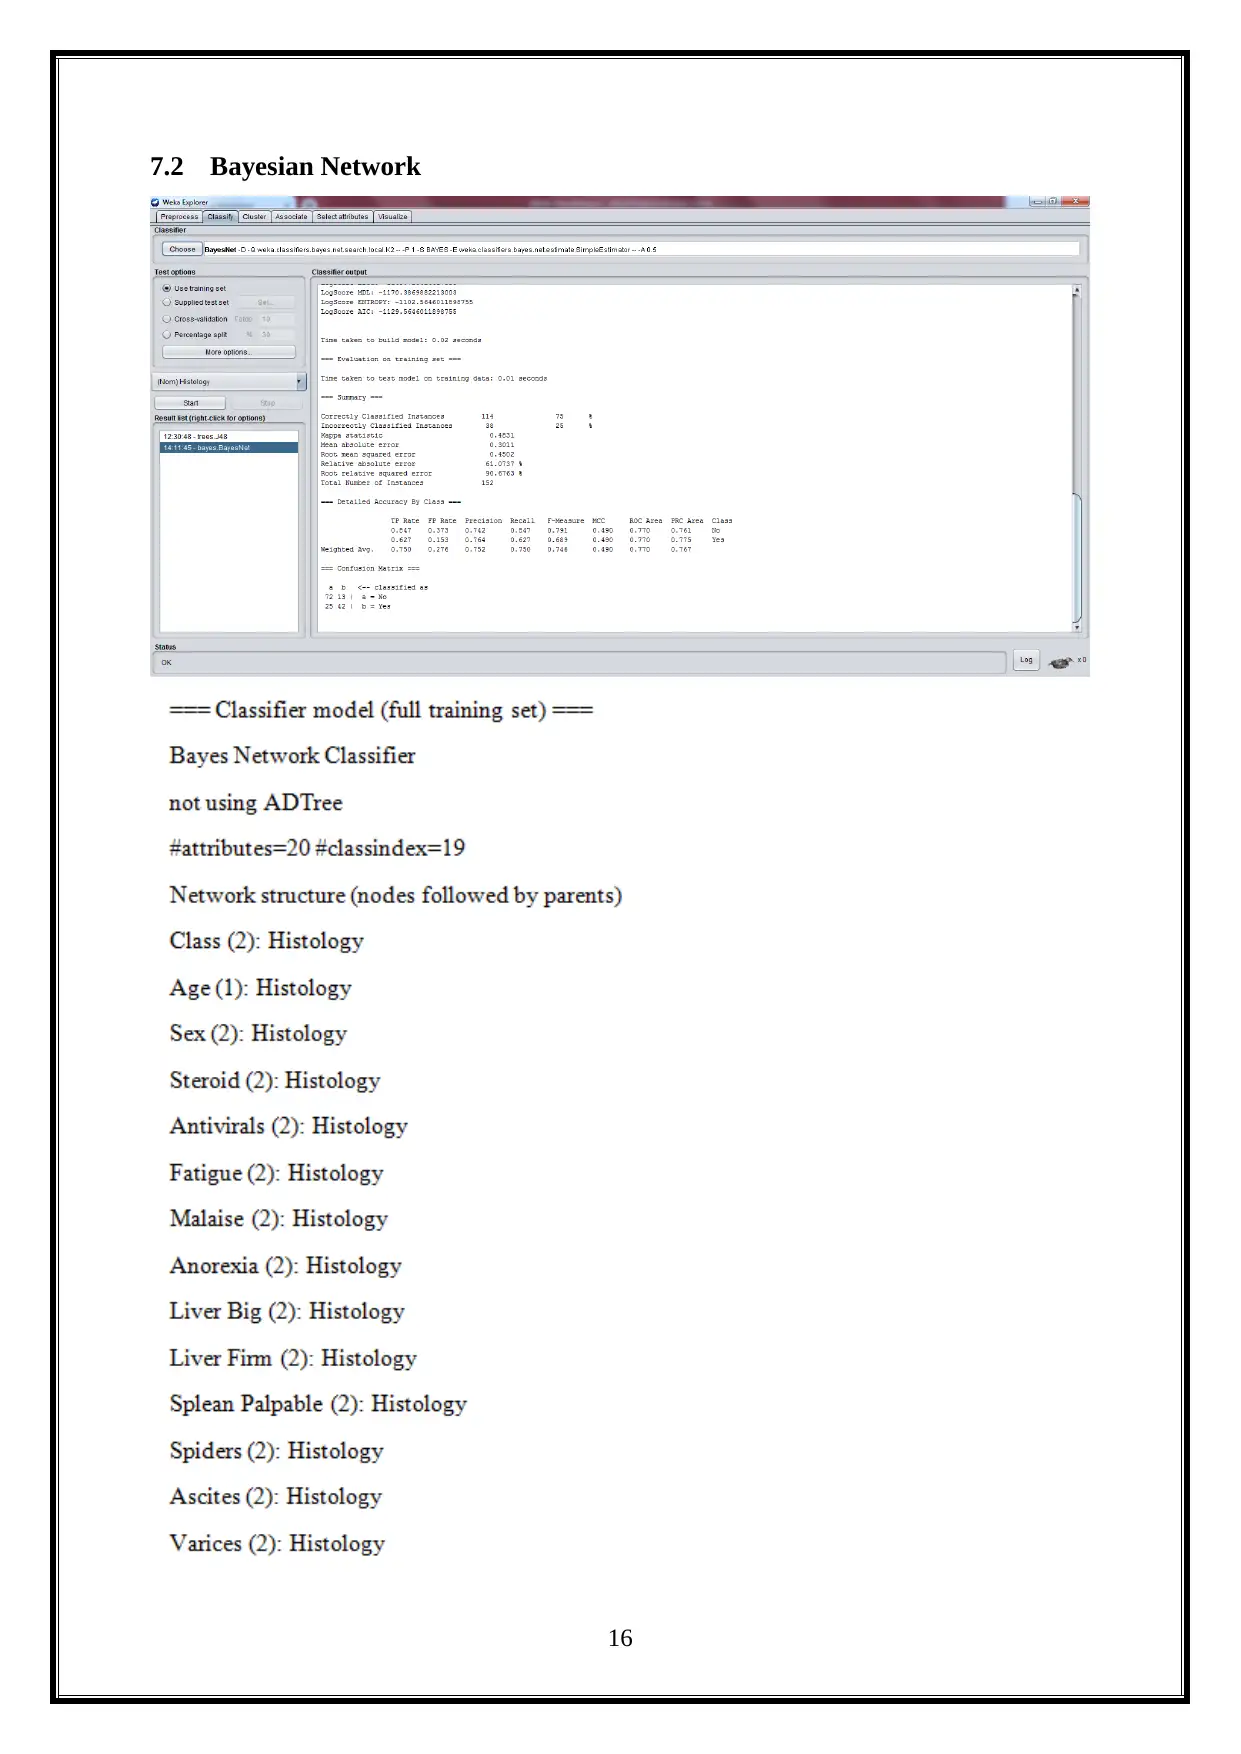
7.2 Bayesian Network
16
16
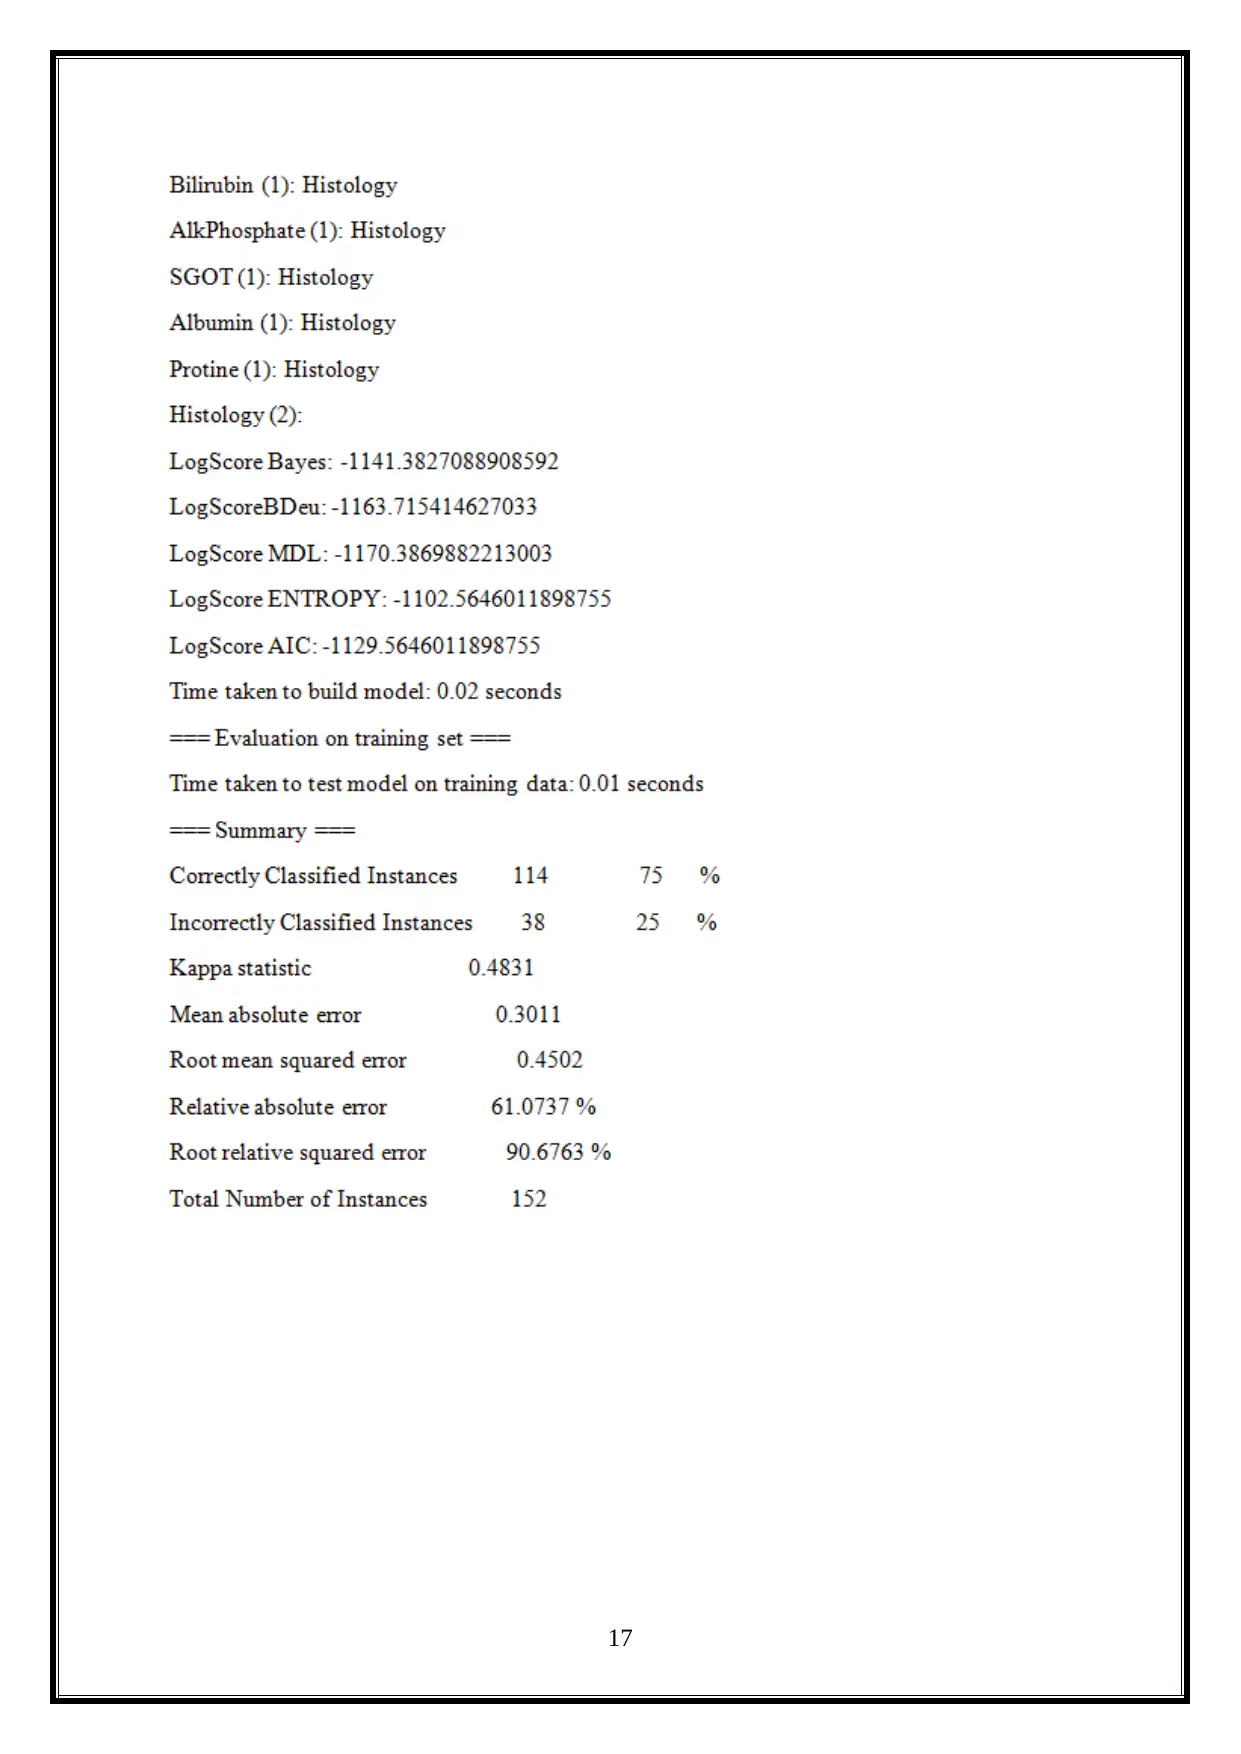
17
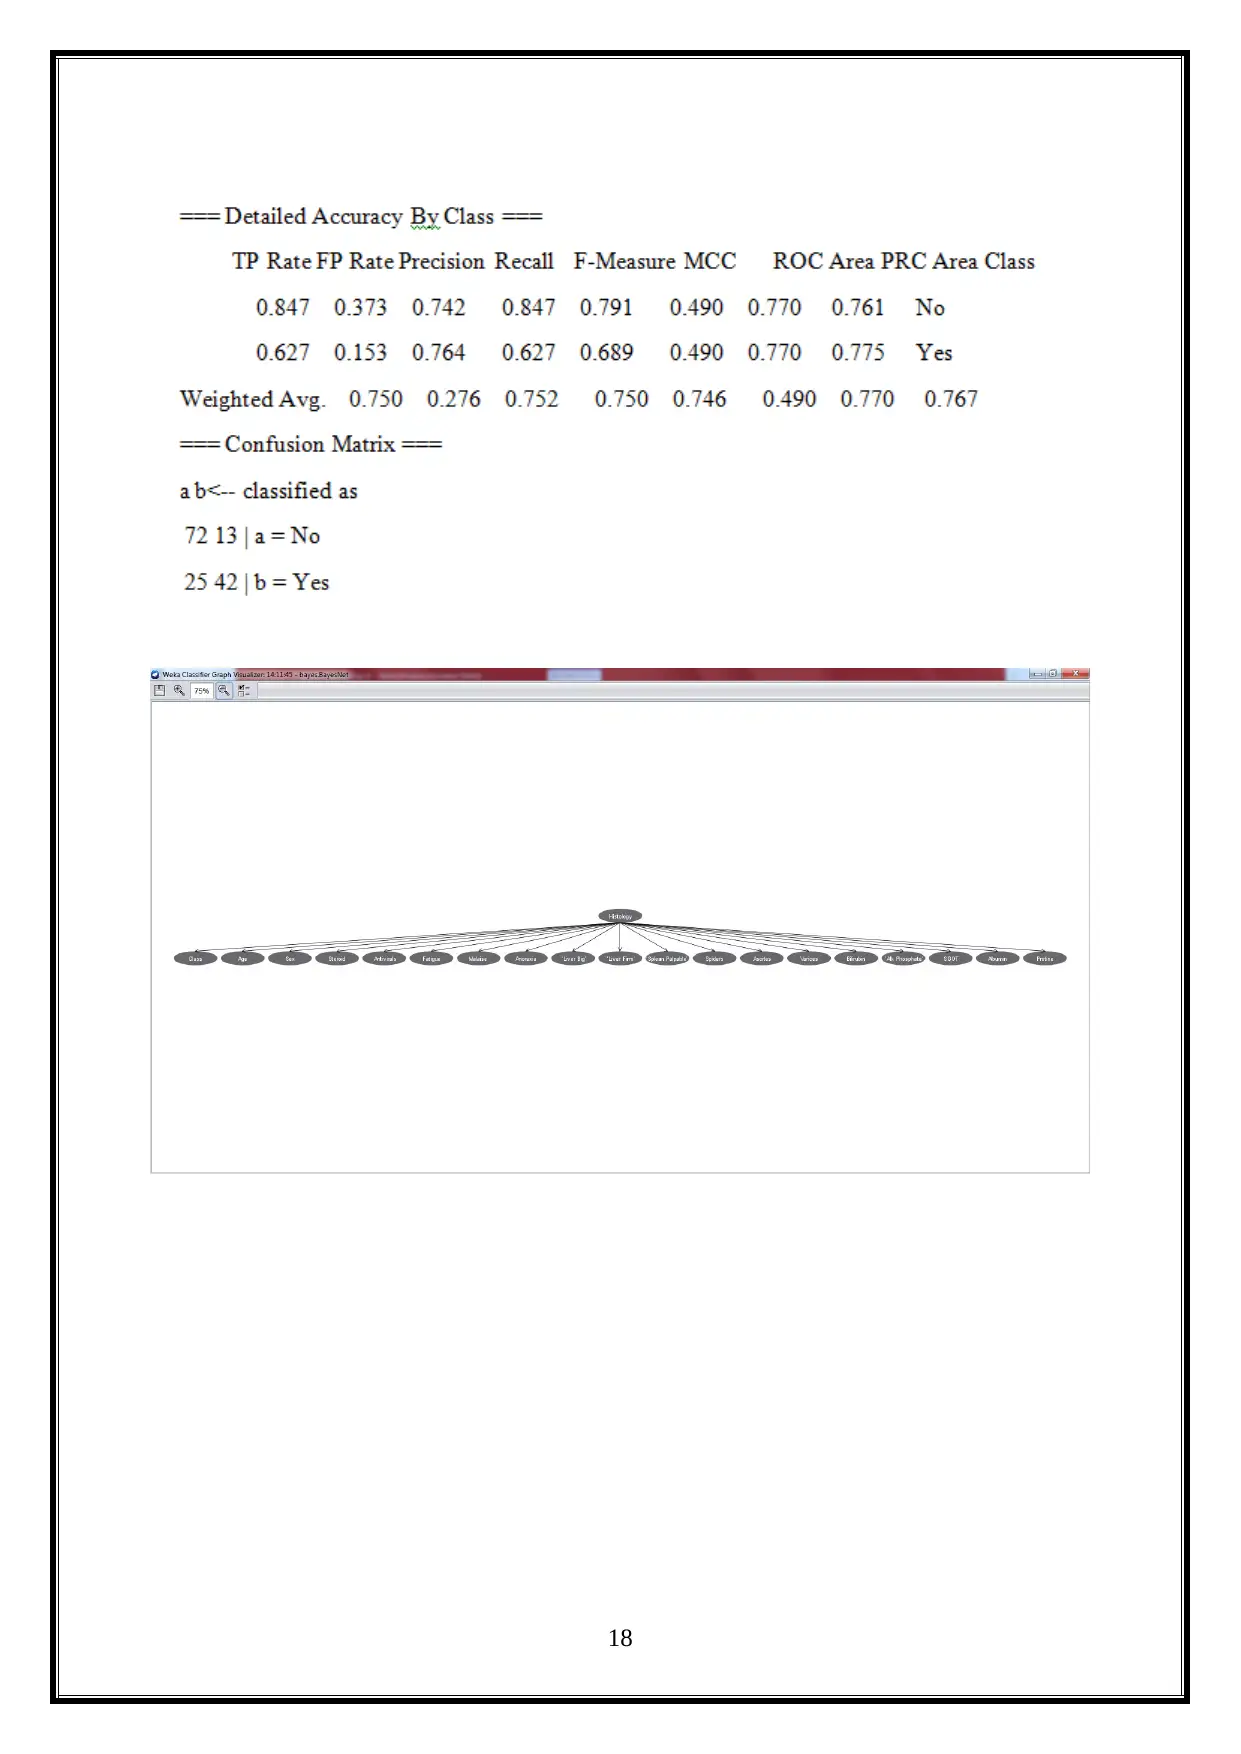
18
Paraphrase This Document
Need a fresh take? Get an instant paraphrase of this document with our AI Paraphraser
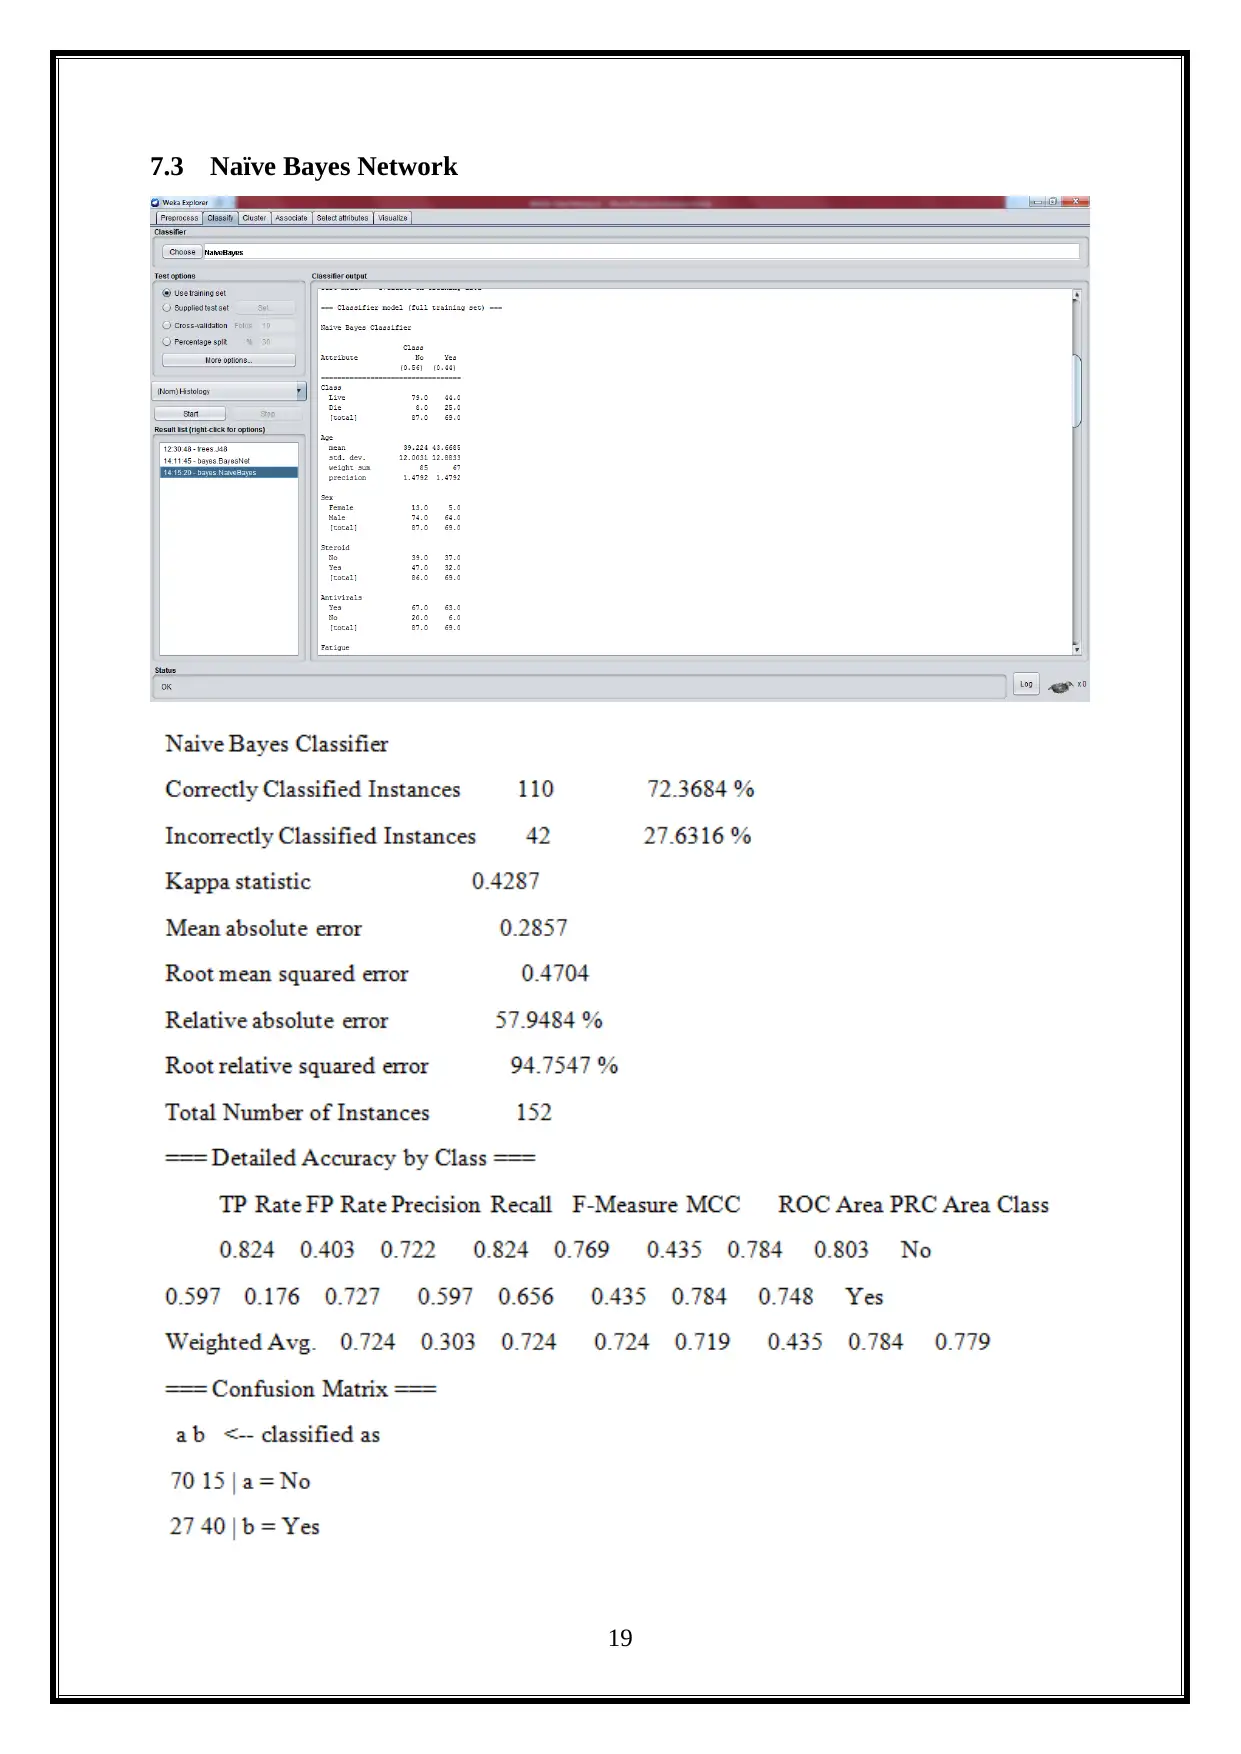
7.3 Naïve Bayes Network
19
19
By comparing the two Bayesian classification models like, naive bayes and Bayesian
network, the naive bayes network is successfully predicts the patient information, from the
provided data. It displays the similar ways of assessing the statistical significance and
effectiveness of classification models. It provides below statistical signification for the
provided data.
Correctly Classified Instances - 110 72.3684 %
Incorrectly Classified Instances -42 27.6316 %
And the confusion matrix is illustrated below.
=== Confusion Matrix ===
a b Classified as
70 15 a = No
b = Yes27 40
In Bayesian Network, it also provides the statistical significance and the value of
classification models. It is shown below.
Correctly Classified Instances - 115 75 %
Incorrectly Classified Instances - 38 25%
The confusion matrix is illustrated below.
=== Confusion Matrix ===
a b Classified as
72 13 a = No
b = Yes25 42
By comparing the two models, the naive bayes method is used to have effectiveness of
classification model, to predict the patient information about the patients’ who are affected by
Hepatitis disease. It provides the real statistical significance and became much stronger. It
also gives the probabilistic outputs for the provided data (Witten, Frank, Hall & Pal, 2017).
8 Task - 7
8.1 Confusion Matrix
For Bayesian Network,
=== Confusion Matrix ===
20
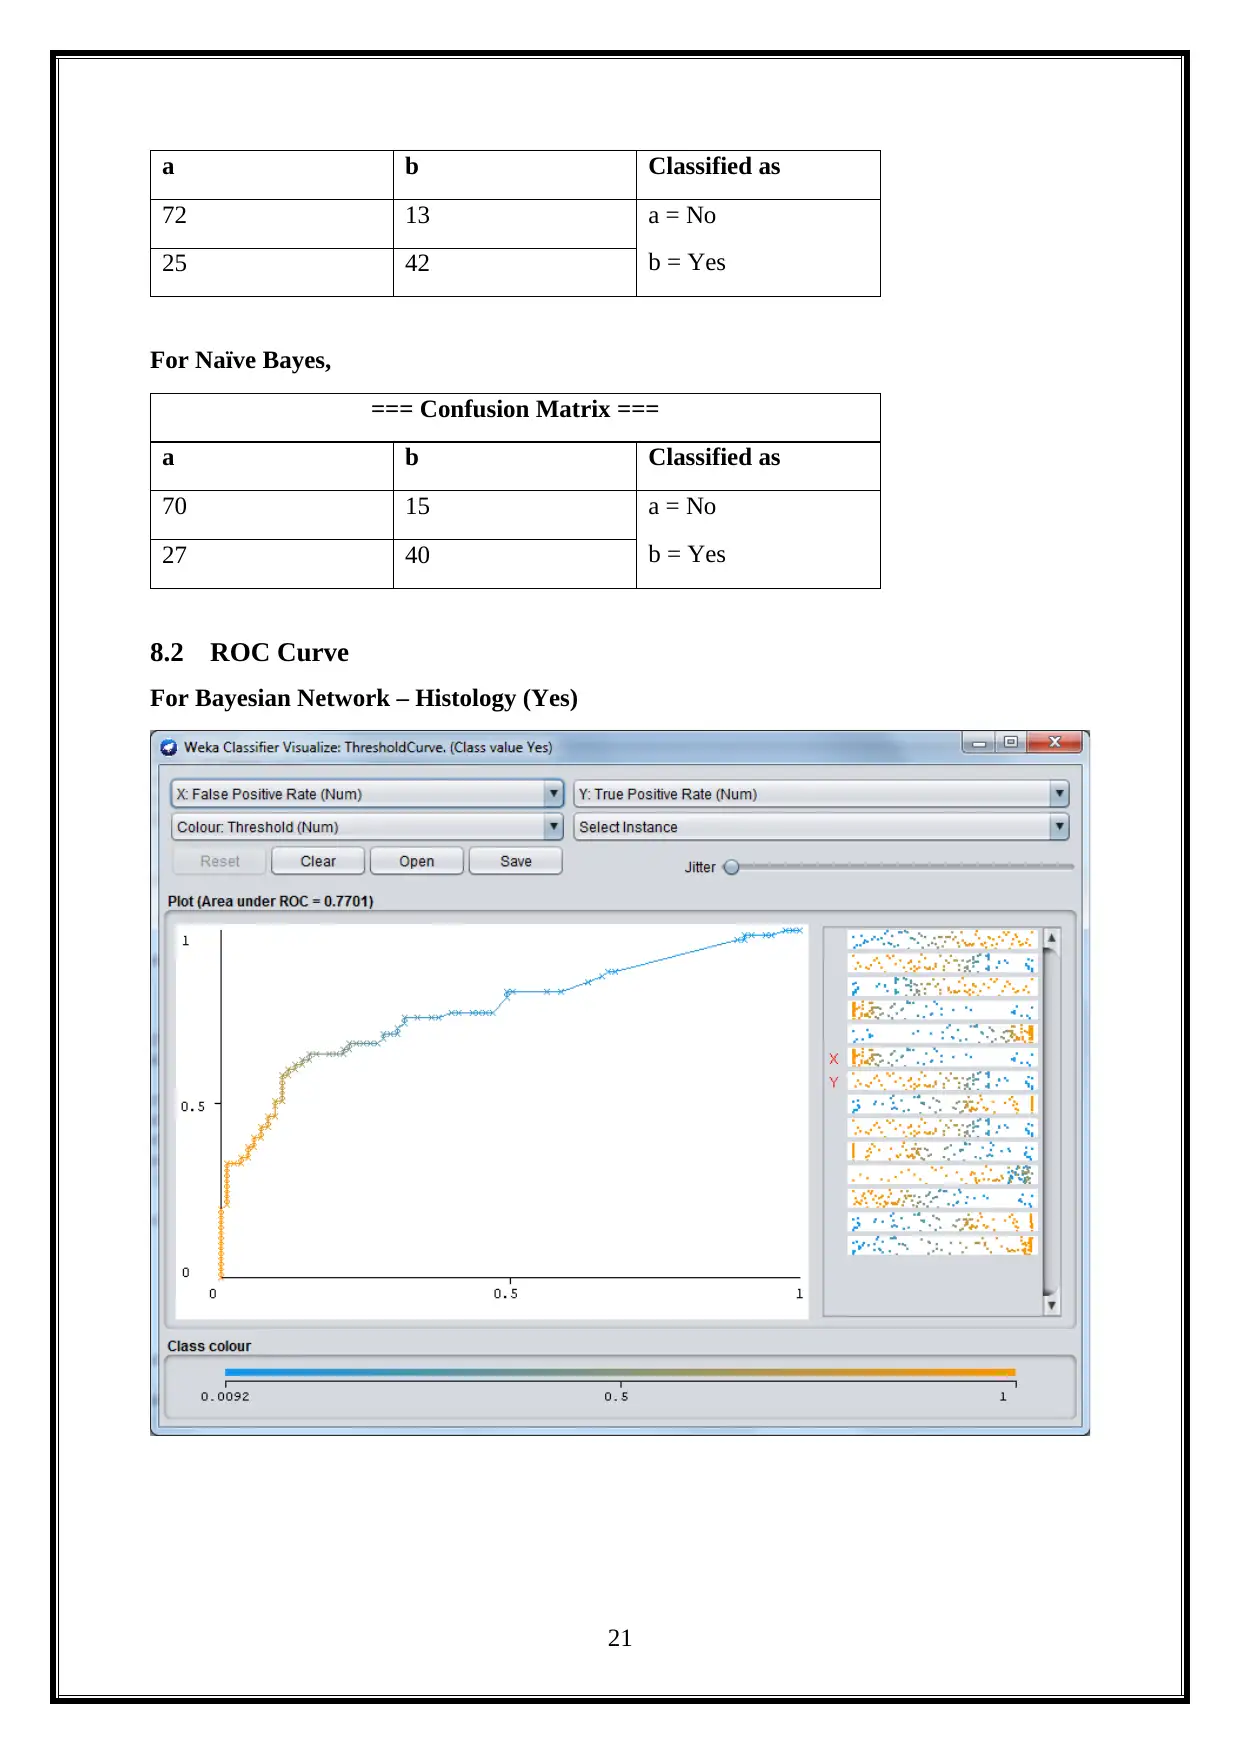
a b Classified as
72 13 a = No
b = Yes25 42
For Naïve Bayes,
=== Confusion Matrix ===
a b Classified as
70 15 a = No
b = Yes27 40
8.2 ROC Curve
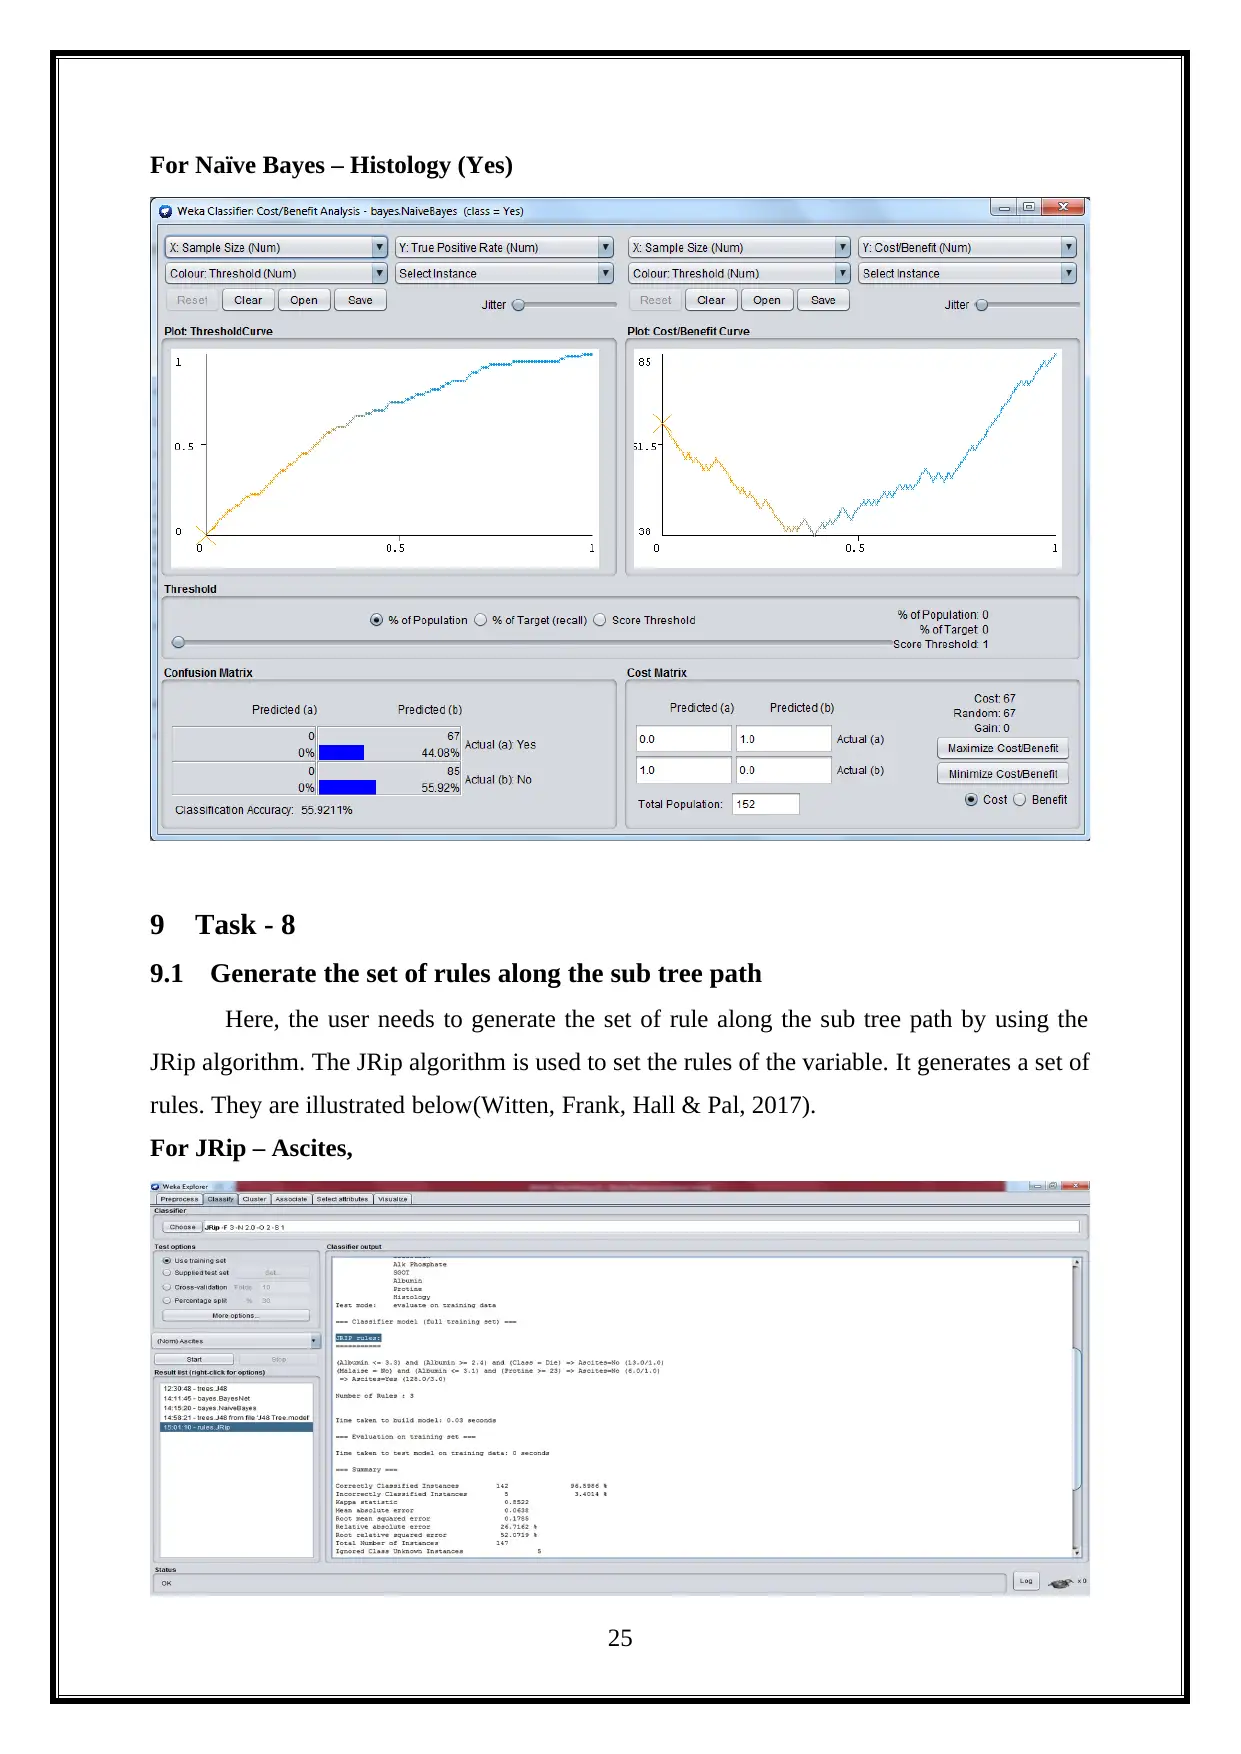
For Bayesian Network – Histology (Yes)
21
72 13 a = No
b = Yes25 42
For Naïve Bayes,
=== Confusion Matrix ===
a b Classified as
70 15 a = No
b = Yes27 40
8.2 ROC Curve
For Bayesian Network – Histology (Yes)
21
Secure Best Marks with AI Grader
Need help grading? Try our AI Grader for instant feedback on your assignments.
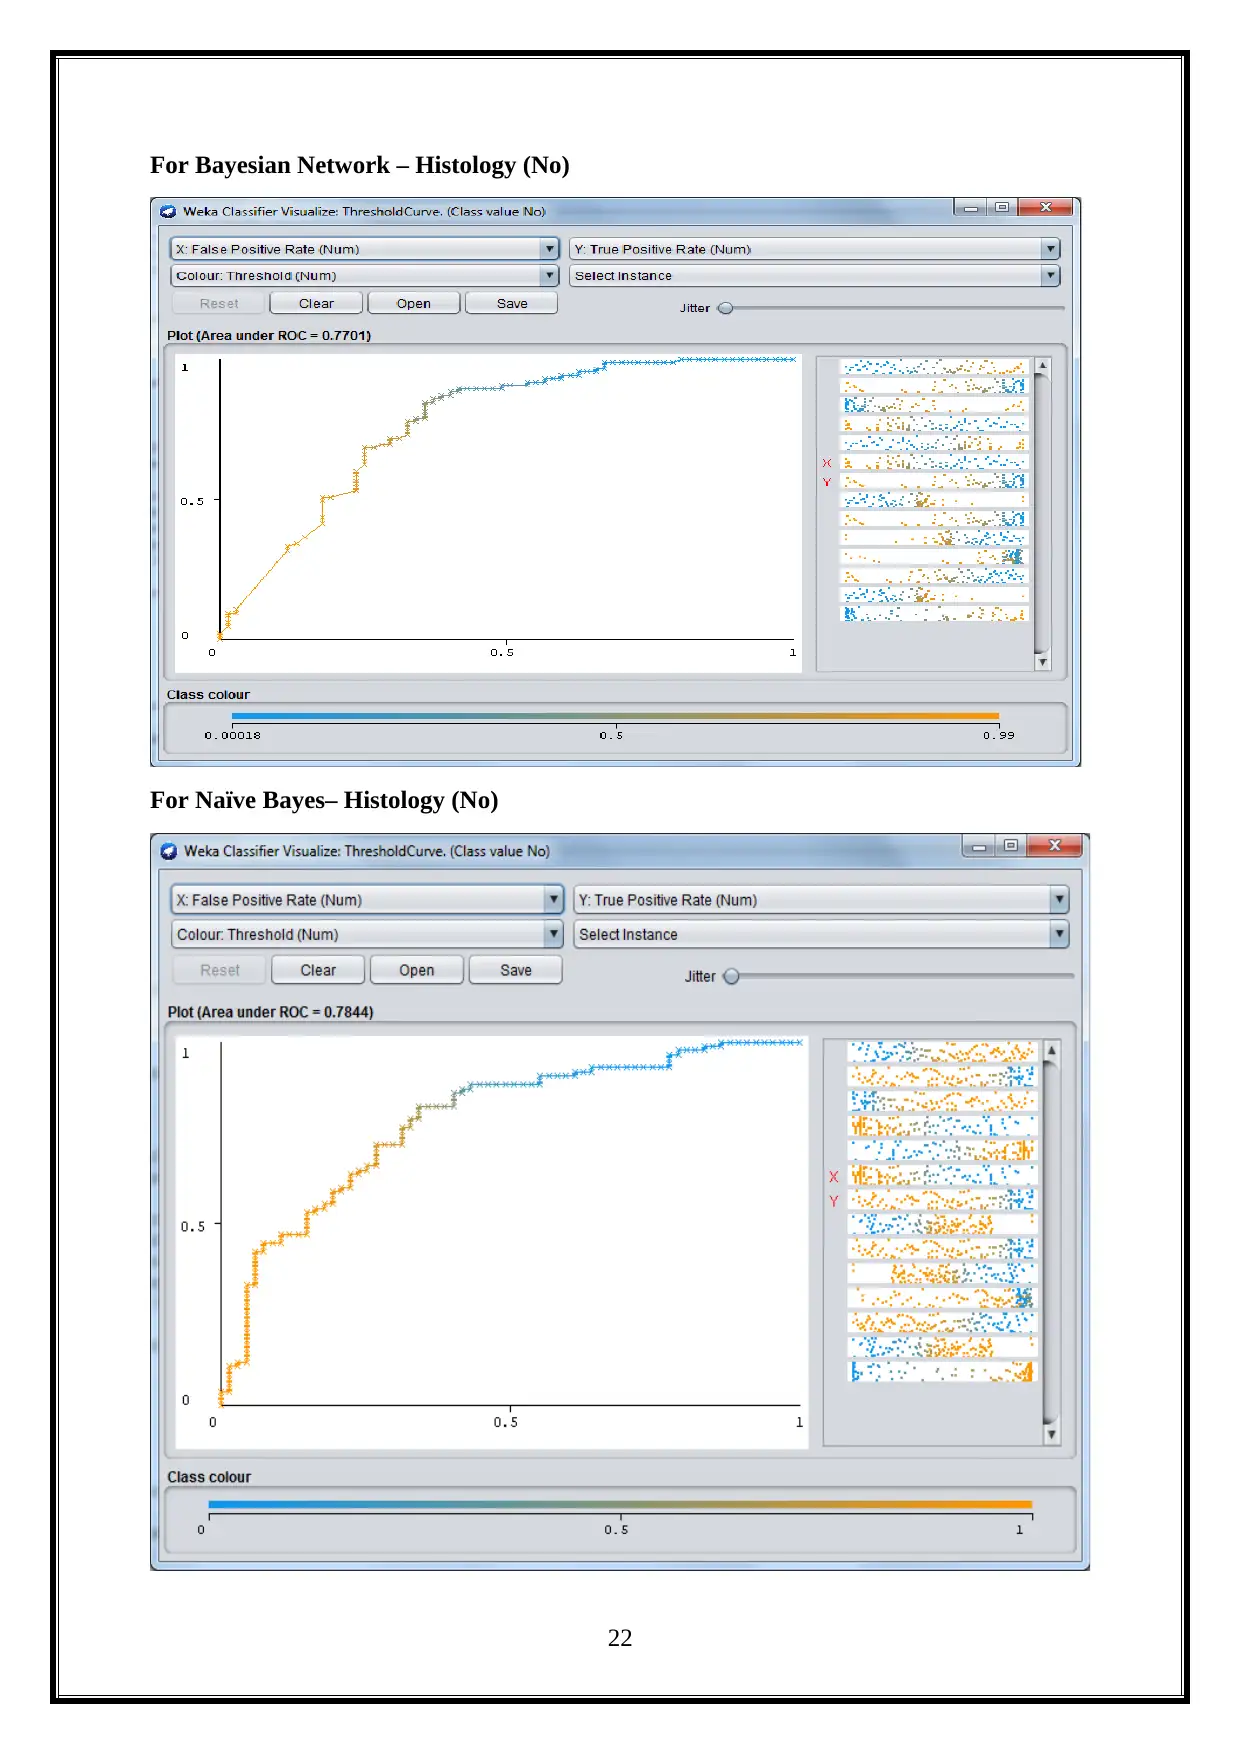
For Bayesian Network – Histology (No)
For Naïve Bayes– Histology (No)
22
For Naïve Bayes– Histology (No)
22
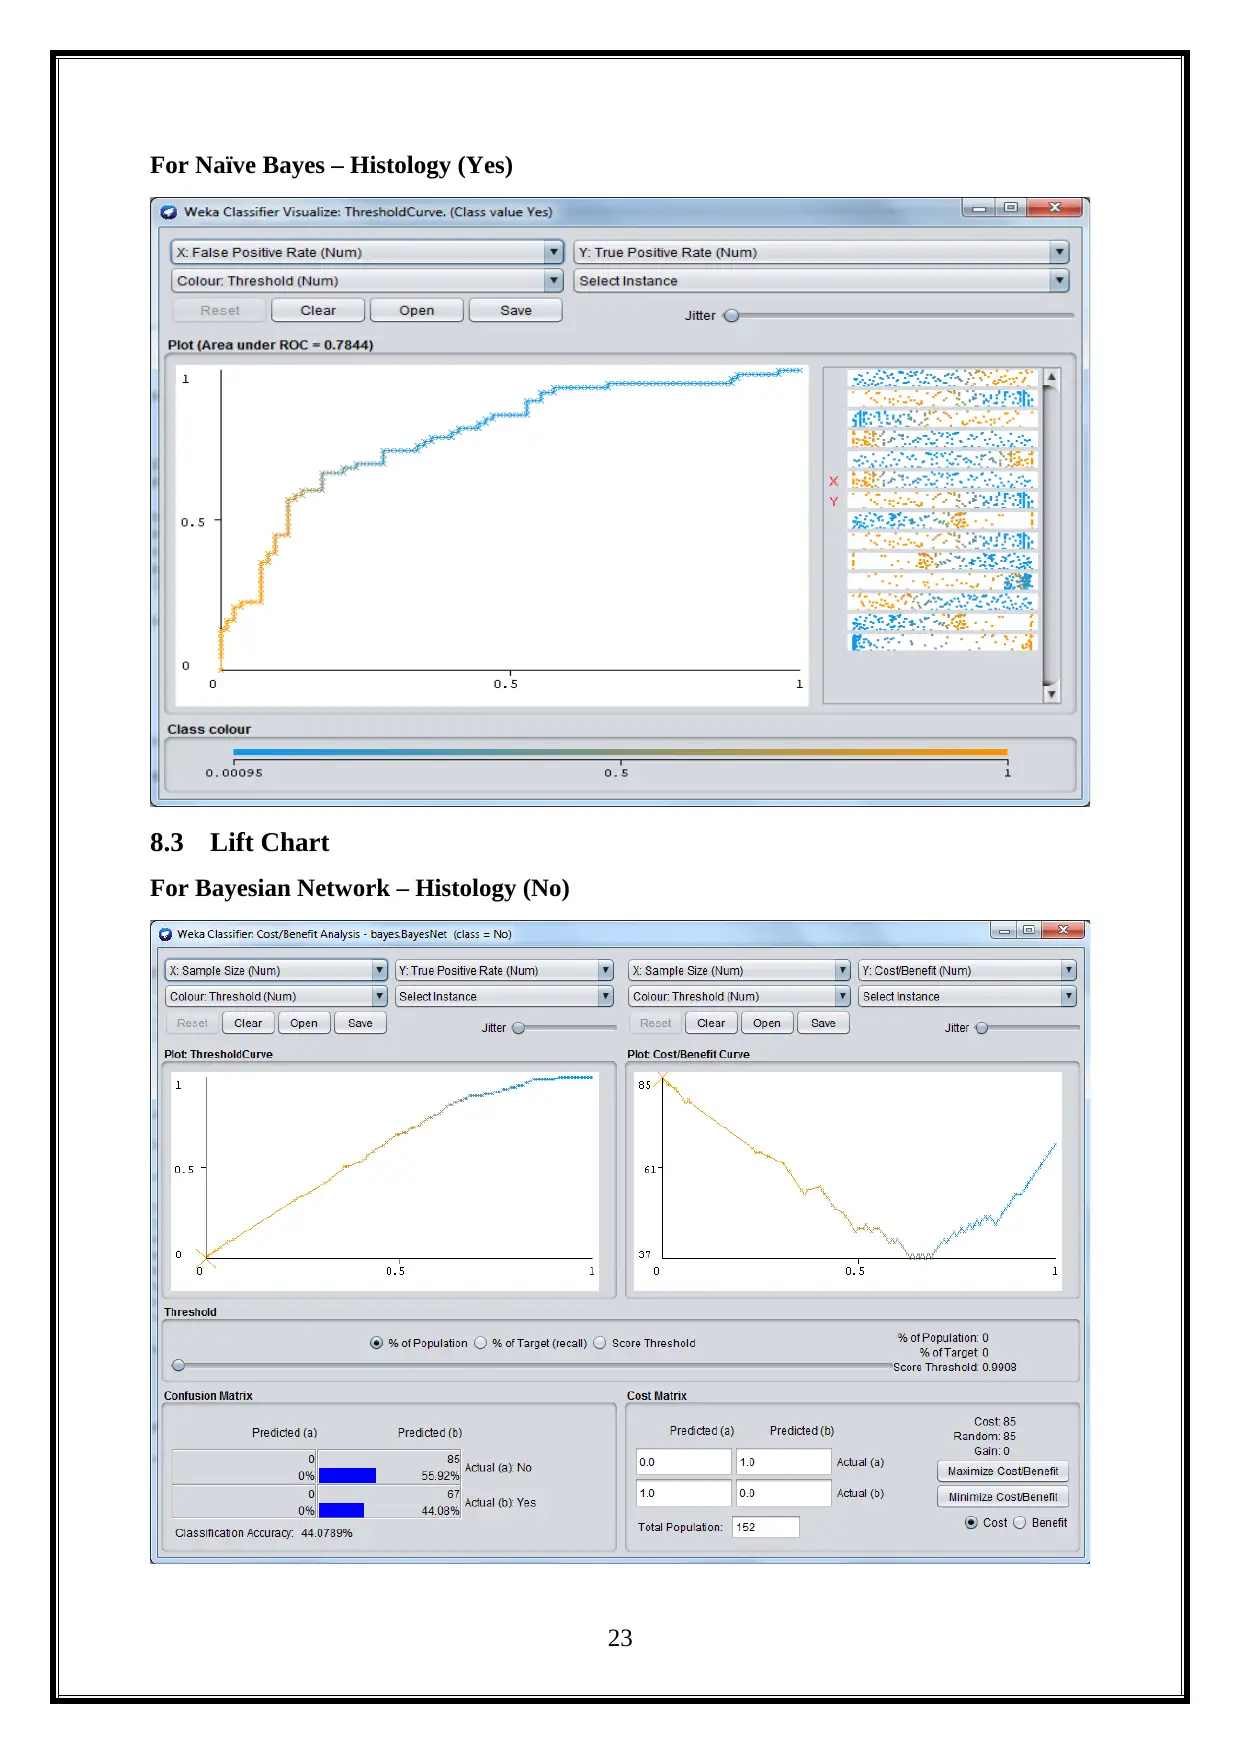
For Naïve Bayes – Histology (Yes)
8.3 Lift Chart
For Bayesian Network – Histology (No)
23
8.3 Lift Chart
For Bayesian Network – Histology (No)
23
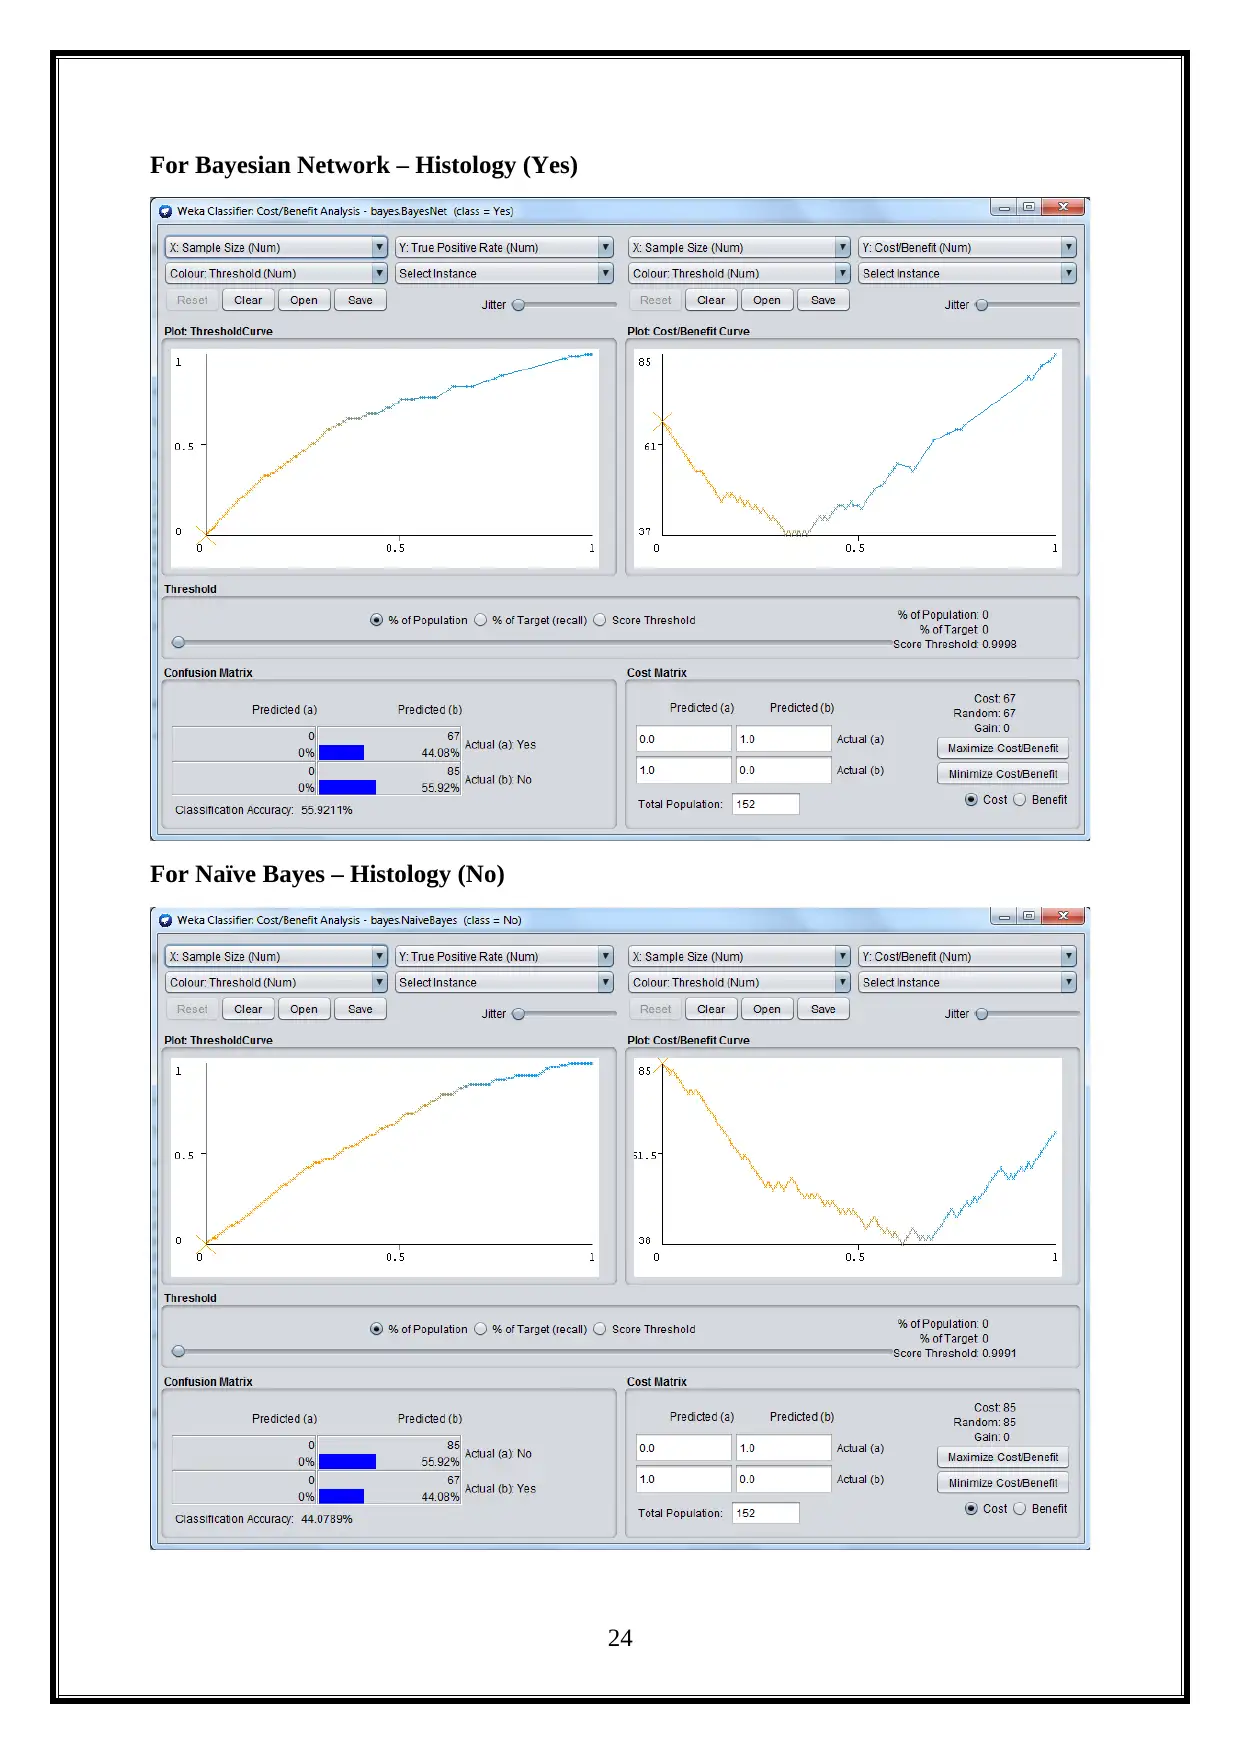
For Bayesian Network – Histology (Yes)
For Naïve Bayes – Histology (No)
24
For Naïve Bayes – Histology (No)
24
Paraphrase This Document
Need a fresh take? Get an instant paraphrase of this document with our AI Paraphraser
For Naïve Bayes – Histology (Yes)
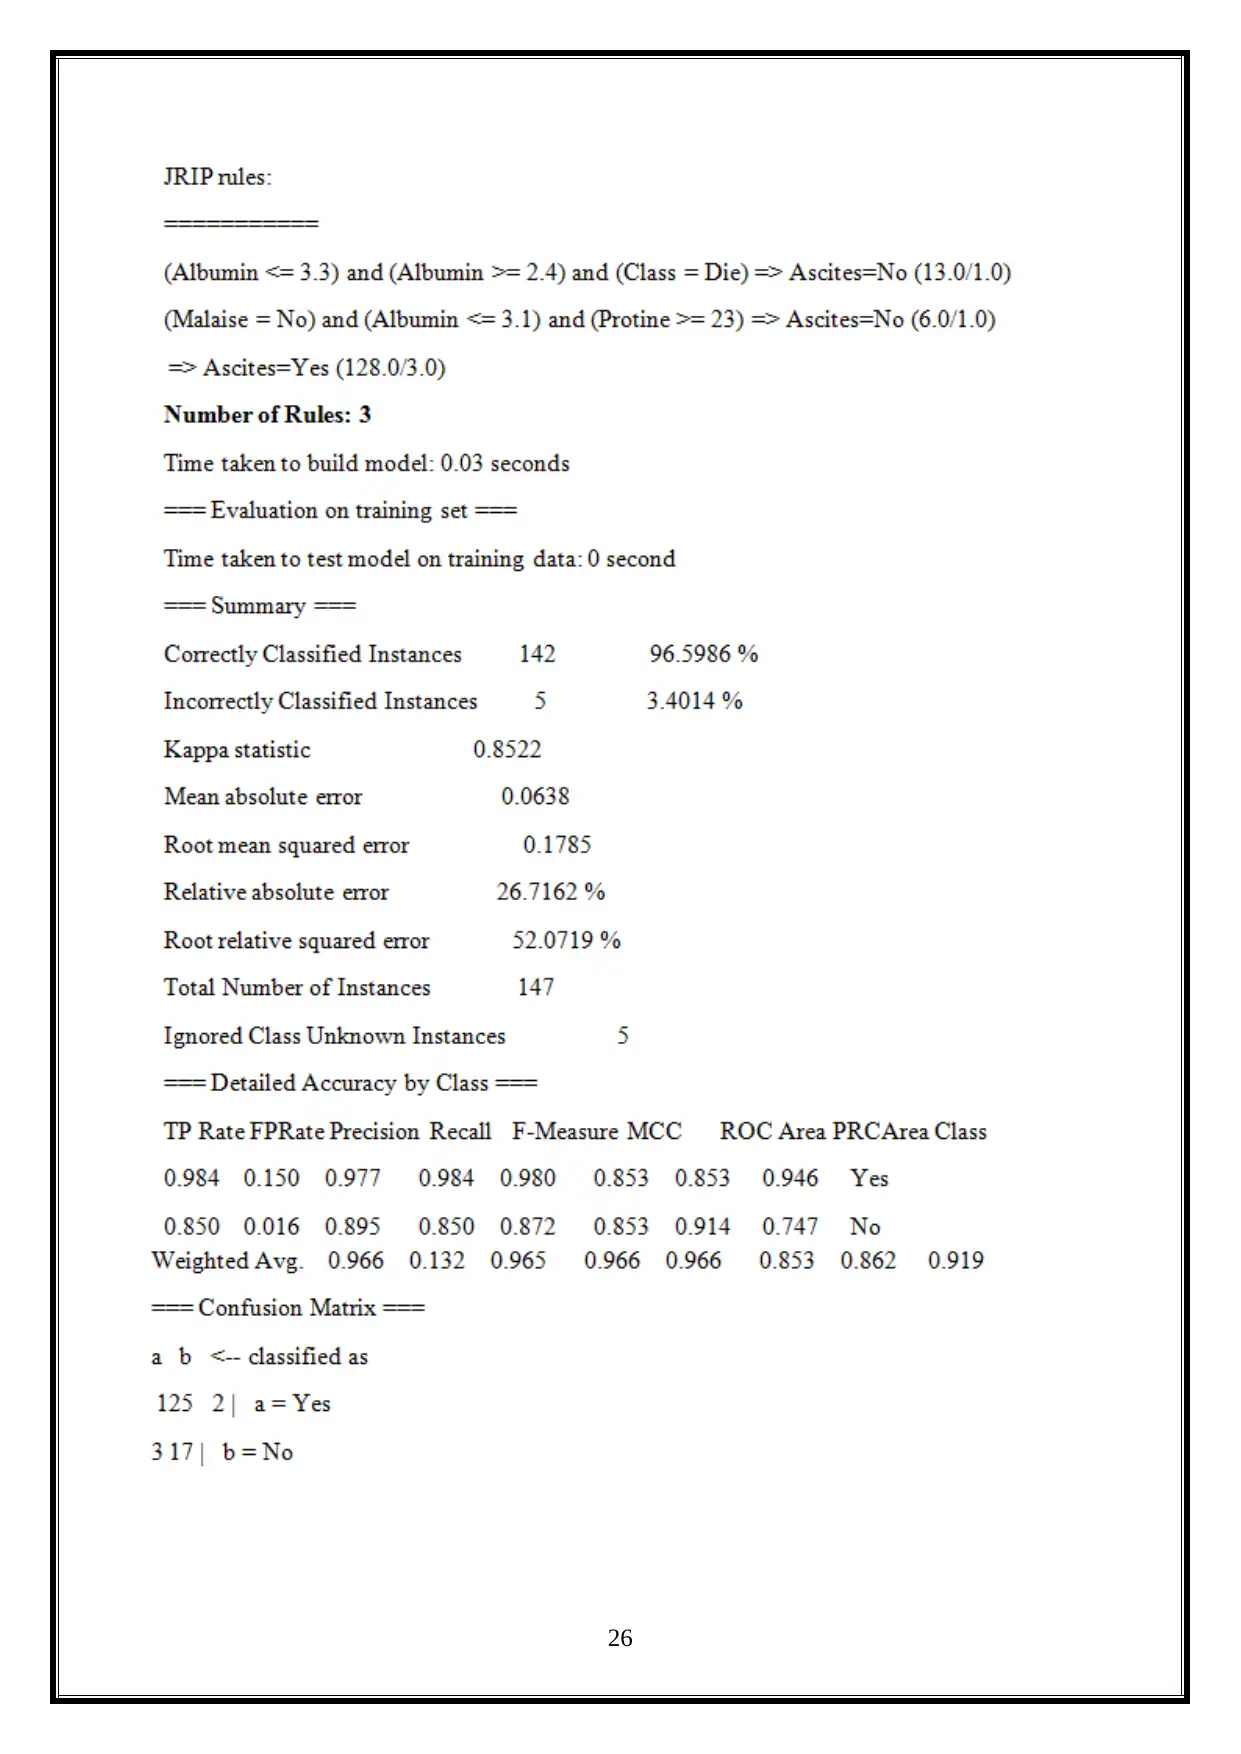
9 Task - 8
9.1 Generate the set of rules along the sub tree path
Here, the user needs to generate the set of rule along the sub tree path by using the
JRip algorithm. The JRip algorithm is used to set the rules of the variable. It generates a set of
rules. They are illustrated below(Witten, Frank, Hall & Pal, 2017).
For JRip – Ascites,
25
26
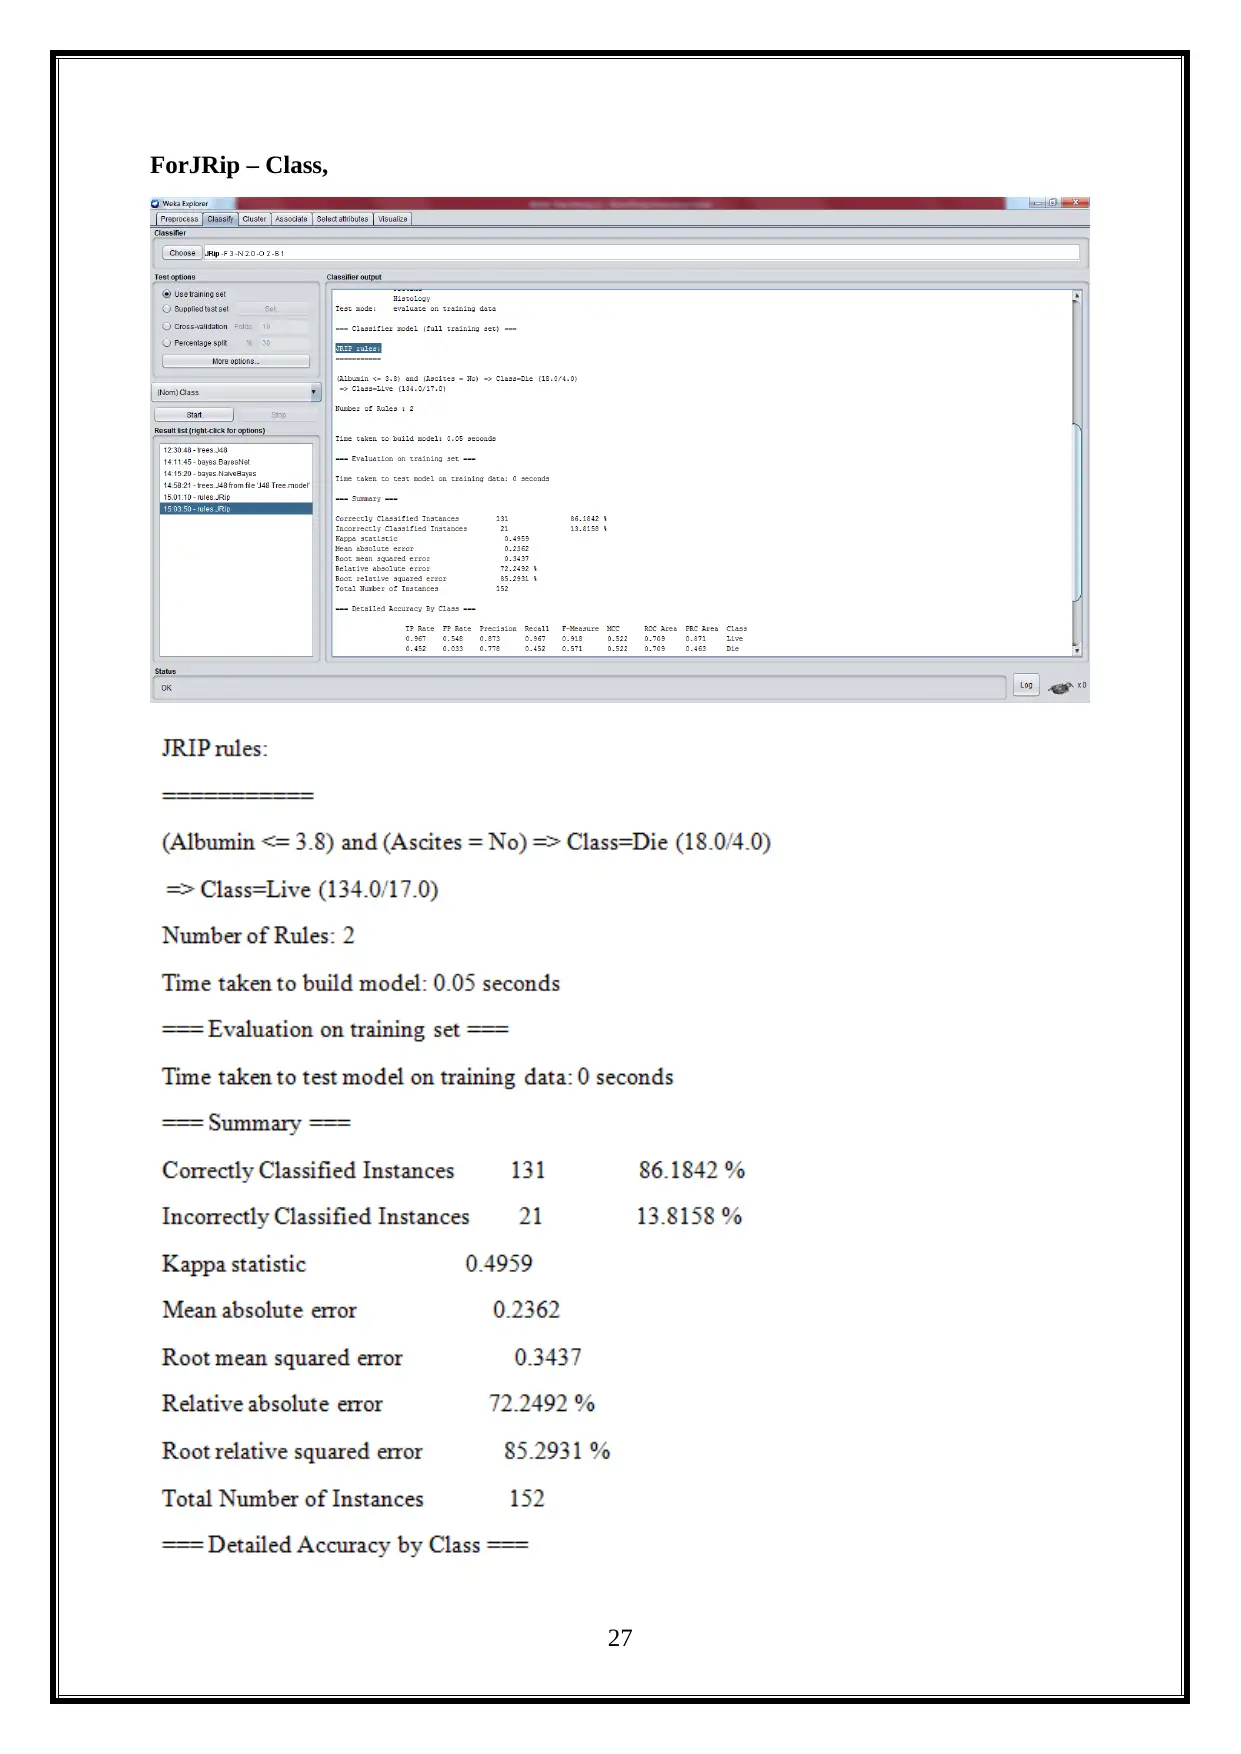
ForJRip – Class,
27
27
Secure Best Marks with AI Grader
Need help grading? Try our AI Grader for instant feedback on your assignments.
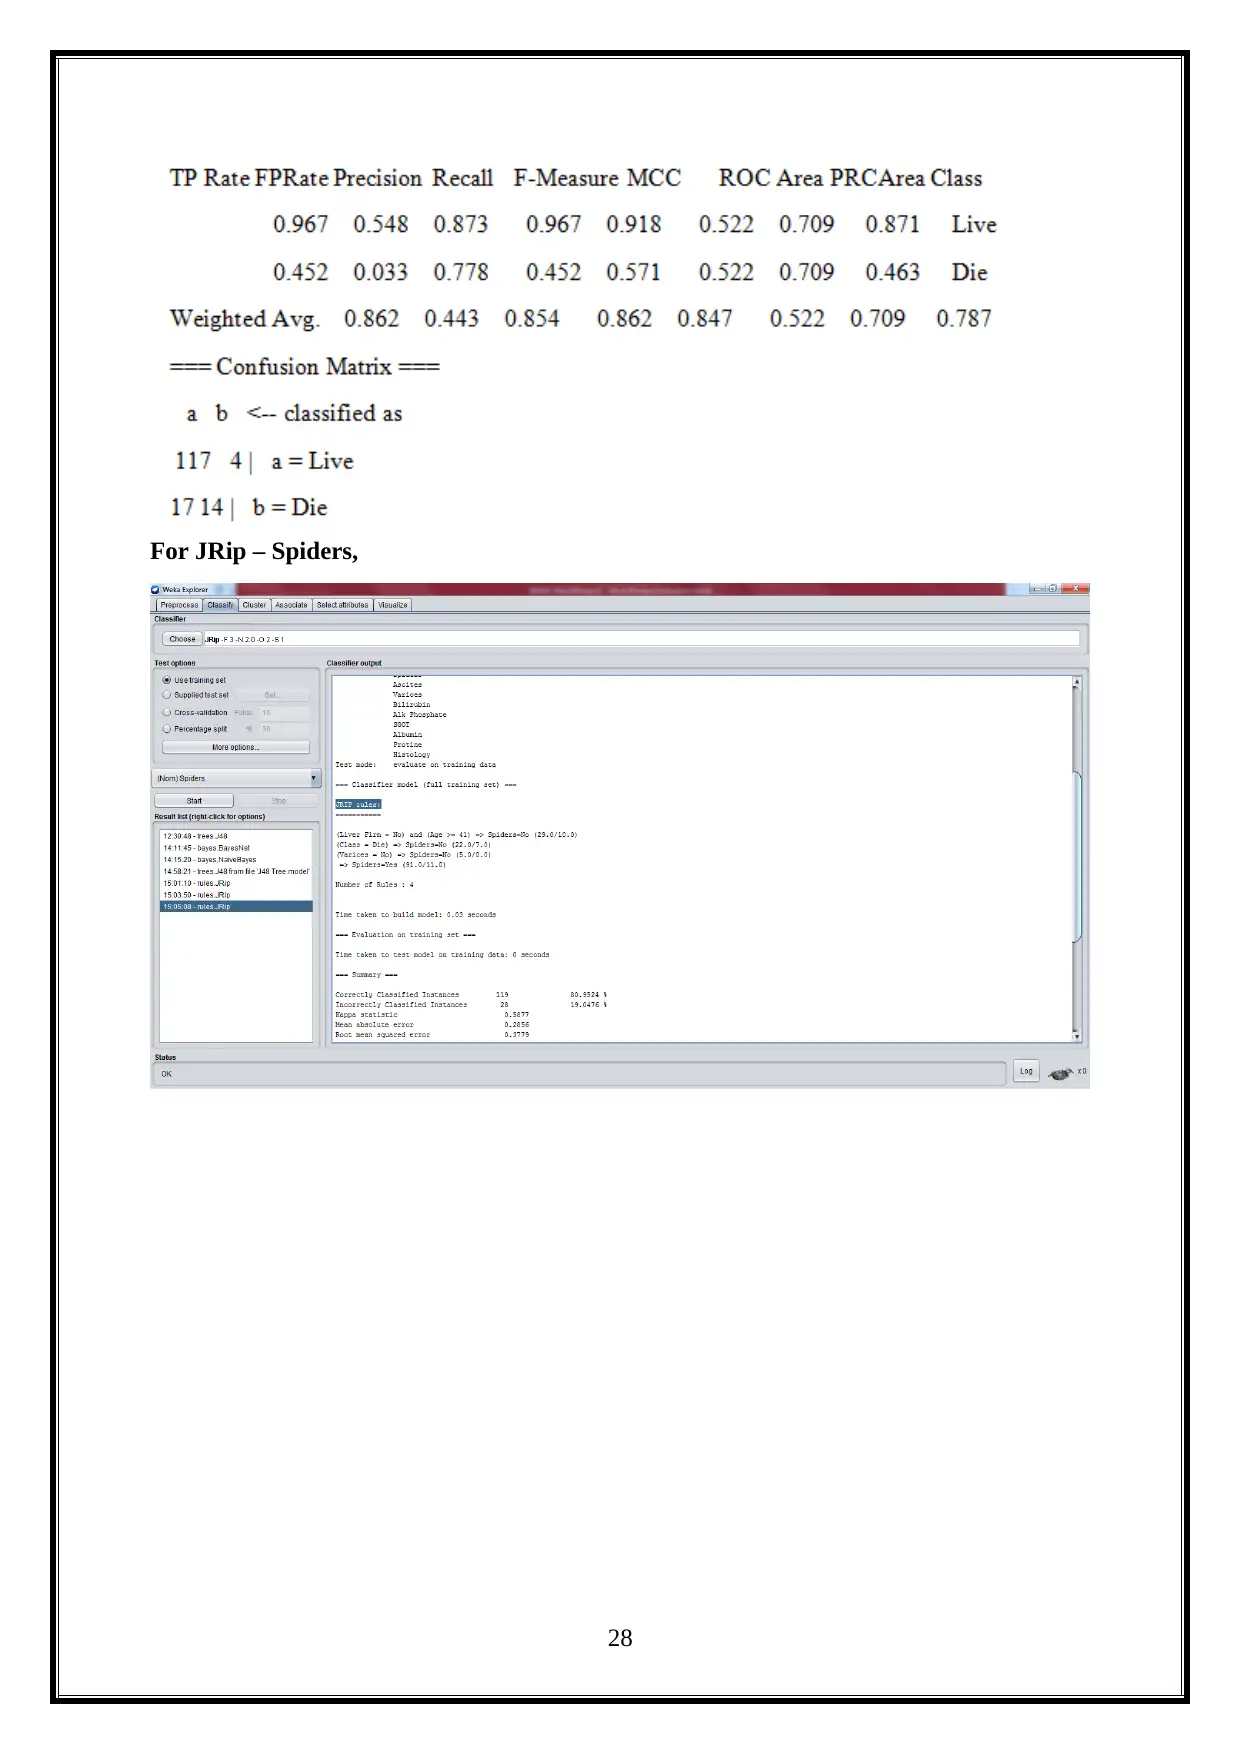
For JRip – Spiders,
28
28
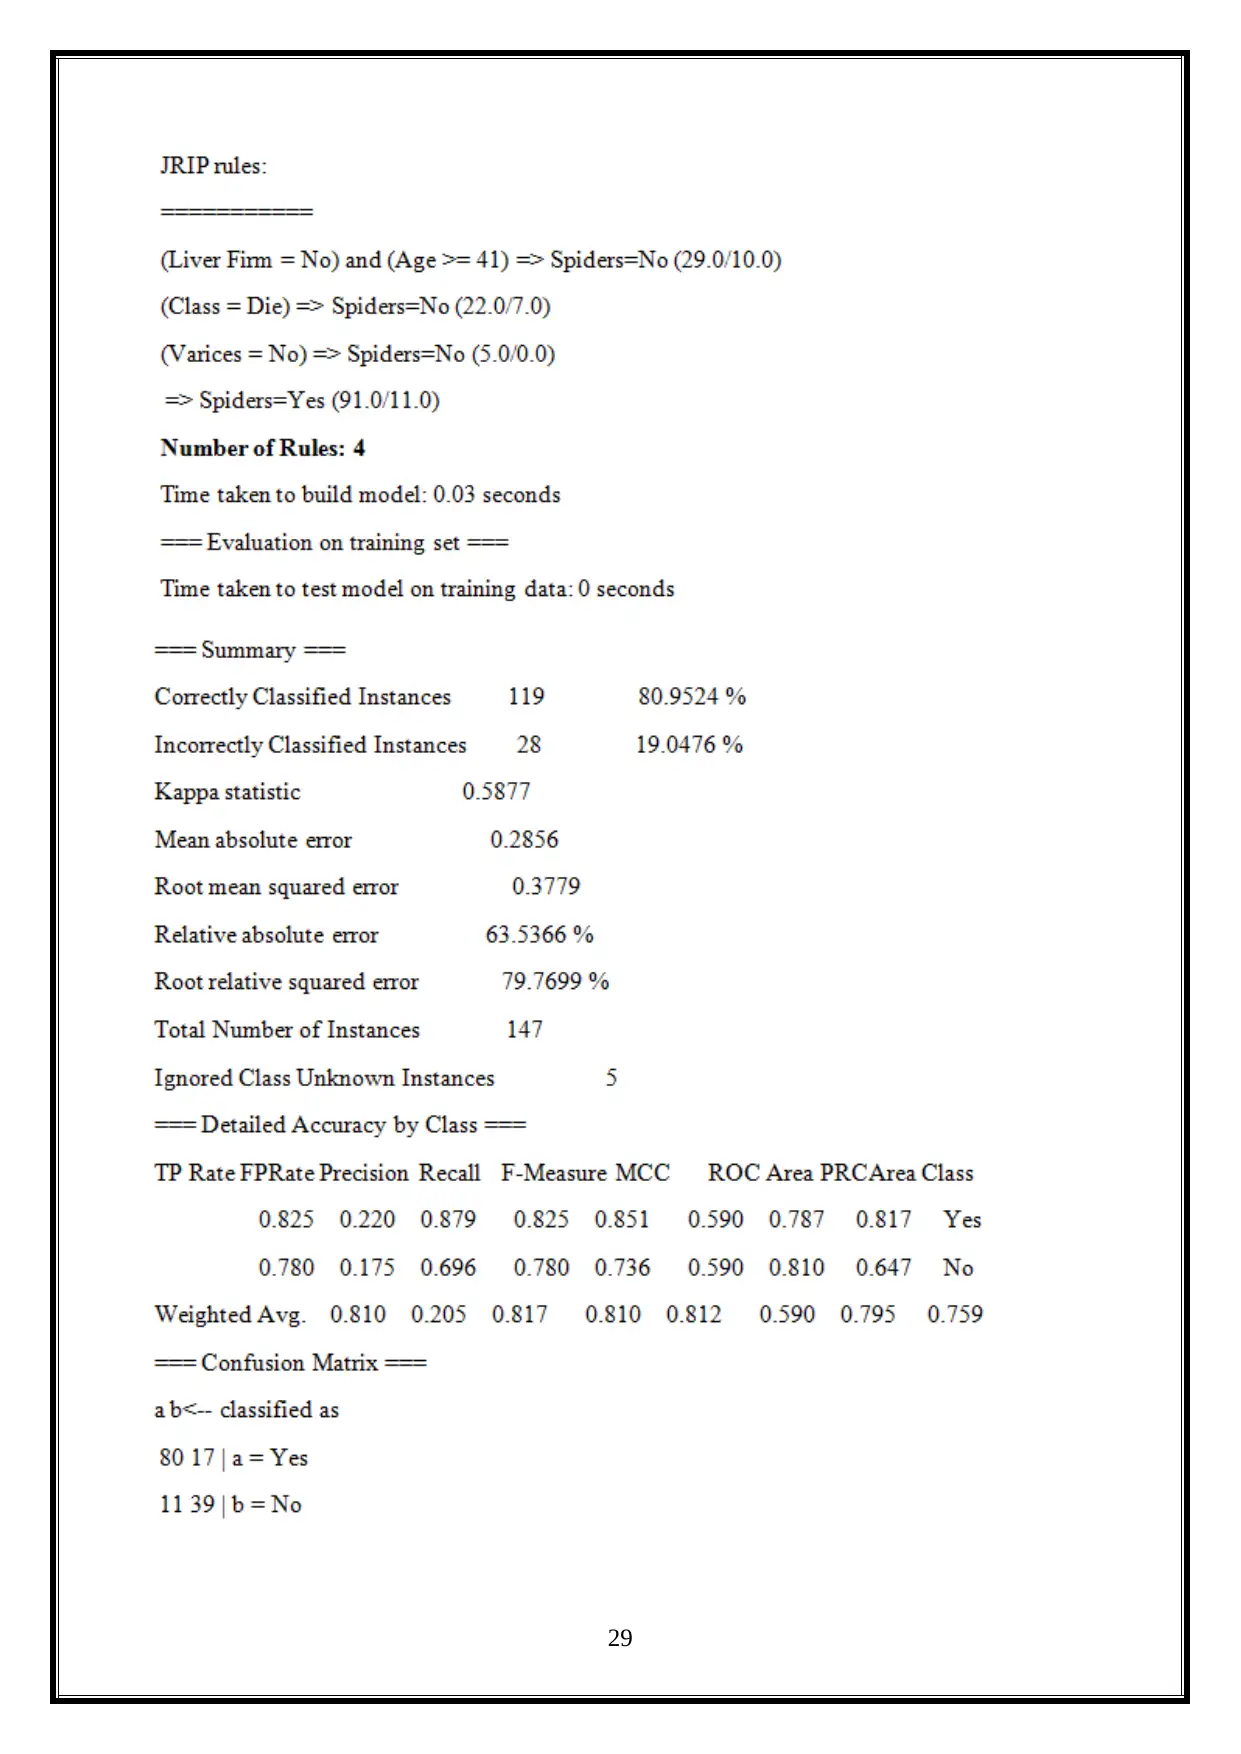
29
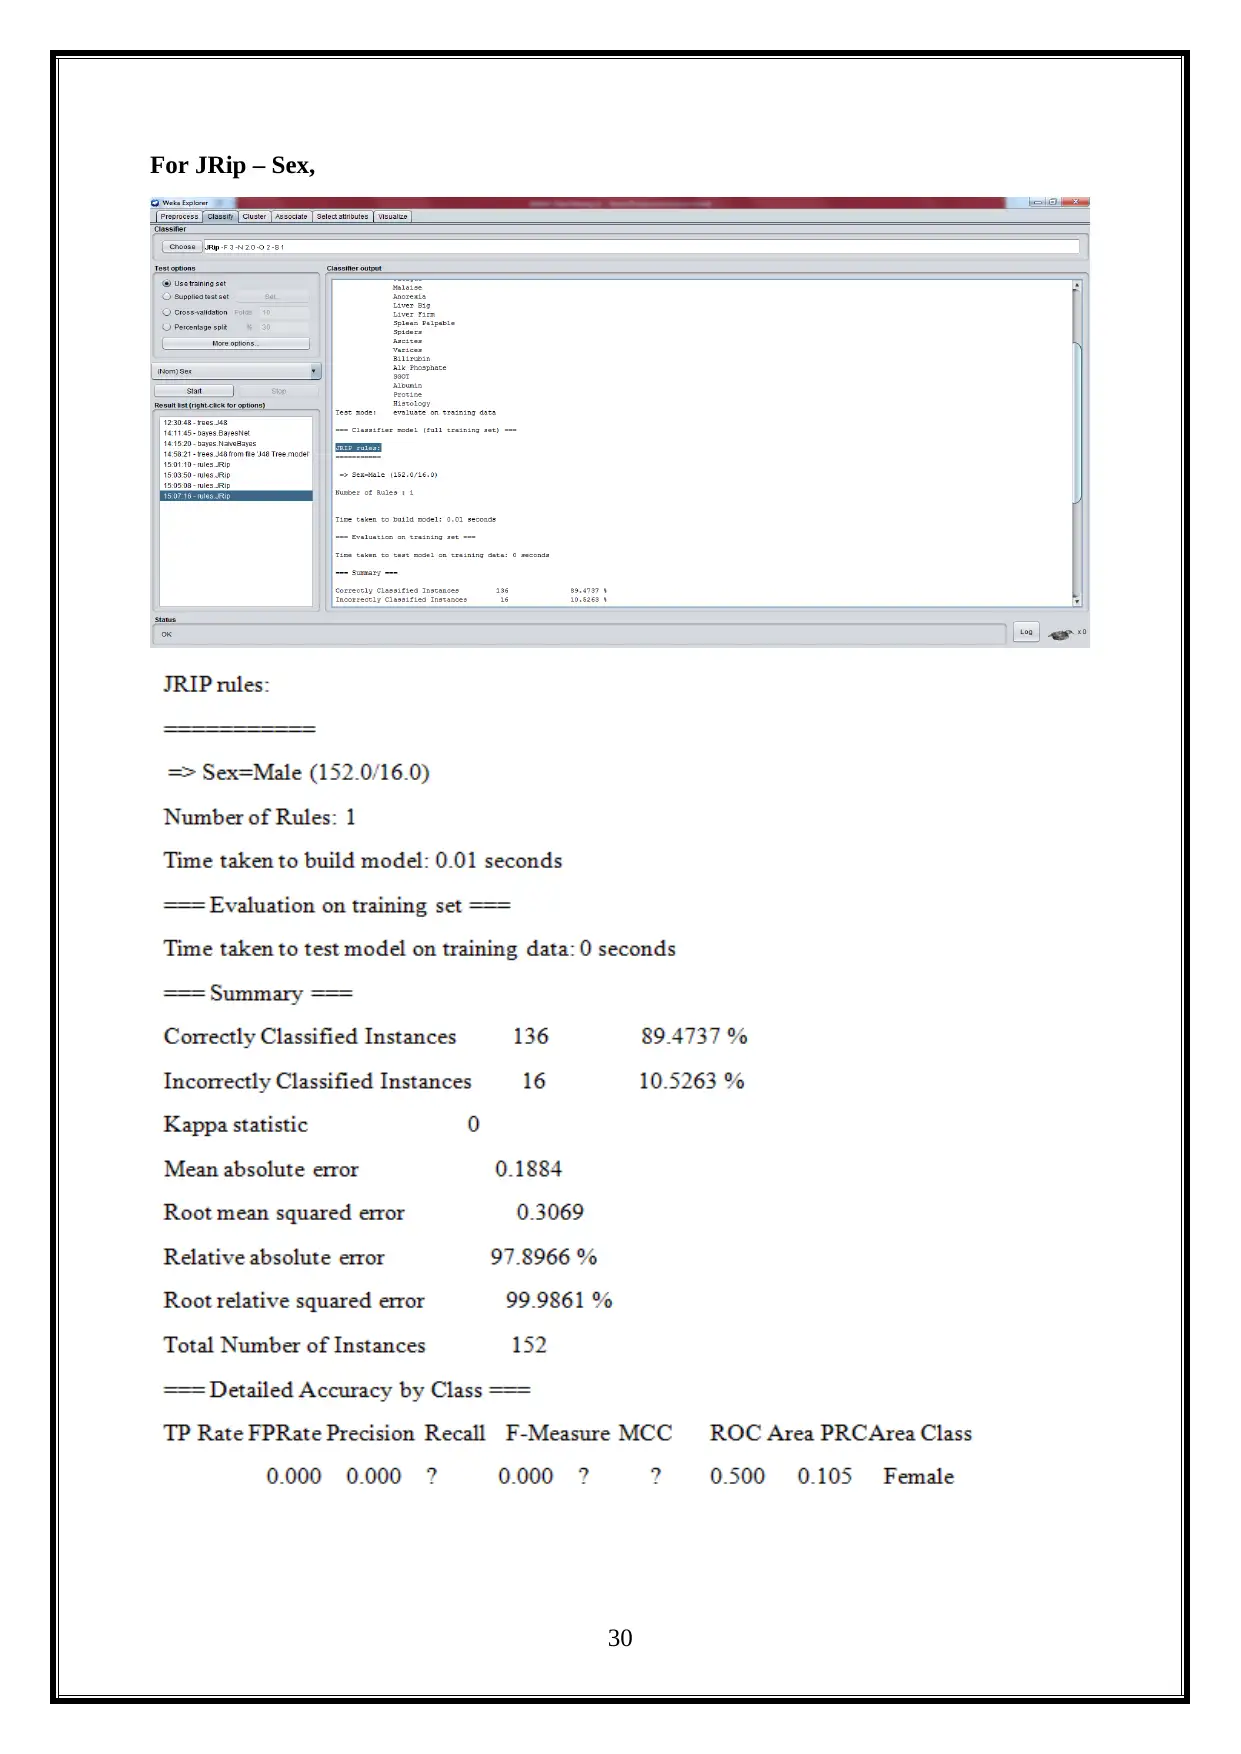
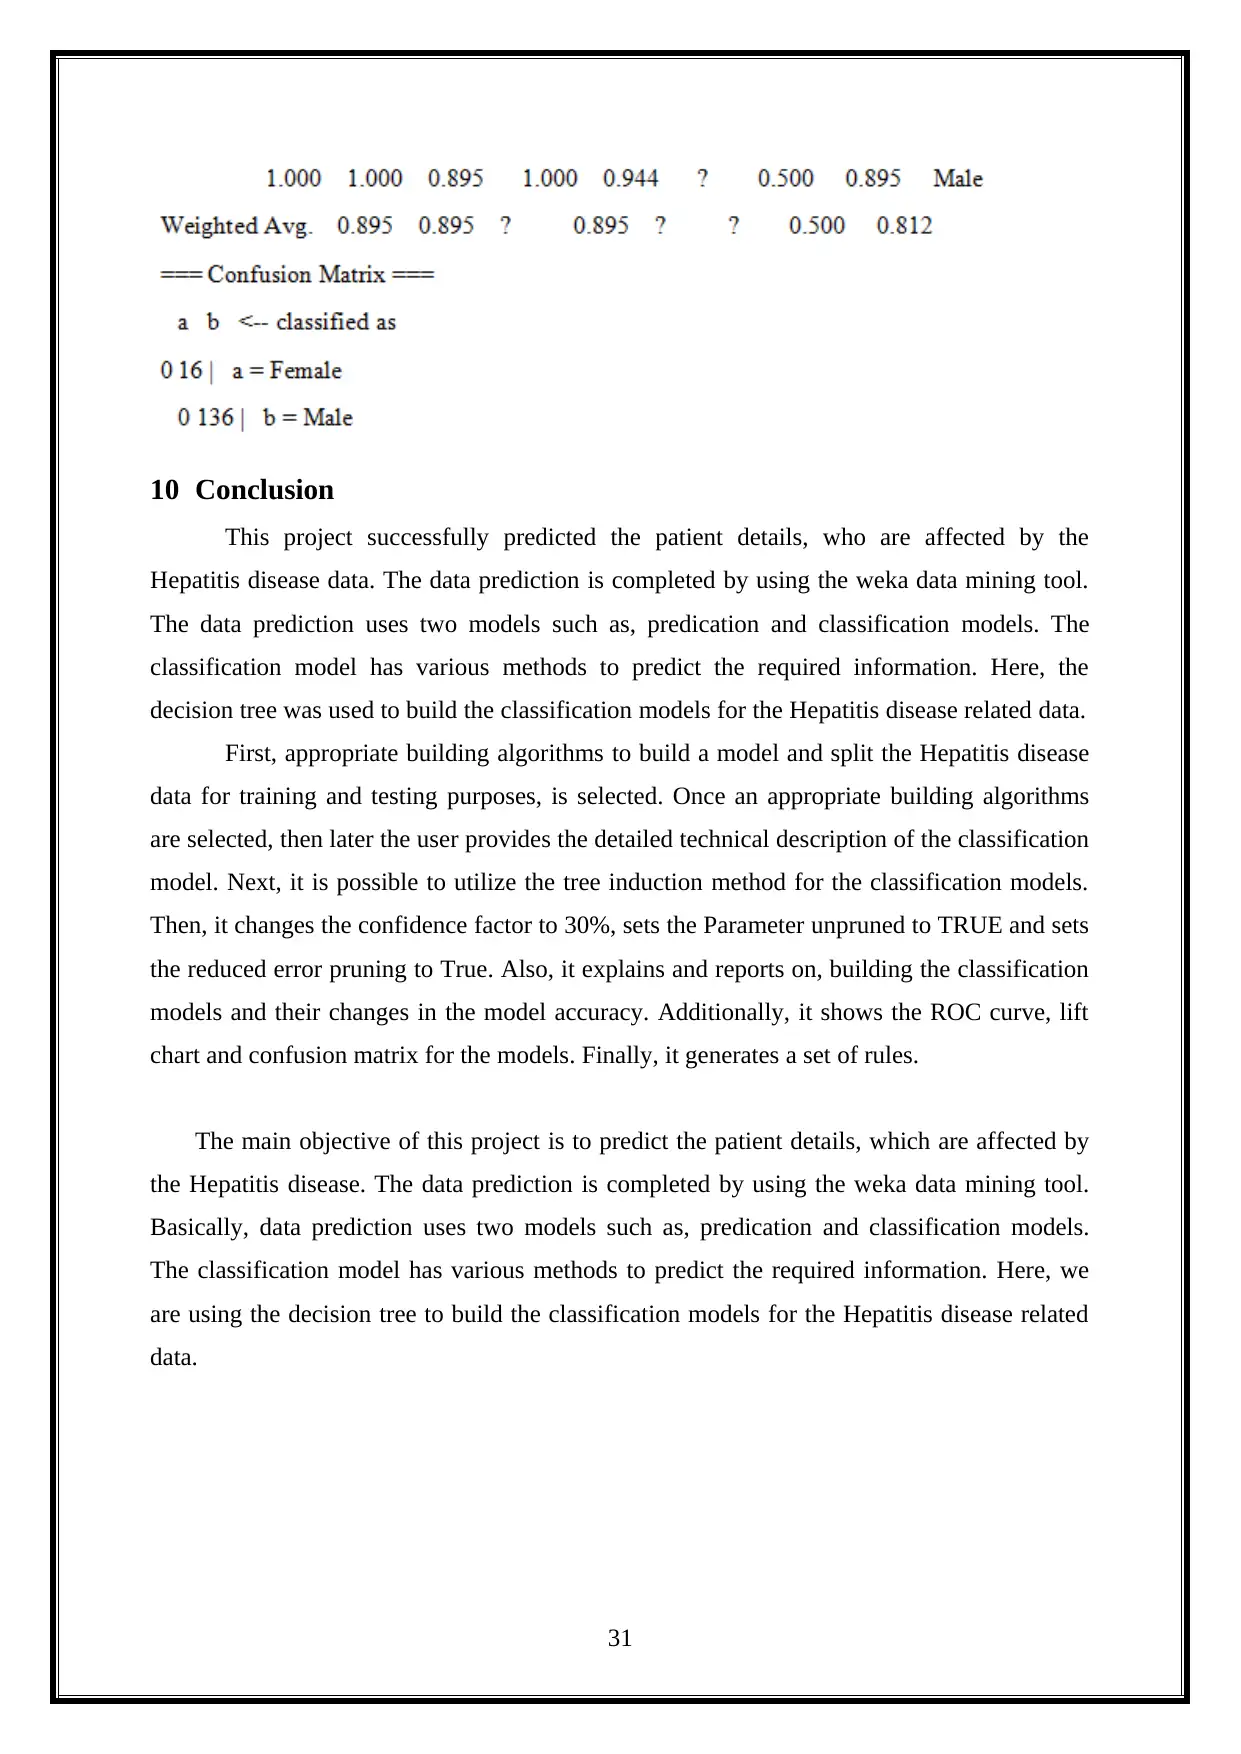
For JRip – Sex,
30
30
Paraphrase This Document
Need a fresh take? Get an instant paraphrase of this document with our AI Paraphraser
10 Conclusion
This project successfully predicted the patient details, who are affected by the
Hepatitis disease data. The data prediction is completed by using the weka data mining tool.
The data prediction uses two models such as, predication and classification models. The
classification model has various methods to predict the required information. Here, the
decision tree was used to build the classification models for the Hepatitis disease related data.
First, appropriate building algorithms to build a model and split the Hepatitis disease
data for training and testing purposes, is selected. Once an appropriate building algorithms
are selected, then later the user provides the detailed technical description of the classification
model. Next, it is possible to utilize the tree induction method for the classification models.
Then, it changes the confidence factor to 30%, sets the Parameter unpruned to TRUE and sets
the reduced error pruning to True. Also, it explains and reports on, building the classification
models and their changes in the model accuracy. Additionally, it shows the ROC curve, lift
chart and confusion matrix for the models. Finally, it generates a set of rules.
The main objective of this project is to predict the patient details, which are affected by
the Hepatitis disease. The data prediction is completed by using the weka data mining tool.
Basically, data prediction uses two models such as, predication and classification models.
The classification model has various methods to predict the required information. Here, we
are using the decision tree to build the classification models for the Hepatitis disease related
data.
31
References
Arabnia, H., Stahlbock, R., Abou-Nasr, M., & Weiss, G. DMIN 2017.
Belloc, H. (1967). On. Freeport, N.Y.: Books for Libraries Press.
Han, J., Kamber, M., & Pei, J. (2012). Data mining. Amsterdam: Elsevier/Morgan
Kaufmann.
Li, T. (2012). Music data mining. Boca Raton, Fla: CRC.
Michalski, R. (2014). Machine Learning. Elsevier Science.
Mitchell, T. (2017). Machine learning. New York: McGraw Hill.
Mitsa, T. (2010). Temporal data mining. Boca Raton: Taylor & Francis.
Natarajan, B. (2014). Machine Learning. Elsevier Science.
Perner, P. (2015). Machine Learning and Data Mining in Pattern Recognition. Cham:
Springer International Publishing.
Witten, I., Frank, E., Hall, M., & Pal, C. (2017). Data mining. Amsterdam: Morgan
Kaufmann.
32
1 out of 33
Related Documents


Your All-in-One AI-Powered Toolkit for Academic Success.
+13062052269
info@desklib.com
Available 24*7 on WhatsApp / Email
![[object Object]](/_next/static/media/star-bottom.7253800d.svg)
Unlock your academic potential
© 2024 | Zucol Services PVT LTD | All rights reserved.