Data Mining Report: Classification Algorithms Performance Analysis
VerifiedAdded on 2023/06/05
|6
|956
|66
Report
AI Summary
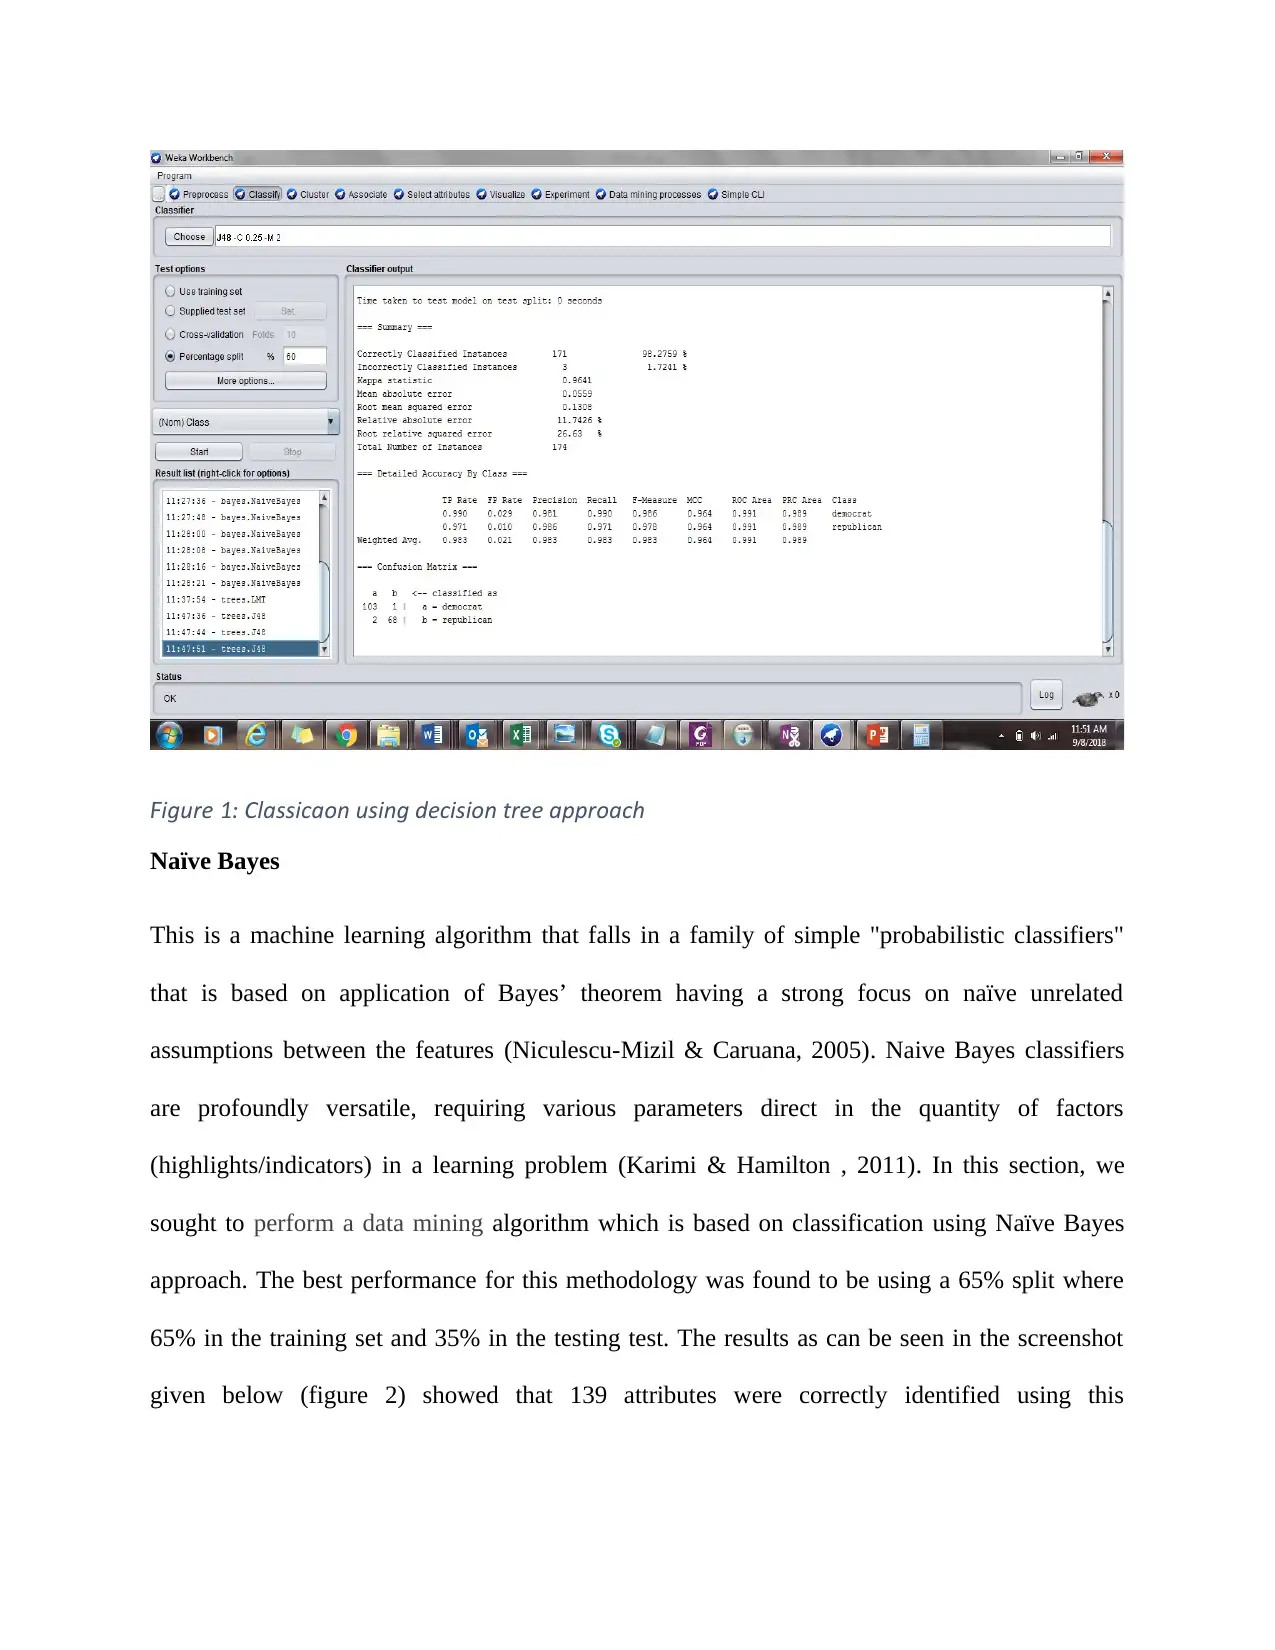
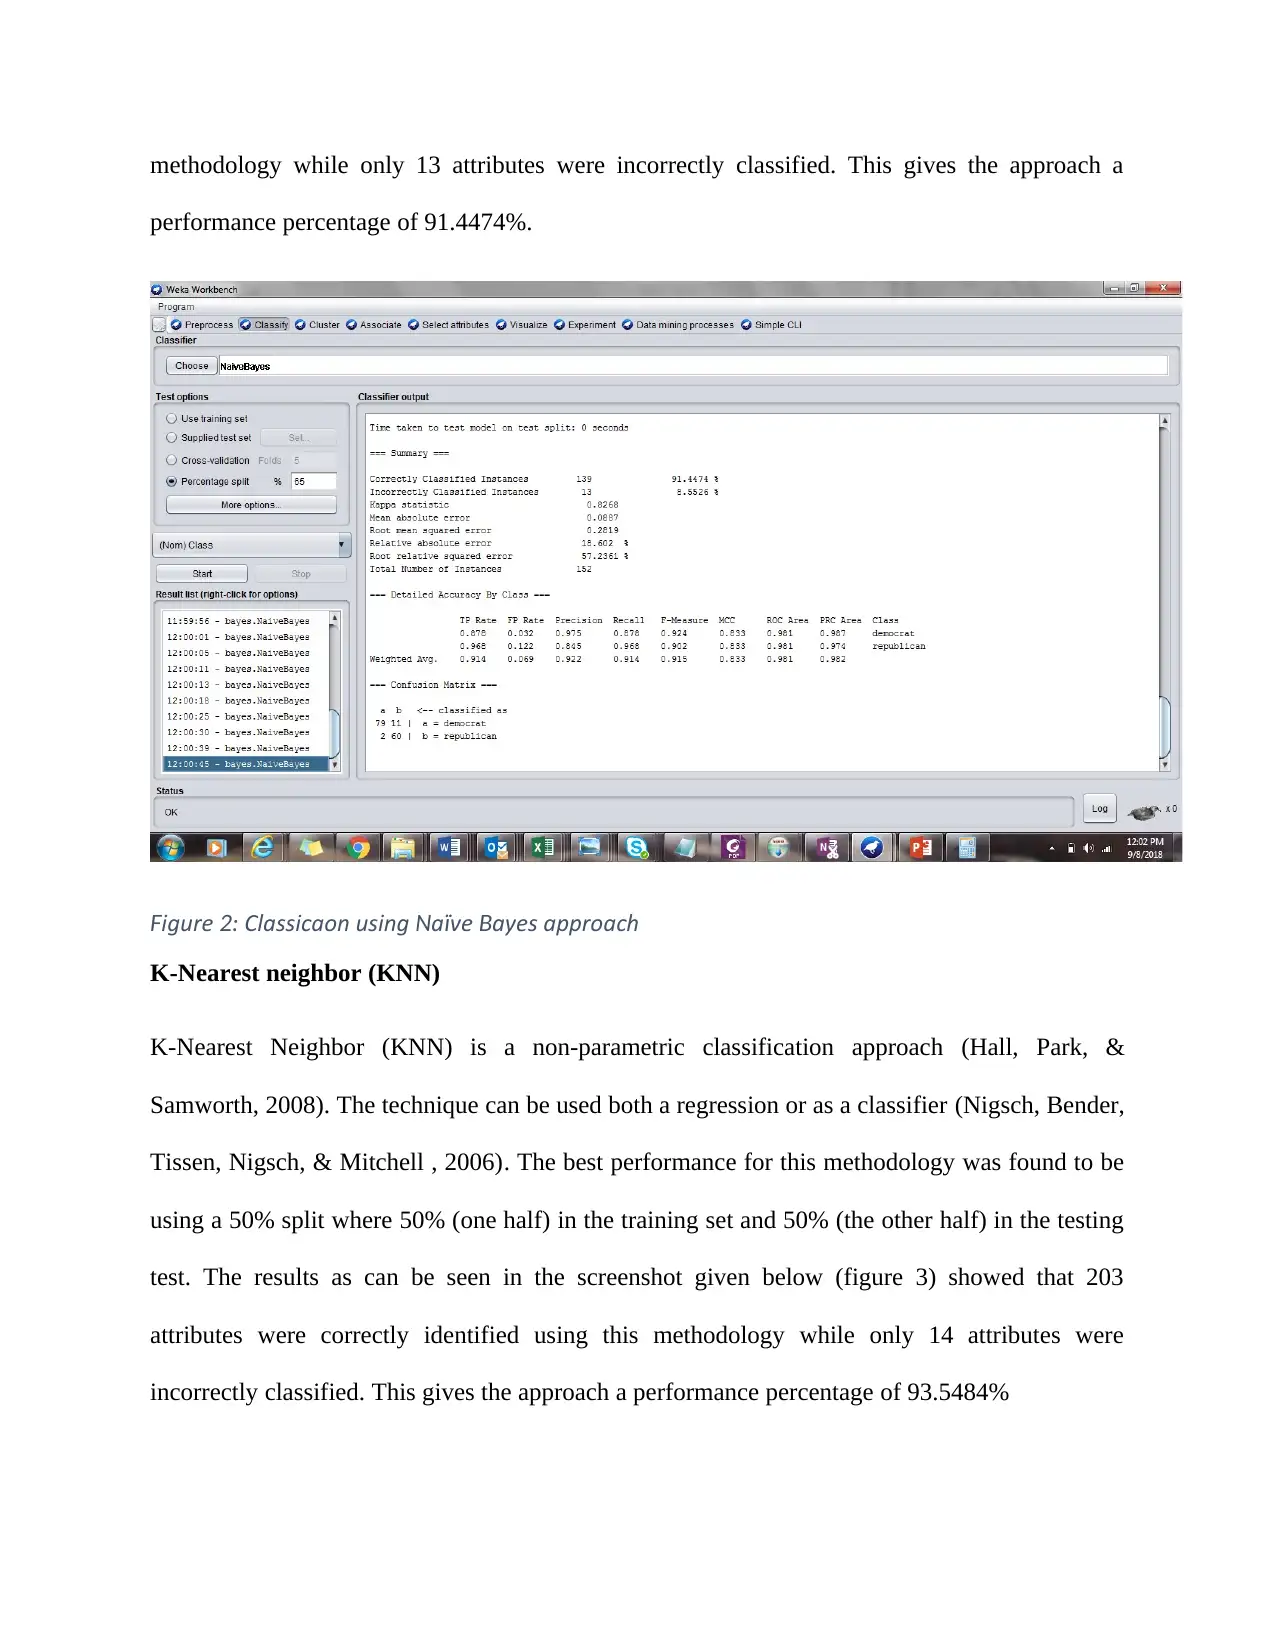
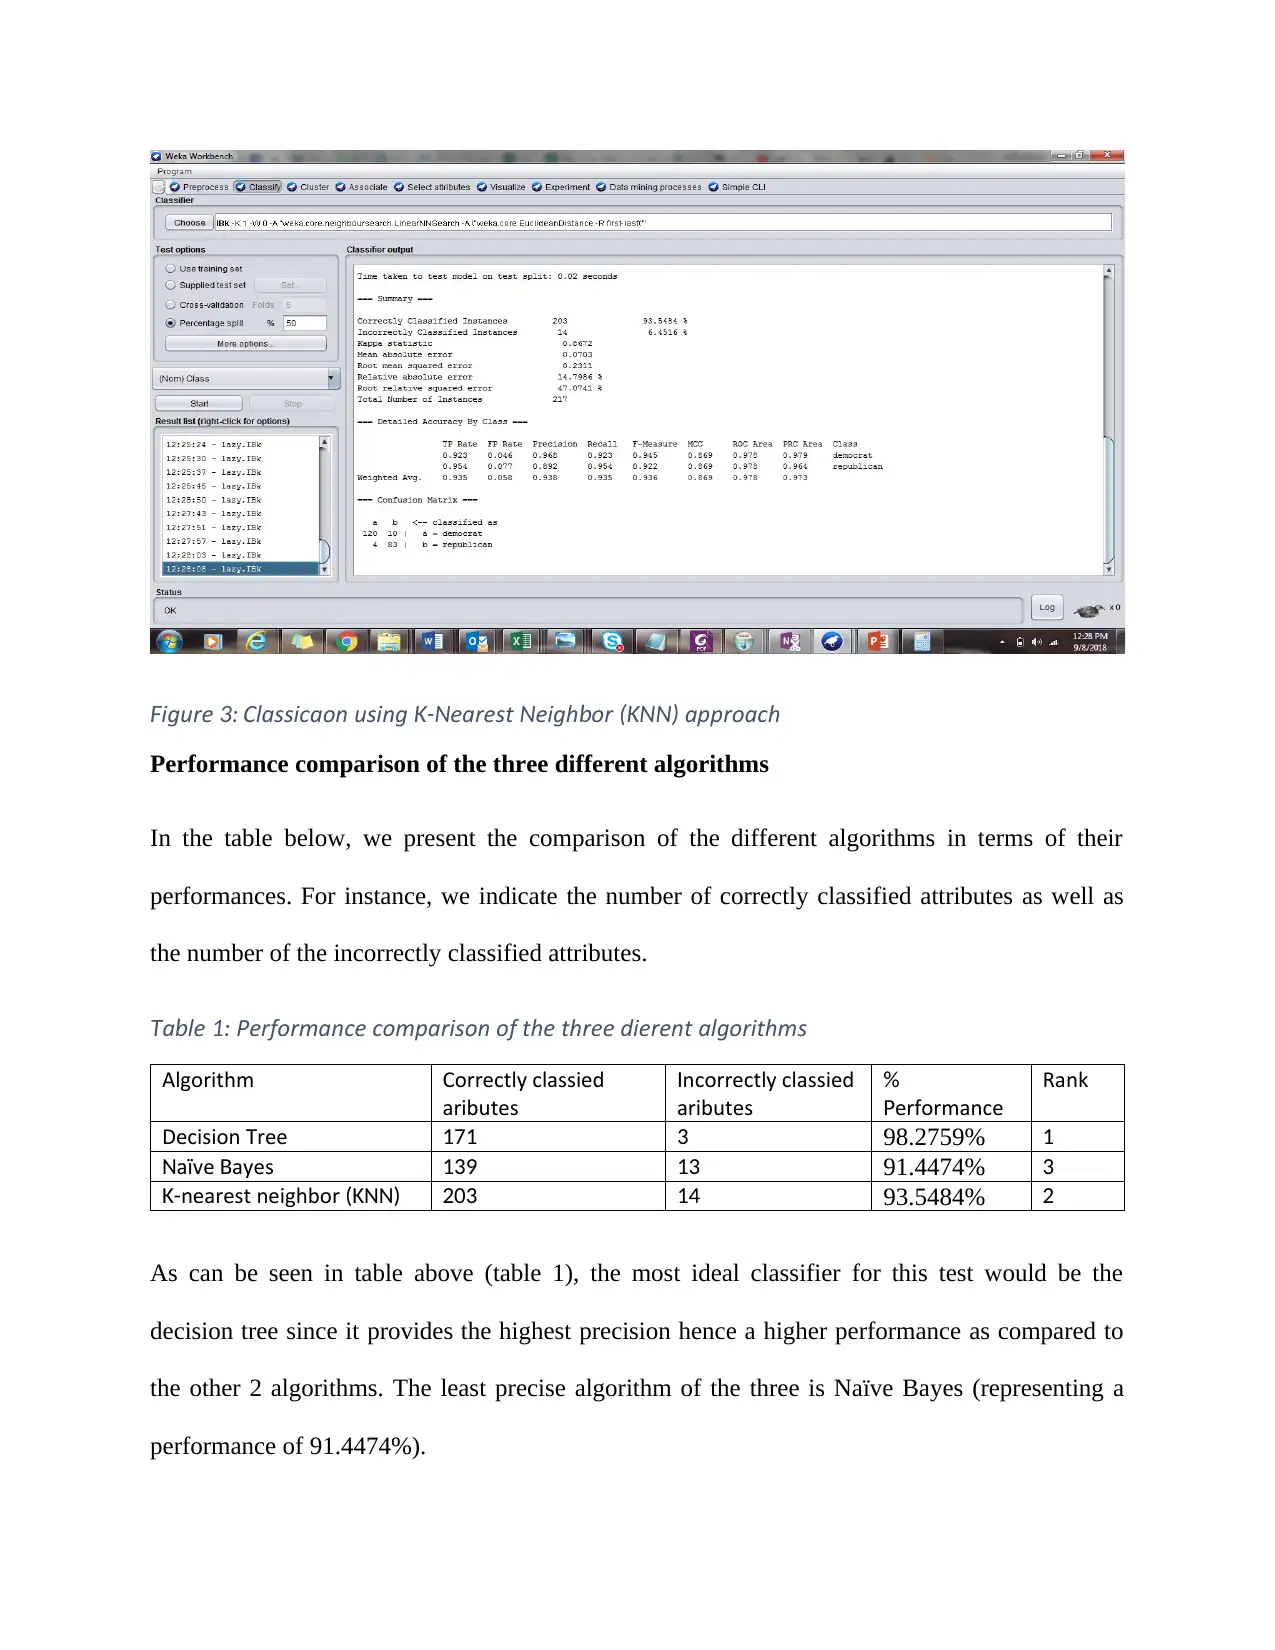
This report presents a data mining evaluation of the performance of different classification algorithms, including Decision Tree, Naive Bayes, and k-Nearest Neighbor (KNN). The dataset (vote.arff) was loaded into Weka, and the performance of each algorithm was compared based on the number of correctly and incorrectly classified attributes. The Decision Tree algorithm achieved the highest performance with 98.2759% accuracy, followed by KNN at 93.5484% and Naive Bayes at 91.4474%. The analysis concludes that the Decision Tree is the most suitable classifier for the dataset used in this evaluation.
1 out of 6
Related Documents


Your All-in-One AI-Powered Toolkit for Academic Success.
+13062052269
info@desklib.com
Available 24*7 on WhatsApp / Email
![[object Object]](/_next/static/media/star-bottom.7253800d.svg)
Copyright © 2020–2026 A2Z Services. All Rights Reserved. Developed and managed by ZUCOL.