Assignment on Intelligent Systems for Analytics
Added on 2022-08-25
47 Pages6004 Words28 Views
INTELLIGENT SYSTEMS FOR ANALYTICS
INTELLIGENT SYSTEMS FOR DATA ANALYTICS.
By (Names)
(Course Name)
(Roll Number)
(Course Code)
(Instructor)
(Date)
1 | P a g e
INTELLIGENT SYSTEMS FOR DATA ANALYTICS.
By (Names)
(Course Name)
(Roll Number)
(Course Code)
(Instructor)
(Date)
1 | P a g e

INTELLIGENT SYSTEMS FOR ANALYTICS
Contents
Question One...............................................................................................................................4
Introduction data analytics classifiers.....................................................................................4
Resample function in Weka................................................................................................6
Data importation in Weka...................................................................................................7
Sampled Dataset..................................................................................................................7
Training data set..................................................................................................................7
Test data set.........................................................................................................................9
Support Vector Machine (SVM)...........................................................................................10
SMO function in Weka.....................................................................................................12
SMO model prediction results..........................................................................................13
SVM results table..............................................................................................................13
SMO model in Weka.........................................................................................................14
Prediction results from SMO model.................................................................................14
Nearest Neighbor Algorithm.................................................................................................16
IBK function in Weka.......................................................................................................17
IBK model evaluation with test data.................................................................................18
IBK model prediction results............................................................................................19
IBK results table................................................................................................................19
IBK model predicted data.................................................................................................20
Decision Trees.......................................................................................................................22
Decision tree structure......................................................................................................22
REPTree function in Weka...............................................................................................24
REPTree model using the test dataset...............................................................................25
Prediction results from the REPTree model.....................................................................26
REPTree results table........................................................................................................26
Predicted data from the Decision model in Weka.............................................................27
Naive Bayes..........................................................................................................................28
NaiveBayes function in Weka...........................................................................................31
Model evaluation using the test data.................................................................................32
Bayes classifier test data Model results............................................................................33
Naïve Bayes results table..................................................................................................33
Predicted data from the NaiveBayes Model.....................................................................34
2 | P a g e
INTELLIGENT SYSTEMS FOR ANALYTICS
Question Two............................................................................................................................36
Data analytics Dashboards....................................................................................................36
The dataset used to generate the dashboards....................................................................36
Scatterplot dashboard of WC and DC...............................................................................40
Combine dashboard...........................................................................................................40
References:................................................................................................................................42
3 | P a g e
INTELLIGENT SYSTEMS FOR ANALYTICS
Question One
Introduction data analytics classifiers
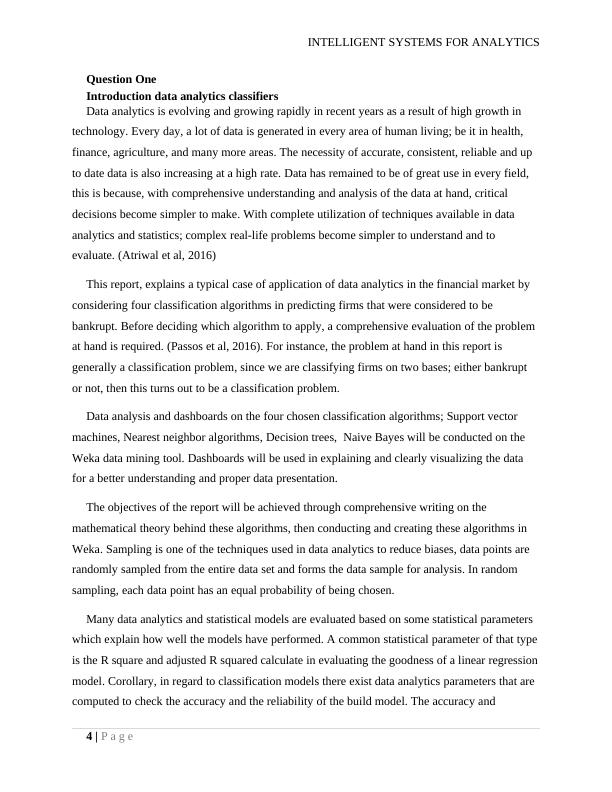
Data analytics is evolving and growing rapidly in recent years as a result of high growth in
technology. Every day, a lot of data is generated in every area of human living; be it in health,
finance, agriculture, and many more areas. The necessity of accurate, consistent, reliable and up
to date data is also increasing at a high rate. Data has remained to be of great use in every field,
this is because, with comprehensive understanding and analysis of the data at hand, critical
decisions become simpler to make. With complete utilization of techniques available in data
analytics and statistics; complex real-life problems become simpler to understand and to
evaluate. (Atriwal et al, 2016)
This report, explains a typical case of application of data analytics in the financial market by
considering four classification algorithms in predicting firms that were considered to be
bankrupt. Before deciding which algorithm to apply, a comprehensive evaluation of the problem
at hand is required. (Passos et al, 2016). For instance, the problem at hand in this report is
generally a classification problem, since we are classifying firms on two bases; either bankrupt
or not, then this turns out to be a classification problem.
Data analysis and dashboards on the four chosen classification algorithms; Support vector
machines, Nearest neighbor algorithms, Decision trees, Naive Bayes will be conducted on the
Weka data mining tool. Dashboards will be used in explaining and clearly visualizing the data
for a better understanding and proper data presentation.
The objectives of the report will be achieved through comprehensive writing on the
mathematical theory behind these algorithms, then conducting and creating these algorithms in
Weka. Sampling is one of the techniques used in data analytics to reduce biases, data points are
randomly sampled from the entire data set and forms the data sample for analysis. In random
sampling, each data point has an equal probability of being chosen.
Many data analytics and statistical models are evaluated based on some statistical parameters
which explain how well the models have performed. A common statistical parameter of that type
is the R square and adjusted R squared calculate in evaluating the goodness of a linear regression
model. Corollary, in regard to classification models there exist data analytics parameters that are
computed to check the accuracy and the reliability of the build model. The accuracy and
4 | P a g e
Question One
Introduction data analytics classifiers
Data analytics is evolving and growing rapidly in recent years as a result of high growth in
technology. Every day, a lot of data is generated in every area of human living; be it in health,
finance, agriculture, and many more areas. The necessity of accurate, consistent, reliable and up
to date data is also increasing at a high rate. Data has remained to be of great use in every field,
this is because, with comprehensive understanding and analysis of the data at hand, critical
decisions become simpler to make. With complete utilization of techniques available in data
analytics and statistics; complex real-life problems become simpler to understand and to
evaluate. (Atriwal et al, 2016)
This report, explains a typical case of application of data analytics in the financial market by
considering four classification algorithms in predicting firms that were considered to be
bankrupt. Before deciding which algorithm to apply, a comprehensive evaluation of the problem
at hand is required. (Passos et al, 2016). For instance, the problem at hand in this report is
generally a classification problem, since we are classifying firms on two bases; either bankrupt
or not, then this turns out to be a classification problem.
Data analysis and dashboards on the four chosen classification algorithms; Support vector
machines, Nearest neighbor algorithms, Decision trees, Naive Bayes will be conducted on the
Weka data mining tool. Dashboards will be used in explaining and clearly visualizing the data
for a better understanding and proper data presentation.
The objectives of the report will be achieved through comprehensive writing on the
mathematical theory behind these algorithms, then conducting and creating these algorithms in
Weka. Sampling is one of the techniques used in data analytics to reduce biases, data points are
randomly sampled from the entire data set and forms the data sample for analysis. In random
sampling, each data point has an equal probability of being chosen.
Many data analytics and statistical models are evaluated based on some statistical parameters
which explain how well the models have performed. A common statistical parameter of that type
is the R square and adjusted R squared calculate in evaluating the goodness of a linear regression
model. Corollary, in regard to classification models there exist data analytics parameters that are
computed to check the accuracy and the reliability of the build model. The accuracy and
4 | P a g e
INTELLIGENT SYSTEMS FOR ANALYTICS
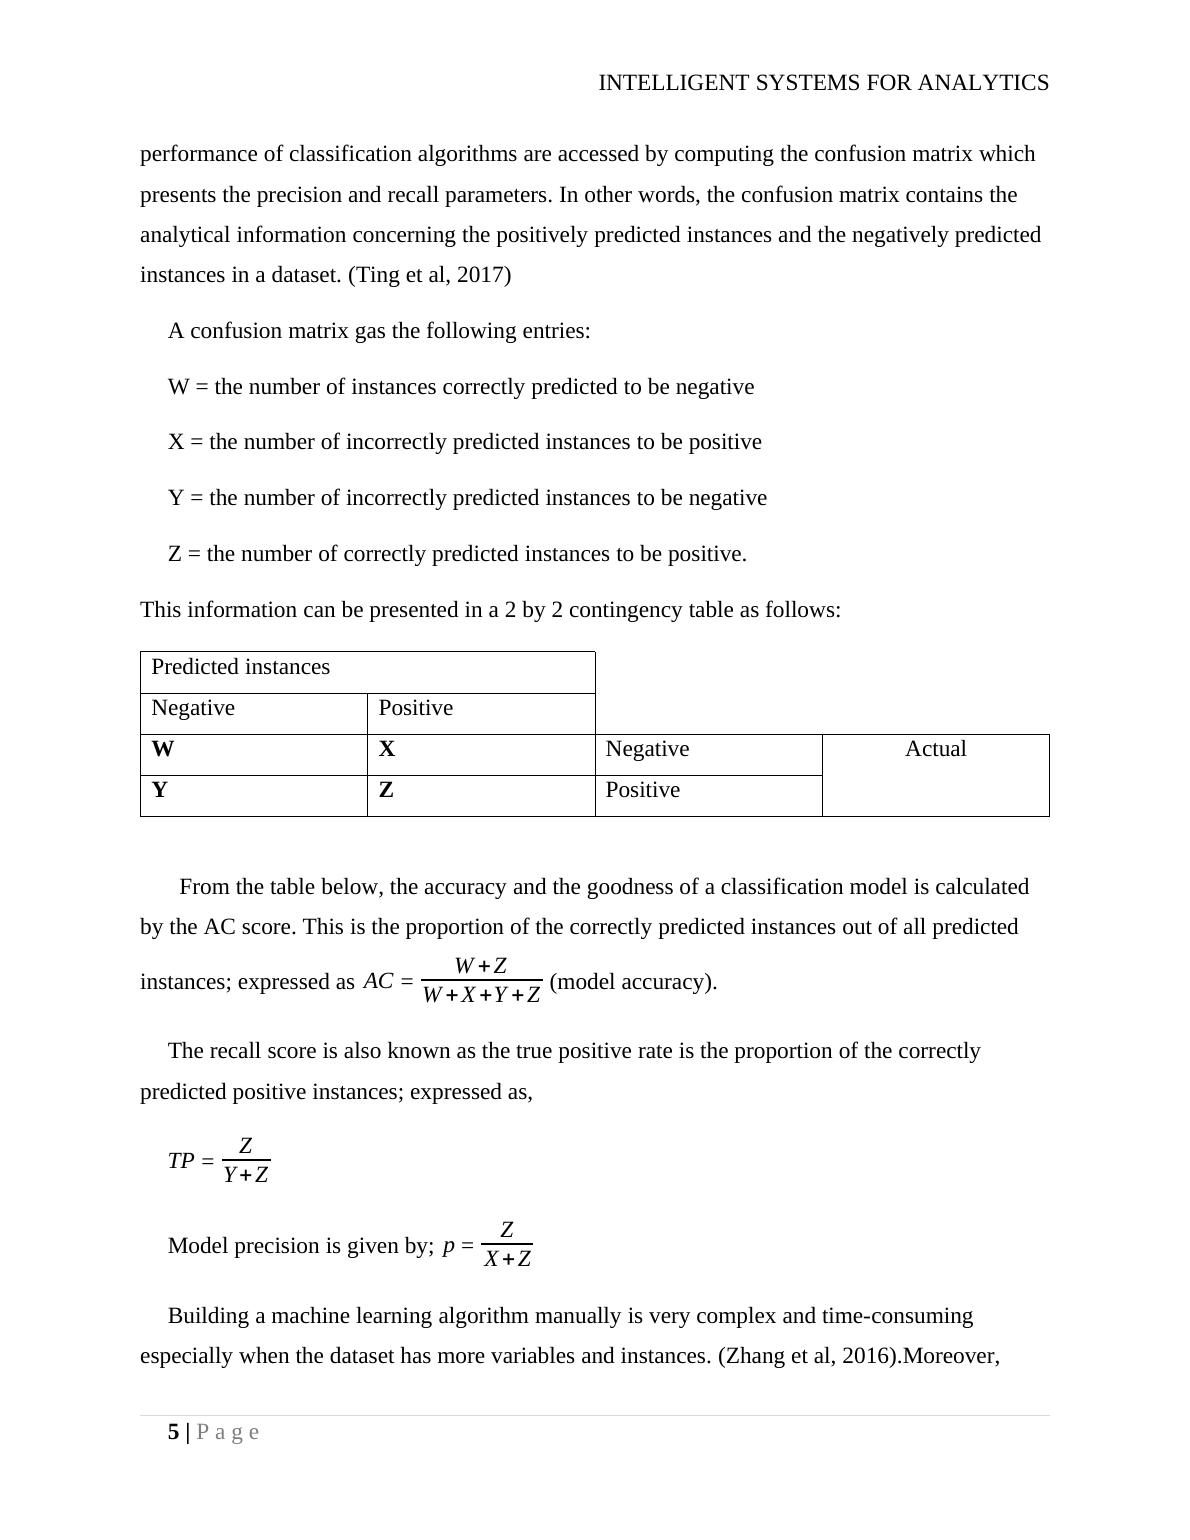
performance of classification algorithms are accessed by computing the confusion matrix which
presents the precision and recall parameters. In other words, the confusion matrix contains the
analytical information concerning the positively predicted instances and the negatively predicted
instances in a dataset. (Ting et al, 2017)
A confusion matrix gas the following entries:
W = the number of instances correctly predicted to be negative
X = the number of incorrectly predicted instances to be positive
Y = the number of incorrectly predicted instances to be negative
Z = the number of correctly predicted instances to be positive.
This information can be presented in a 2 by 2 contingency table as follows:
Predicted instances
Negative Positive
W X Negative Actual
Y Z Positive
From the table below, the accuracy and the goodness of a classification model is calculated
by the AC score. This is the proportion of the correctly predicted instances out of all predicted
instances; expressed as AC = W + Z
W + X +Y + Z (model accuracy).
The recall score is also known as the true positive rate is the proportion of the correctly
predicted positive instances; expressed as,
TP = Z
Y + Z
Model precision is given by; p = Z
X + Z
Building a machine learning algorithm manually is very complex and time-consuming
especially when the dataset has more variables and instances. (Zhang et al, 2016).Moreover,
5 | P a g e
INTELLIGENT SYSTEMS FOR ANALYTICS
subjective analysis and critical thinking can be applied to the data which is a manual data
analysis approach where the outcome of an event is related to the values of the other variables.
More clearly, the aim is to try and figure out the outcome of the categorical variable (1,0) and try
to relate this outcome and the values of “WC” and “DC”. This kind of evaluation will lead to a
pattern in the dataset such as; when the value of WC is between let us say a and b and values of
DC is between d and c, the most probable class for such instance is 0 or 1.
The Resample function in the Weka data analytics tool was used in randomly sampling the
data points to maintain the required percentage of data points. A sample size of 40 instances was
computed using Weka. Resampling was done on both the test and the training data set. The
following are the data points.
Resample function in Weka
Screenshot 1.0: showing the resample function in Weka used for sampling the dataset.
6 | P a g e

INTELLIGENT SYSTEMS FOR ANALYTICS
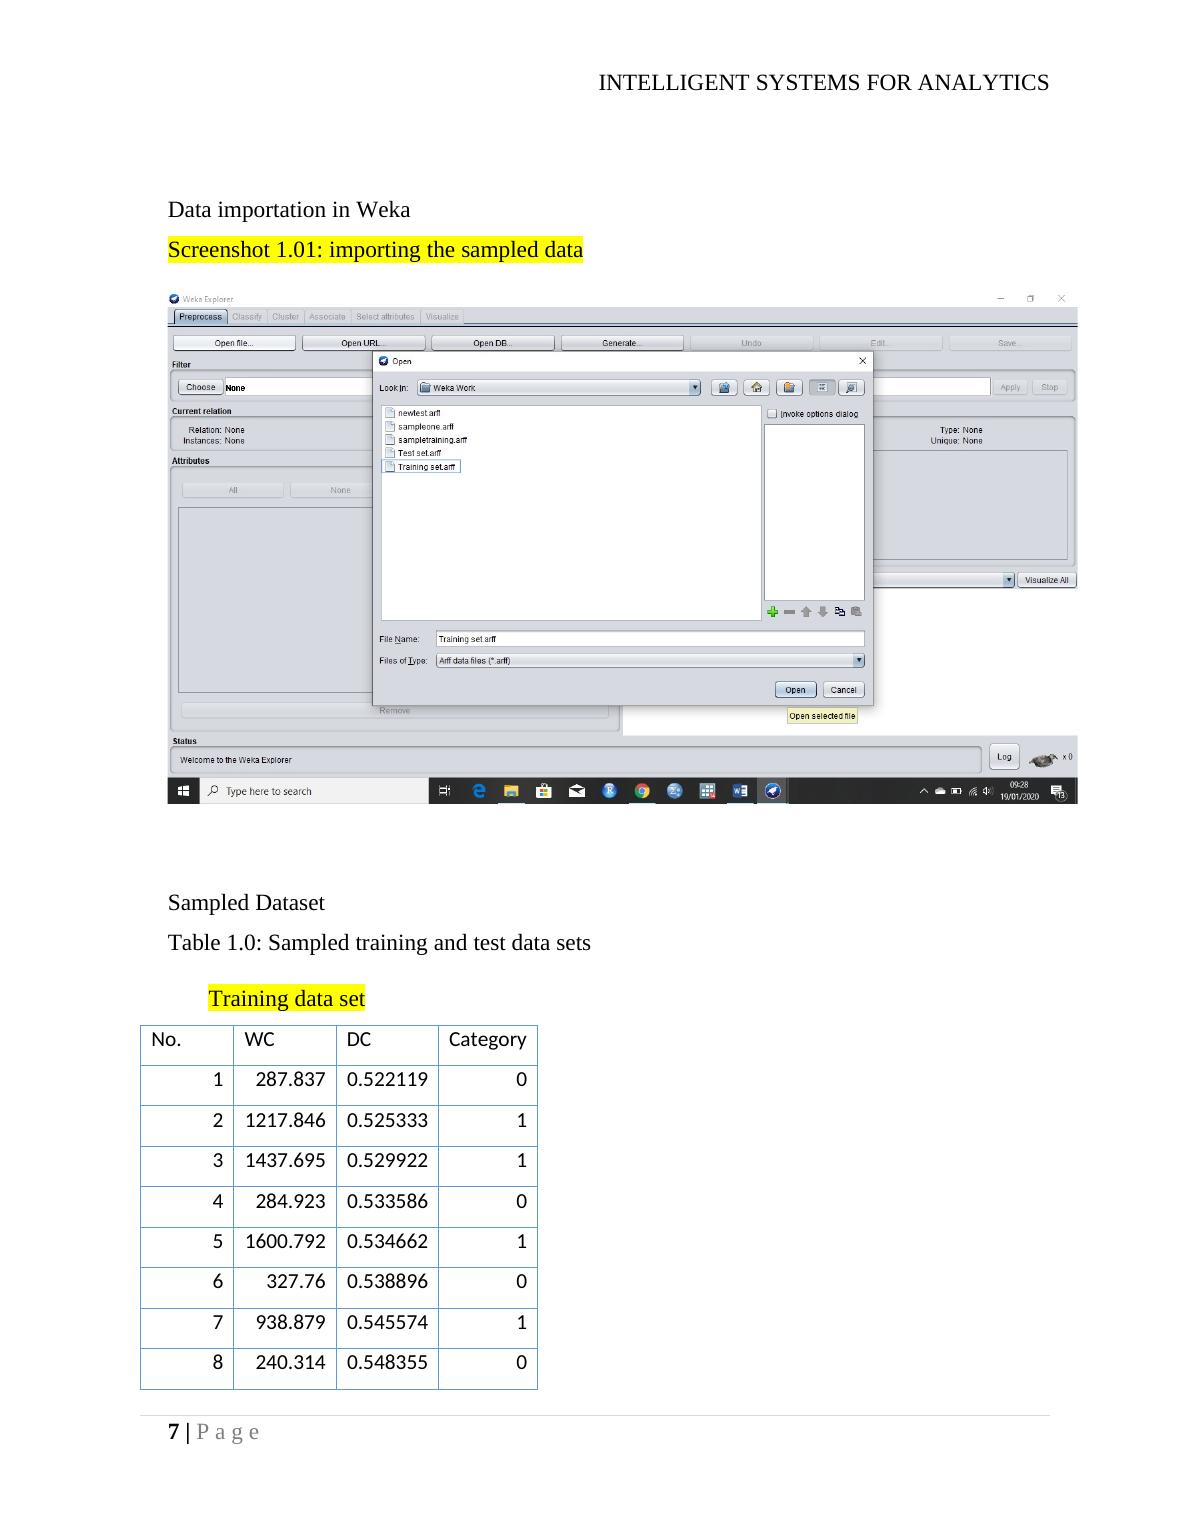
Data importation in Weka
Screenshot 1.01: importing the sampled data
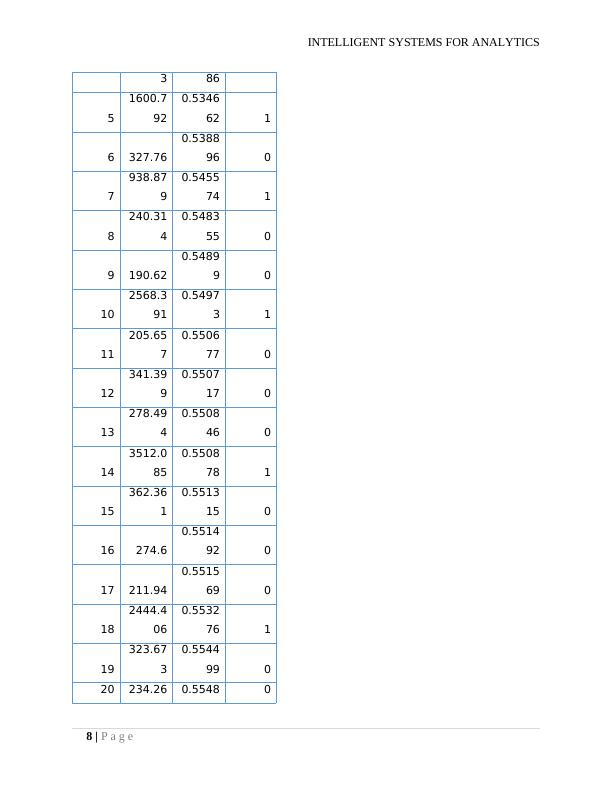
Sampled Dataset
Table 1.0: Sampled training and test data sets
Training data set
No. WC DC
Catego
ry
1
287.83
7
0.5221
19 0
2
1217.8
46
0.5253
33 1
3
1437.6
95
0.5299
22 1
4 284.92 0.5335 0
7 | P a g e
Data importation in Weka
Screenshot 1.01: importing the sampled data
Sampled Dataset
Table 1.0: Sampled training and test data sets
Training data set
No. WC DC
Catego
ry
1
287.83
7
0.5221
19 0
2
1217.8
46
0.5253
33 1
3
1437.6
95
0.5299
22 1
4 284.92 0.5335 0
7 | P a g e
INTELLIGENT SYSTEMS FOR ANALYTICS
3 86
5
1600.7
92
0.5346
62 1
6 327.76
0.5388
96 0
7
938.87
9
0.5455
74 1
8
240.31
4
0.5483
55 0
9 190.62
0.5489
9 0
10
2568.3
91
0.5497
3 1
11
205.65
7
0.5506
77 0
12
341.39
9
0.5507
17 0
13
278.49
4
0.5508
46 0
14
3512.0
85
0.5508
78 1
15
362.36
1
0.5513
15 0
16 274.6
0.5514
92 0
17 211.94
0.5515
69 0
18
2444.4
06
0.5532
76 1
19
323.67
3
0.5544
99 0
20 234.26 0.5548 0
8 | P a g e
End of preview
Want to access all the pages? Upload your documents or become a member.
Related Documents
Comparative Exploration of KNN, J48 and Lazy IBK Classifiers in Wekalg...
|19
|2887
|140
Text Classification Using Naïve Bayeslg...
|15
|1230
|324
Data Mining and Visualization for Business Intelligencelg...
|14
|1554
|444
Data Mining and Visualization: Performance Comparison of Classification Algorithmslg...
|6
|956
|66
Study on Detection of Breast Cancerlg...
|4
|665
|193
Digit Recognition and Pattern Analysis using Classification Techniqueslg...
|10
|2450
|398