COR1-GB.1305.85 Statistics and Data Analysis Final Exam Solution
VerifiedAdded on 2023/03/20
|7
|1378
|58
Homework Assignment
AI Summary
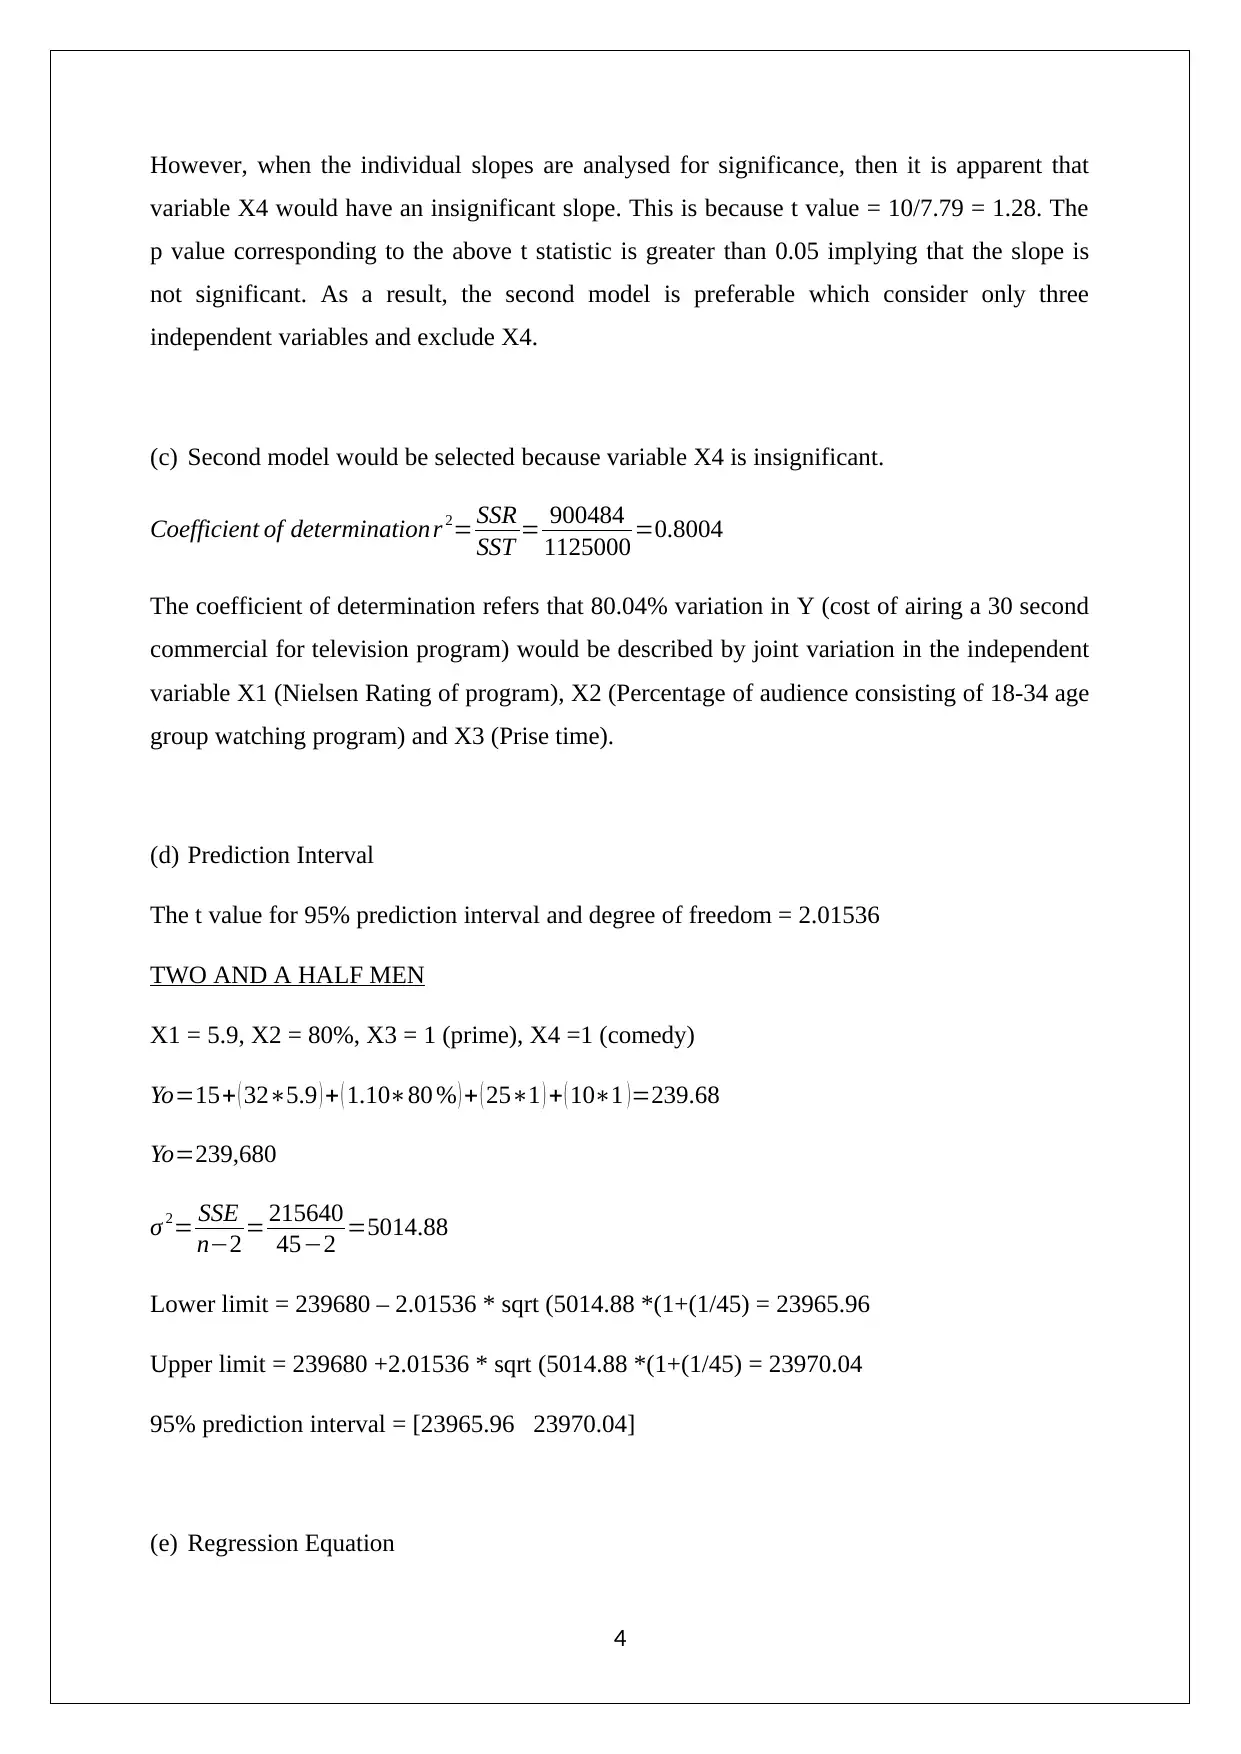
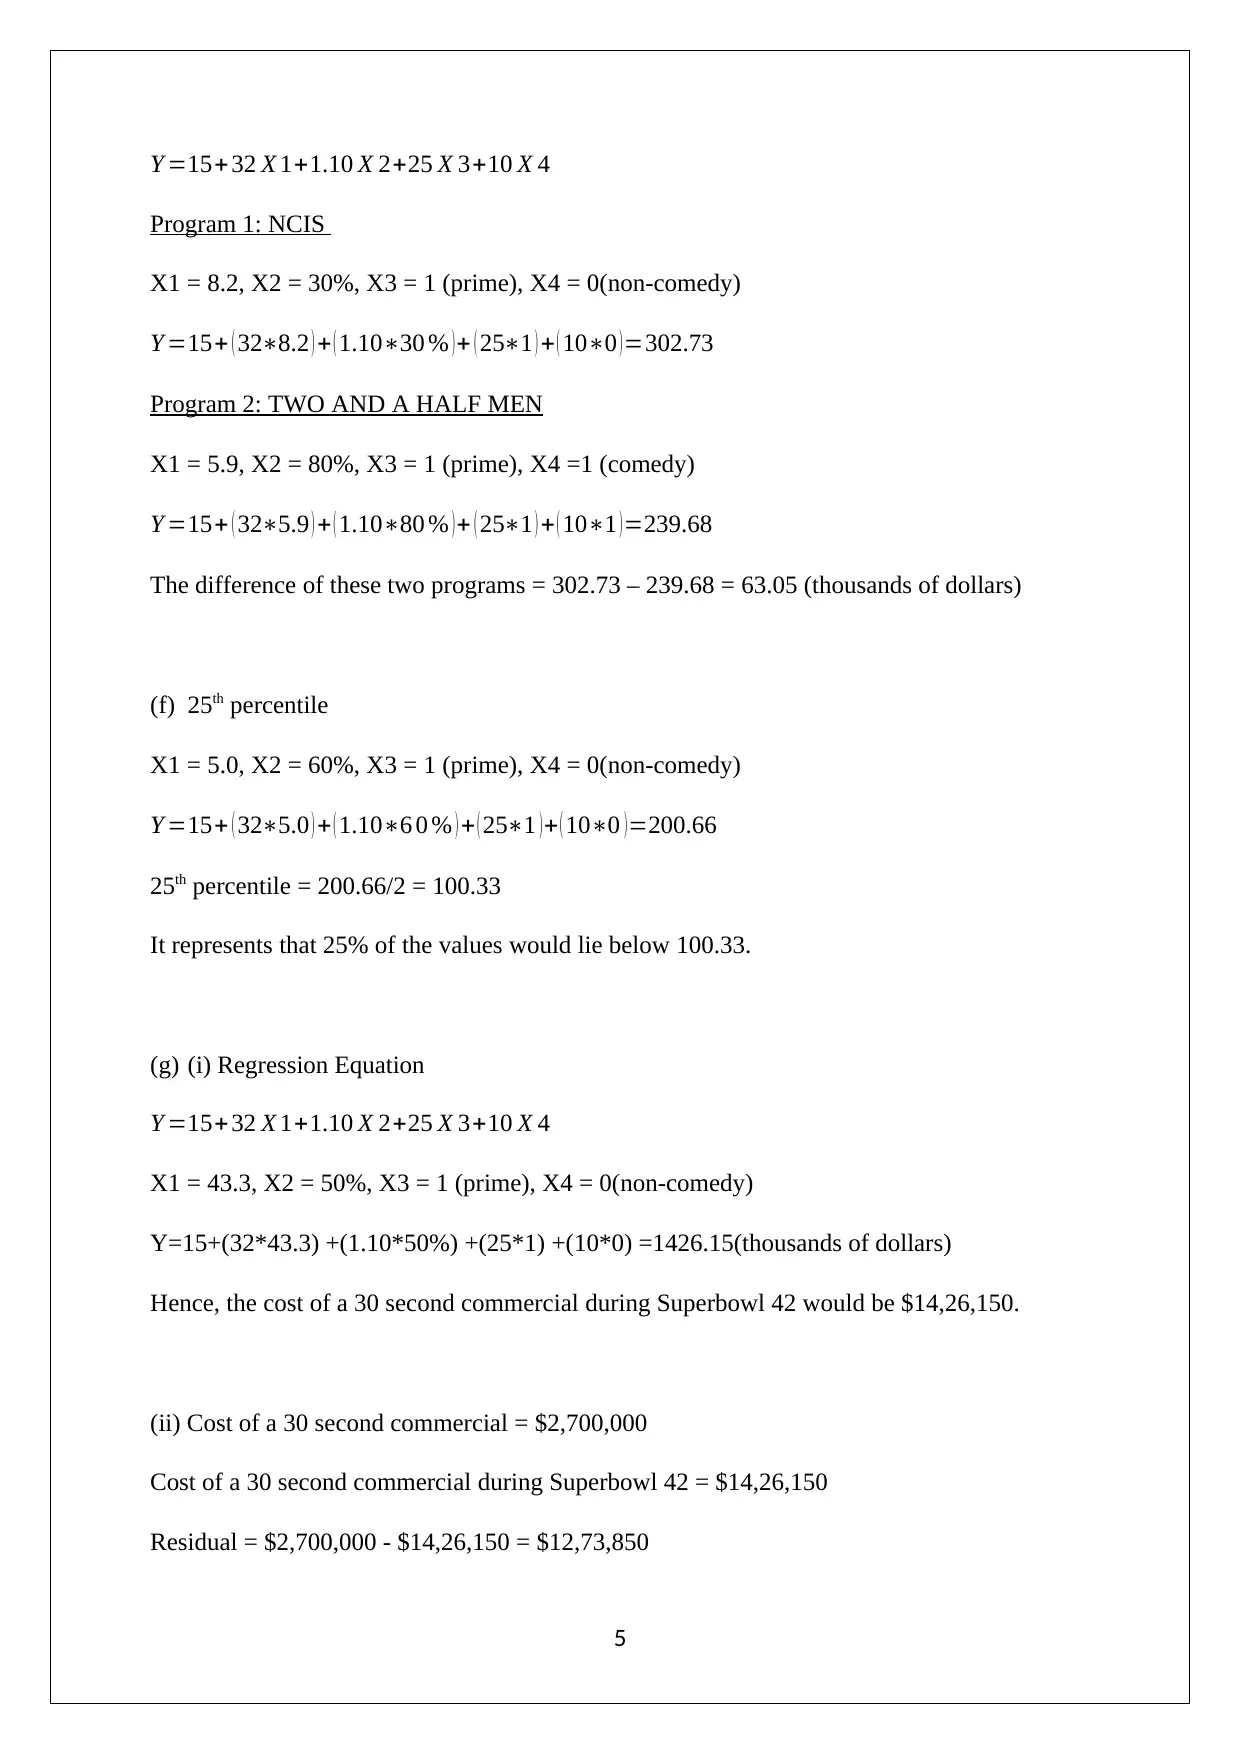
This document presents a comprehensive solution to a statistics assignment, likely a final exam, covering a range of statistical concepts. The solution addresses confidence intervals for both means and proportions, including calculations and interpretations. It also delves into regression analysis, including the calculation of the coefficient of determination, ANOVA tables, and the identification of significant variables. Furthermore, the solution includes the construction of prediction intervals and the application of regression equations to predict commercial costs based on program characteristics. The document concludes with an analysis of outliers and a discussion of the limitations of the statistical model in specific contexts, such as predicting advertising costs during the Super Bowl. The assignment is from the Stern School of Business at New York University.
1 out of 7
Related Documents


Your All-in-One AI-Powered Toolkit for Academic Success.
+13062052269
info@desklib.com
Available 24*7 on WhatsApp / Email
![[object Object]](/_next/static/media/star-bottom.7253800d.svg)
Copyright © 2020–2026 A2Z Services. All Rights Reserved. Developed and managed by ZUCOL.