MIS771 Descriptive Analytics: AusPaper Customer Satisfaction Report
VerifiedAdded on 2023/06/12
|18
|3717
|211
Report
AI Summary
This report presents an empirical analysis of AusPaper's client survey data to understand customer perceptions, satisfaction, and the likelihood of forming strategic alliances. The analysis includes descriptive statistics to summarize customer satisfaction scores and alliance intentions. Regression analysis identifies key factors influencing customer satisfaction, such as product quality, image, product line breadth, and delivery speed. Interaction effects between product line and customer location (ANZ vs. global markets) are also explored. The report concludes with insights into forecasting annual quarterly turnover, providing AusPaper with valuable information for strategic decision-making. This assignment showcases descriptive statistics and visualization techniques, with similar assignments and past papers available on Desklib to aid students in their studies.

Running head: DESCRIPTIVE STATISTICS AND VISUALIZATION
DESCRIPTIVE STATISTICS AND VISUALIZATION
Name of Student
Name of University
Author Note
DESCRIPTIVE STATISTICS AND VISUALIZATION
Name of Student
Name of University
Author Note
Paraphrase This Document
Need a fresh take? Get an instant paraphrase of this document with our AI Paraphraser
1DESCRIPTIVE STATISTICS AND VISUALIZATION
Table of Contents
1. Introduction..............................................................................................................................2
2. Collection of Data........................................................................................................................3
3. Description of the Data................................................................................................................3
4. Analysis of Data..........................................................................................................................4
4.1 Dependent Variable Analysis................................................................................................4
4.2 Factors Influencing Customer satisfaction............................................................................6
4.2.1. Identification of relevant Variable.................................................................................6
4.2.2. Prediction model............................................................................................................6
4.3. Interaction Effect..................................................................................................................9
4.4. Likelihood of building Strategic Alliance of Partnership...................................................10
4.5. Forecasting Annual Quarterly Turnover.............................................................................12
5. Conclusion.................................................................................................................................13
References......................................................................................................................................15
Appendix........................................................................................................................................16
2DESCRIPTIVE STATISTICS AND VISUALIZATION
1. Introduction
AusPaper is a subsidiary of the Australian company, Pinnon Paper Industries, which has
a long history of manufacturing of paper products locally. Aside from the local market, their
market spans 75 countries all over USA, Latin America, Europe, Middle East, Africa, Asia and
the Indian subcontinent where they export their products. AusPaper produced a volume of
619,000 tonnes of paper products in 2013 alone, selling more than 690,000 tonnes to its overseas
and local markets.
There are two main market segments of AusPaper, namely: the newspaper industry with
names like Australian Financial Review and Herald Sun being among the notable newspaper
associated with its products, and secondly the magazine industry with associated names being
Mens’ Style Magazine and Homes and Gardens among others.The company sells its products to
these segments of the market, either directly, whereby it deals with the customer or indirectly via
a broker. However, AusPaper has been anticipating a major shift in the business climate in the
coming seven years or so, despite the fact that their operations have been performing
successfully while enjoying solid financial turnovers over the past two decades. It is believed
that this change is coming about due changing preferences of the end-consumers. The surge in
social media as a medium leading to popularity or e-papers and magazines and instant ews
through social media is believed to influence this change. Therefore, AusPaper management
expressed their need to ensure a strong customer base and strong strategic alliances with clients
in the newspaper and magazine industries. Additionally, plan to instate a formal process to make
them able to forecast financial turnovers as well.
This paper provides an empirical analysis of client response to a survey conducted to
understand the nature of AusPaper’s customers, the existing perception regarding the company
⊘ This is a preview!⊘
Do you want full access?
Subscribe today to unlock all pages.
Trusted by 1+ million students worldwide
3DESCRIPTIVE STATISTICS AND VISUALIZATION
and its products and the likelihood of establishing long-term strategic alliance with the company
and hence discusses the findings.
2. Collection of Data
To meet the criteria laid down by AusPaper, the market research company
ANALYTICS7established contact with the clients of AusPaper asking them to completely
answer a set of question in a survey online. The survey questionnaire gathered data on key
variable factors necessary for addressing the analysis objectives. Additionally, historicalsales
turnover data in format of annual four quarters was collected from AusPaper’s data warehouse.
3. Description of the Data
The primary data collected from the firm managers of clients had 200 observations encompassing
18 variables. The primary dataset consists of data addressing two different aspects. Firstly, the
perceptions of clients on AusPaper’s performance. The respondents were asked to rate the company on 13
different attributes which characterized its performance using a 0 – 10 ordinal scale, with 10 standing for
“Excellent” and “Poor” being represented by 0. Secondly, the purchase outcomes and business
relationships for example, satisfaction with AusPaper’s products and whether the responding client firm
would consider forming a strategic alliance or partnership with the company which is has a binary scale
(Yes/No). Another aspect covered was information regarding size of market the client claimed, how long
they have had purchase relationshipand the quarterly sales turnover of AusPaper. These were obtained
from AusPaper’s data warehouse.
Paraphrase This Document
Need a fresh take? Get an instant paraphrase of this document with our AI Paraphraser
4DESCRIPTIVE STATISTICS AND VISUALIZATION
4. Analysis of Data
4.1 Dependent Variable Analysis
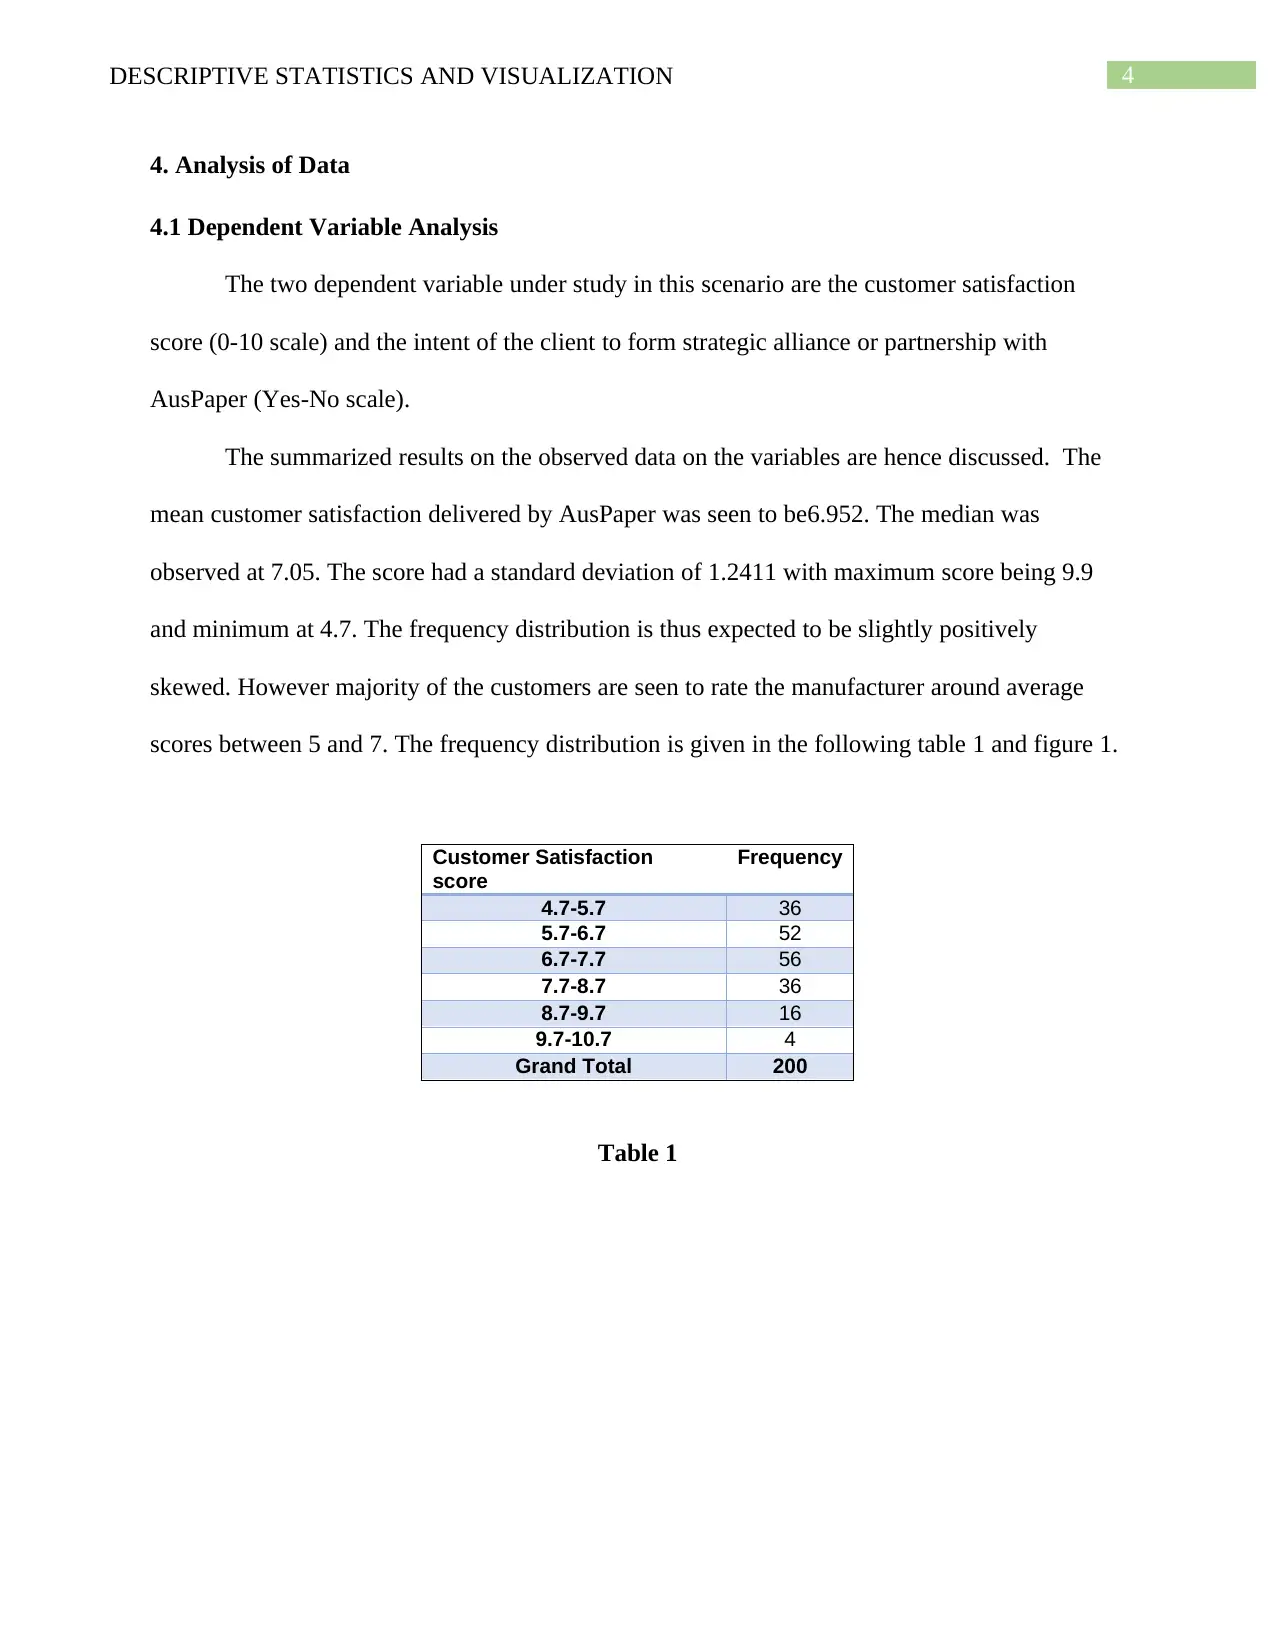
The two dependent variable under study in this scenario are the customer satisfaction
score (0-10 scale) and the intent of the client to form strategic alliance or partnership with
AusPaper (Yes-No scale).
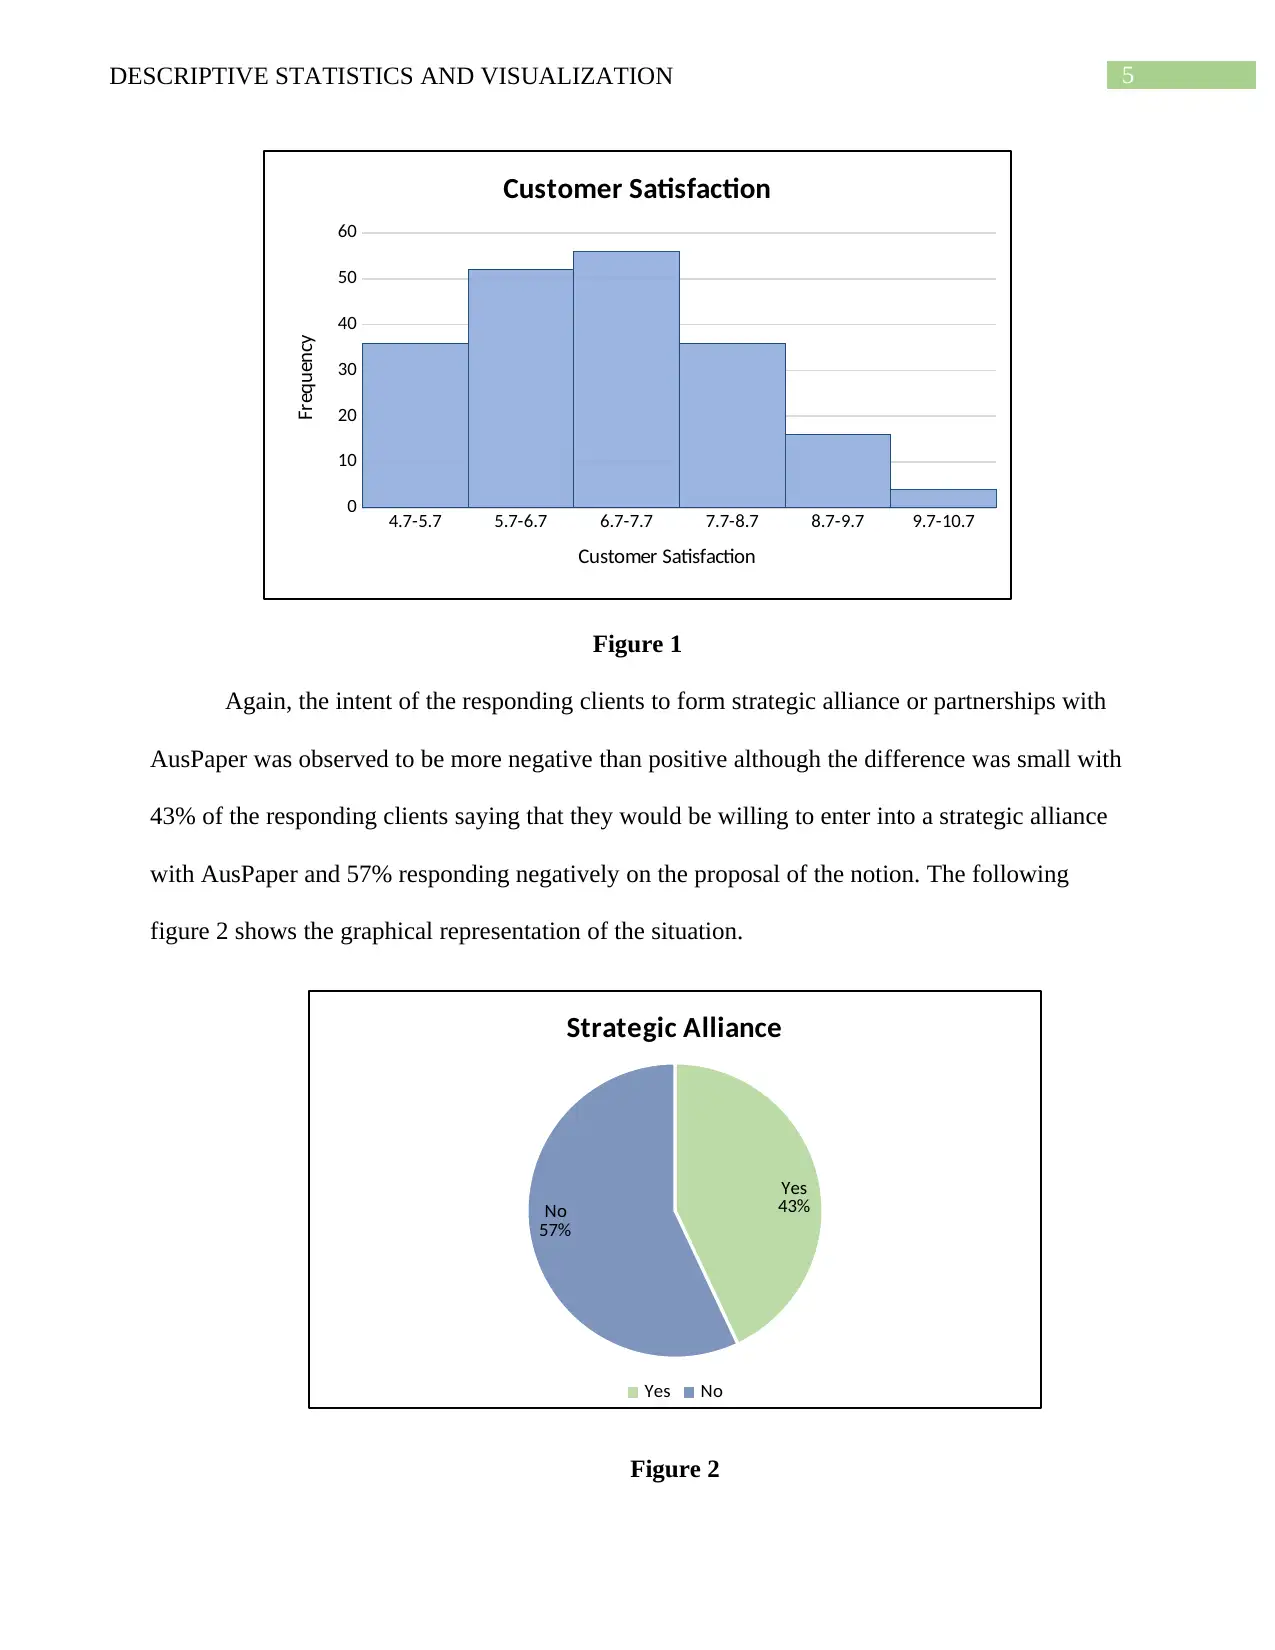
The summarized results on the observed data on the variables are hence discussed. The
mean customer satisfaction delivered by AusPaper was seen to be6.952. The median was
observed at 7.05. The score had a standard deviation of 1.2411 with maximum score being 9.9
and minimum at 4.7. The frequency distribution is thus expected to be slightly positively
skewed. However majority of the customers are seen to rate the manufacturer around average
scores between 5 and 7. The frequency distribution is given in the following table 1 and figure 1.
Customer Satisfaction
score
Frequency
4.7-5.7 36
5.7-6.7 52
6.7-7.7 56
7.7-8.7 36
8.7-9.7 16
9.7-10.7 4
Grand Total 200
Table 1
4. Analysis of Data
4.1 Dependent Variable Analysis
The two dependent variable under study in this scenario are the customer satisfaction
score (0-10 scale) and the intent of the client to form strategic alliance or partnership with
AusPaper (Yes-No scale).
The summarized results on the observed data on the variables are hence discussed. The
mean customer satisfaction delivered by AusPaper was seen to be6.952. The median was
observed at 7.05. The score had a standard deviation of 1.2411 with maximum score being 9.9
and minimum at 4.7. The frequency distribution is thus expected to be slightly positively
skewed. However majority of the customers are seen to rate the manufacturer around average
scores between 5 and 7. The frequency distribution is given in the following table 1 and figure 1.
Customer Satisfaction
score
Frequency
4.7-5.7 36
5.7-6.7 52
6.7-7.7 56
7.7-8.7 36
8.7-9.7 16
9.7-10.7 4
Grand Total 200
Table 1
5DESCRIPTIVE STATISTICS AND VISUALIZATION
4.7-5.7 5.7-6.7 6.7-7.7 7.7-8.7 8.7-9.7 9.7-10.7
0
10
20
30
40
50
60
Customer Satisfaction
Customer Satisfaction
Frequency
Figure 1
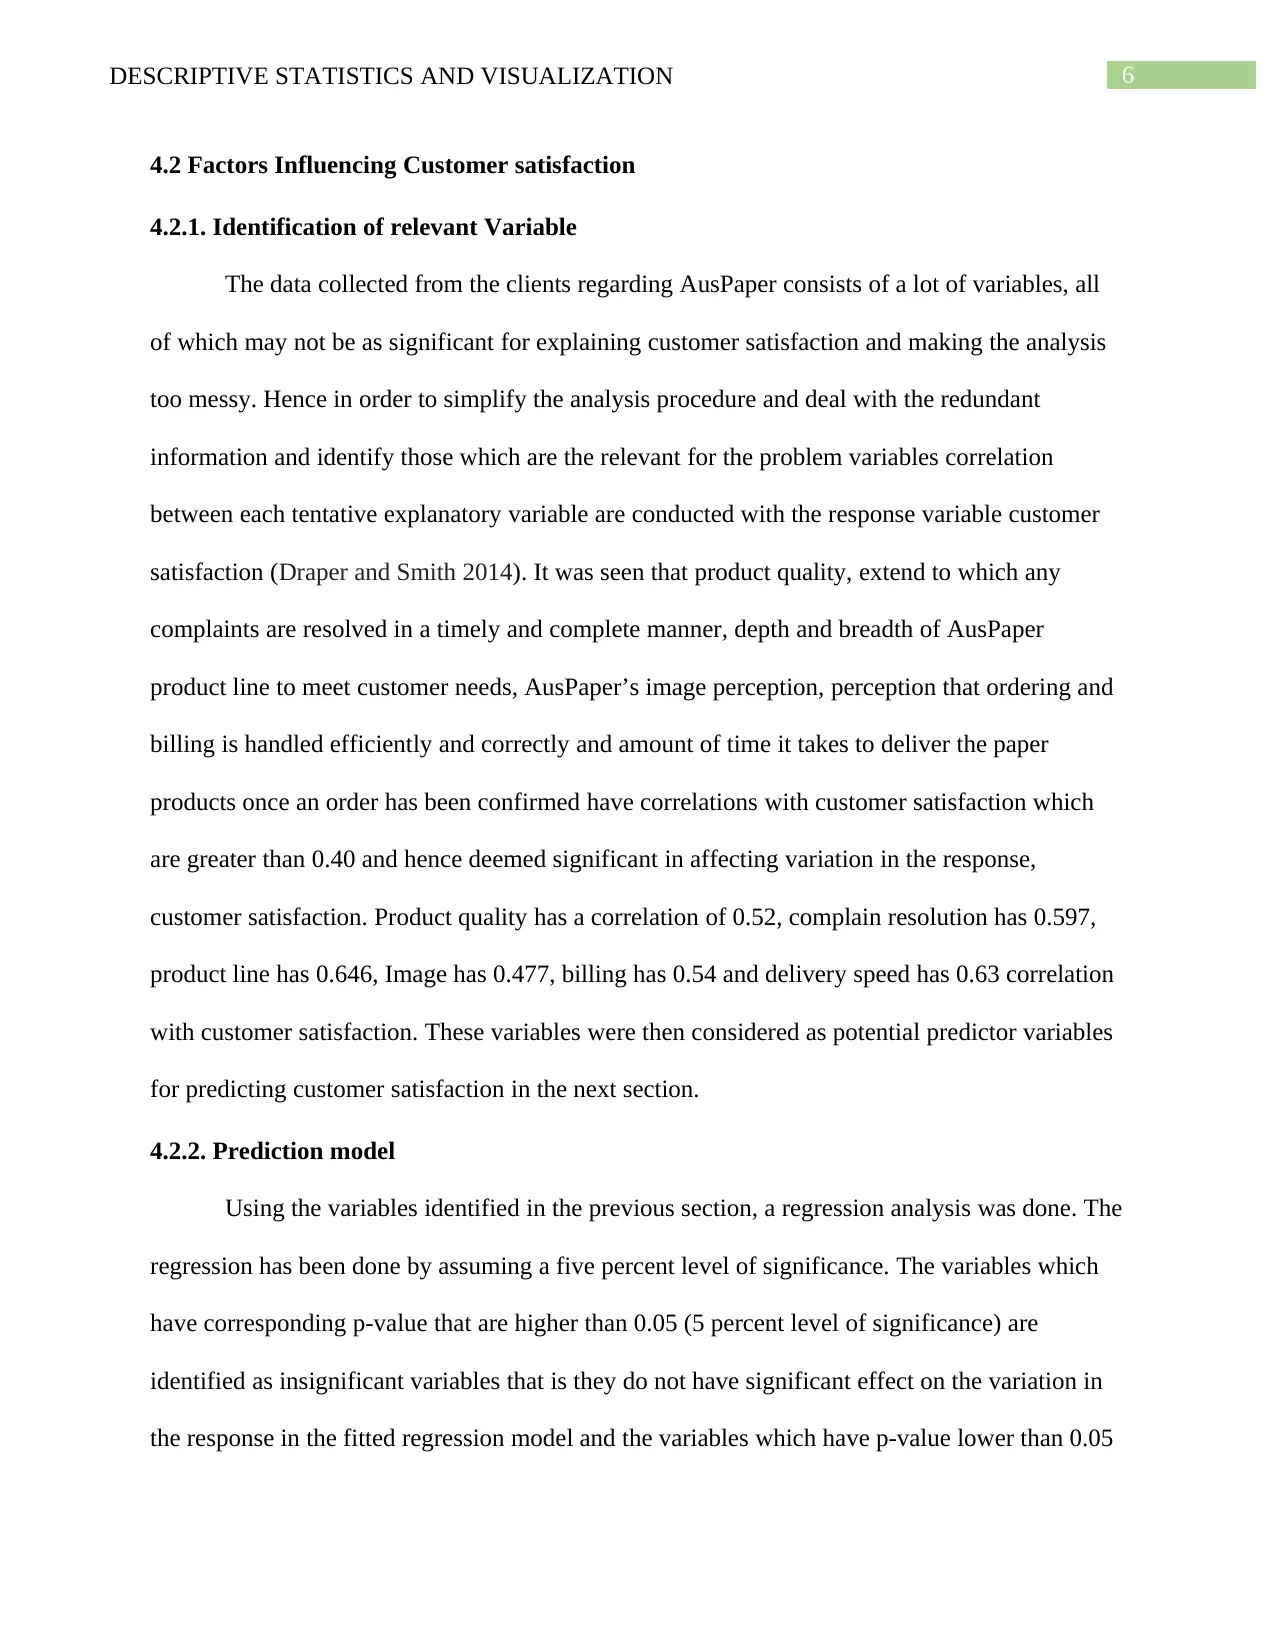
Again, the intent of the responding clients to form strategic alliance or partnerships with
AusPaper was observed to be more negative than positive although the difference was small with
43% of the responding clients saying that they would be willing to enter into a strategic alliance
with AusPaper and 57% responding negatively on the proposal of the notion. The following
figure 2 shows the graphical representation of the situation.
Yes
43%No
57%
Strategic Alliance
Yes No
Figure 2
4.7-5.7 5.7-6.7 6.7-7.7 7.7-8.7 8.7-9.7 9.7-10.7
0
10
20
30
40
50
60
Customer Satisfaction
Customer Satisfaction
Frequency
Figure 1
Again, the intent of the responding clients to form strategic alliance or partnerships with
AusPaper was observed to be more negative than positive although the difference was small with
43% of the responding clients saying that they would be willing to enter into a strategic alliance
with AusPaper and 57% responding negatively on the proposal of the notion. The following
figure 2 shows the graphical representation of the situation.
Yes
43%No
57%
Strategic Alliance
Yes No
Figure 2
⊘ This is a preview!⊘
Do you want full access?
Subscribe today to unlock all pages.
Trusted by 1+ million students worldwide
6DESCRIPTIVE STATISTICS AND VISUALIZATION
4.2 Factors Influencing Customer satisfaction
4.2.1. Identification of relevant Variable
The data collected from the clients regarding AusPaper consists of a lot of variables, all
of which may not be as significant for explaining customer satisfaction and making the analysis
too messy. Hence in order to simplify the analysis procedure and deal with the redundant
information and identify those which are the relevant for the problem variables correlation
between each tentative explanatory variable are conducted with the response variable customer
satisfaction (Draper and Smith 2014). It was seen that product quality, extend to which any
complaints are resolved in a timely and complete manner, depth and breadth of AusPaper
product line to meet customer needs, AusPaper’s image perception, perception that ordering and
billing is handled efficiently and correctly and amount of time it takes to deliver the paper
products once an order has been confirmed have correlations with customer satisfaction which
are greater than 0.40 and hence deemed significant in affecting variation in the response,
customer satisfaction. Product quality has a correlation of 0.52, complain resolution has 0.597,
product line has 0.646, Image has 0.477, billing has 0.54 and delivery speed has 0.63 correlation
with customer satisfaction. These variables were then considered as potential predictor variables
for predicting customer satisfaction in the next section.
4.2.2. Prediction model
Using the variables identified in the previous section, a regression analysis was done. The
regression has been done by assuming a five percent level of significance. The variables which
have corresponding p-value that are higher than 0.05 (5 percent level of significance) are
identified as insignificant variables that is they do not have significant effect on the variation in
the response in the fitted regression model and the variables which have p-value lower than 0.05
Paraphrase This Document
Need a fresh take? Get an instant paraphrase of this document with our AI Paraphraser
7DESCRIPTIVE STATISTICS AND VISUALIZATION
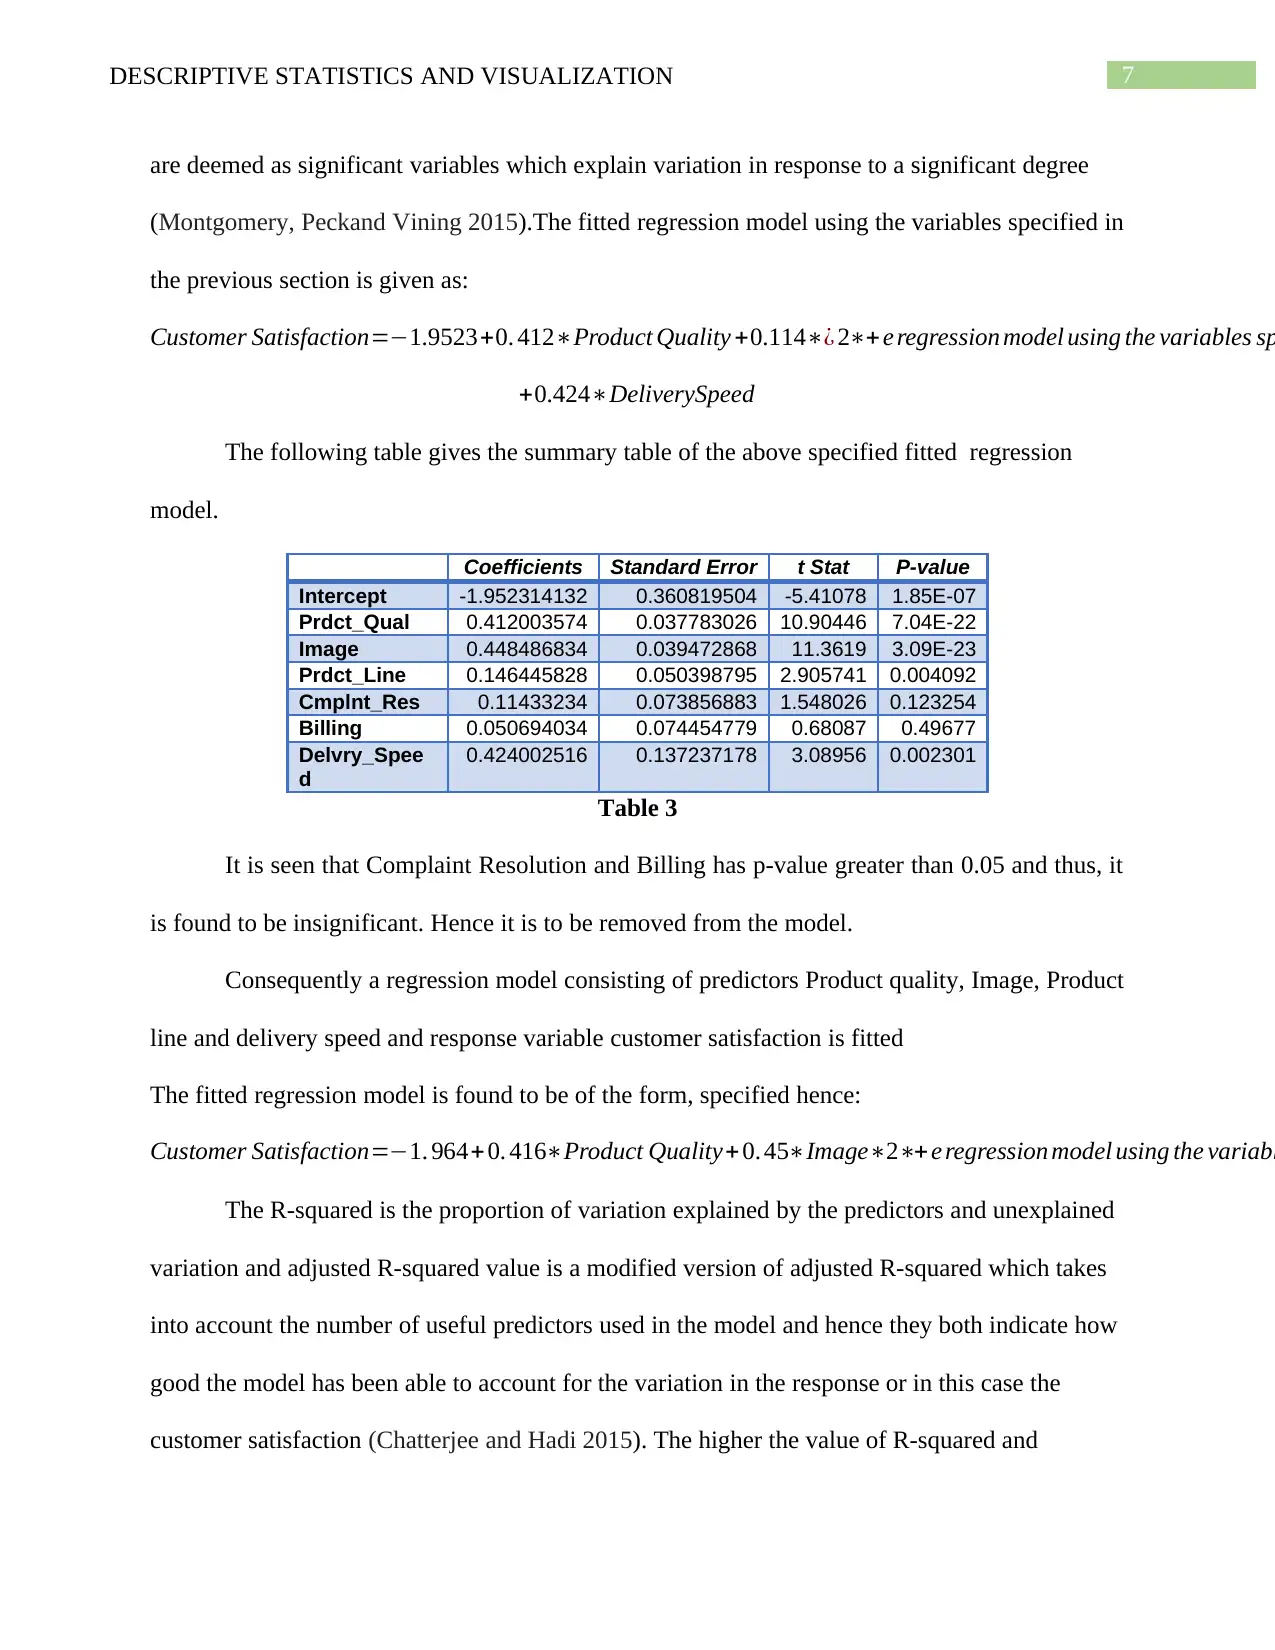
are deemed as significant variables which explain variation in response to a significant degree
(Montgomery, Peckand Vining 2015).The fitted regression model using the variables specified in
the previous section is given as:
Customer Satisfaction=−1.9523+0. 412∗Product Quality +0.114∗¿ 2∗+ e regression model using the variables sp
+0.424∗DeliverySpeed
The following table gives the summary table of the above specified fitted regression
model.
Coefficients Standard Error t Stat P-value
Intercept -1.952314132 0.360819504 -5.41078 1.85E-07
Prdct_Qual 0.412003574 0.037783026 10.90446 7.04E-22
Image 0.448486834 0.039472868 11.3619 3.09E-23
Prdct_Line 0.146445828 0.050398795 2.905741 0.004092
Cmplnt_Res 0.11433234 0.073856883 1.548026 0.123254
Billing 0.050694034 0.074454779 0.68087 0.49677
Delvry_Spee
d
0.424002516 0.137237178 3.08956 0.002301
Table 3
It is seen that Complaint Resolution and Billing has p-value greater than 0.05 and thus, it
is found to be insignificant. Hence it is to be removed from the model.
Consequently a regression model consisting of predictors Product quality, Image, Product
line and delivery speed and response variable customer satisfaction is fitted
The fitted regression model is found to be of the form, specified hence:
Customer Satisfaction=−1. 964+0. 416∗Product Quality+ 0. 45∗Image∗2∗+ e regression model using the variabl
The R-squared is the proportion of variation explained by the predictors and unexplained
variation and adjusted R-squared value is a modified version of adjusted R-squared which takes
into account the number of useful predictors used in the model and hence they both indicate how
good the model has been able to account for the variation in the response or in this case the
customer satisfaction (Chatterjee and Hadi 2015). The higher the value of R-squared and
8DESCRIPTIVE STATISTICS AND VISUALIZATION
adjusted R-squared, it is suggested that better is the fit of the model. The model was found to
have R-squared value of 0.7787 and adjusted R-squared value of 0.77419 both of which are
reasonably good.
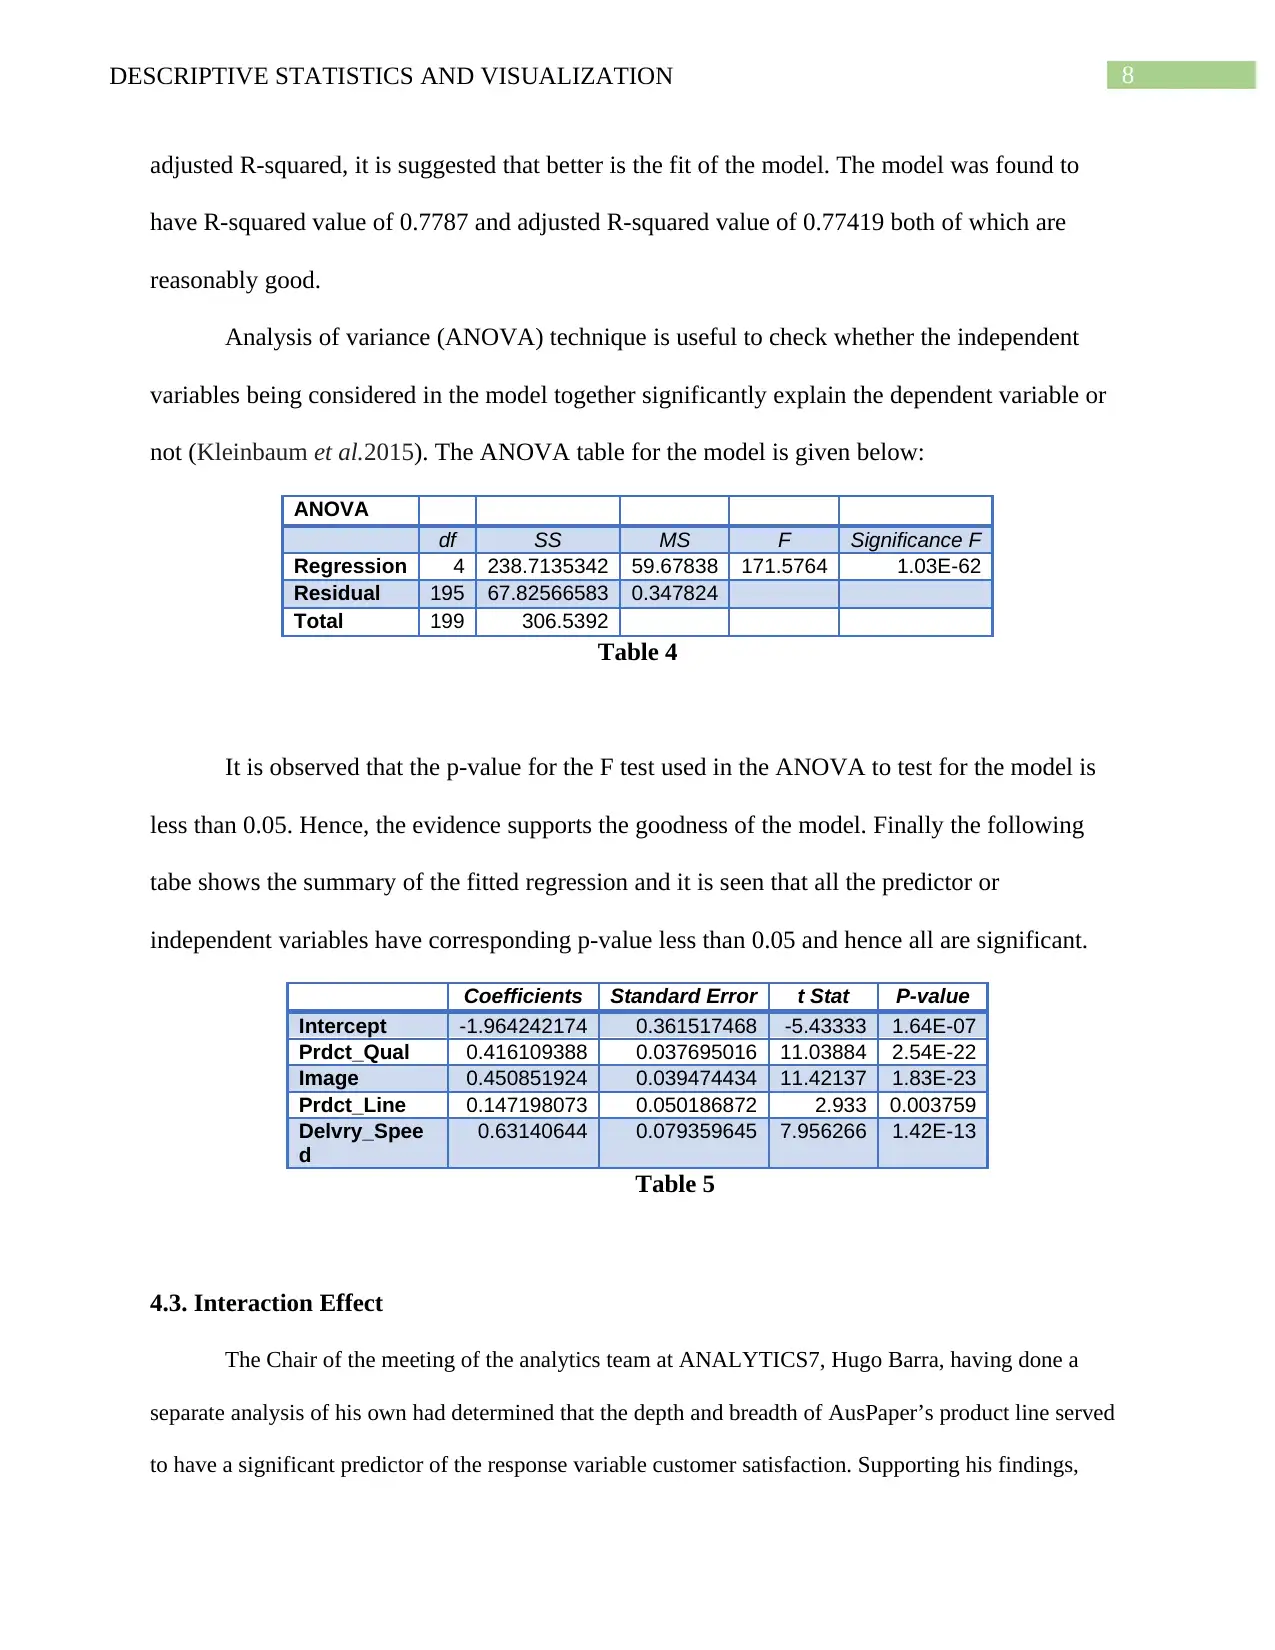
Analysis of variance (ANOVA) technique is useful to check whether the independent
variables being considered in the model together significantly explain the dependent variable or
not (Kleinbaum et al.2015). The ANOVA table for the model is given below:
ANOVA
df SS MS F Significance F
Regression 4 238.7135342 59.67838 171.5764 1.03E-62
Residual 195 67.82566583 0.347824
Total 199 306.5392
Table 4
It is observed that the p-value for the F test used in the ANOVA to test for the model is
less than 0.05. Hence, the evidence supports the goodness of the model. Finally the following
tabe shows the summary of the fitted regression and it is seen that all the predictor or
independent variables have corresponding p-value less than 0.05 and hence all are significant.
Coefficients Standard Error t Stat P-value
Intercept -1.964242174 0.361517468 -5.43333 1.64E-07
Prdct_Qual 0.416109388 0.037695016 11.03884 2.54E-22
Image 0.450851924 0.039474434 11.42137 1.83E-23
Prdct_Line 0.147198073 0.050186872 2.933 0.003759
Delvry_Spee
d
0.63140644 0.079359645 7.956266 1.42E-13
Table 5
4.3. Interaction Effect
The Chair of the meeting of the analytics team at ANALYTICS7, Hugo Barra, having done a
separate analysis of his own had determined that the depth and breadth of AusPaper’s product line served
to have a significant predictor of the response variable customer satisfaction. Supporting his findings,
adjusted R-squared, it is suggested that better is the fit of the model. The model was found to
have R-squared value of 0.7787 and adjusted R-squared value of 0.77419 both of which are
reasonably good.
Analysis of variance (ANOVA) technique is useful to check whether the independent
variables being considered in the model together significantly explain the dependent variable or
not (Kleinbaum et al.2015). The ANOVA table for the model is given below:
ANOVA
df SS MS F Significance F
Regression 4 238.7135342 59.67838 171.5764 1.03E-62
Residual 195 67.82566583 0.347824
Total 199 306.5392
Table 4
It is observed that the p-value for the F test used in the ANOVA to test for the model is
less than 0.05. Hence, the evidence supports the goodness of the model. Finally the following
tabe shows the summary of the fitted regression and it is seen that all the predictor or
independent variables have corresponding p-value less than 0.05 and hence all are significant.
Coefficients Standard Error t Stat P-value
Intercept -1.964242174 0.361517468 -5.43333 1.64E-07
Prdct_Qual 0.416109388 0.037695016 11.03884 2.54E-22
Image 0.450851924 0.039474434 11.42137 1.83E-23
Prdct_Line 0.147198073 0.050186872 2.933 0.003759
Delvry_Spee
d
0.63140644 0.079359645 7.956266 1.42E-13
Table 5
4.3. Interaction Effect
The Chair of the meeting of the analytics team at ANALYTICS7, Hugo Barra, having done a
separate analysis of his own had determined that the depth and breadth of AusPaper’s product line served
to have a significant predictor of the response variable customer satisfaction. Supporting his findings,
⊘ This is a preview!⊘
Do you want full access?
Subscribe today to unlock all pages.
Trusted by 1+ million students worldwide
9DESCRIPTIVE STATISTICS AND VISUALIZATION
prior research also shows that the strength of the relationship between product line and customer
satisfaction may vary as per the location of the customer. This implies that customers from global markets
have preferences and needs that are possibly more diverse in comparison to those who may be from one
particular region like ANZ. Therefore, the relationship between a more diversified product line and
corresponding customer satisfaction is anticipated to be more prominent in global markets which are
outside the ANZ region. This section looks into scrutinizing this model setup and gauges the interaction
effects among these variables that Hugo had pointed out.
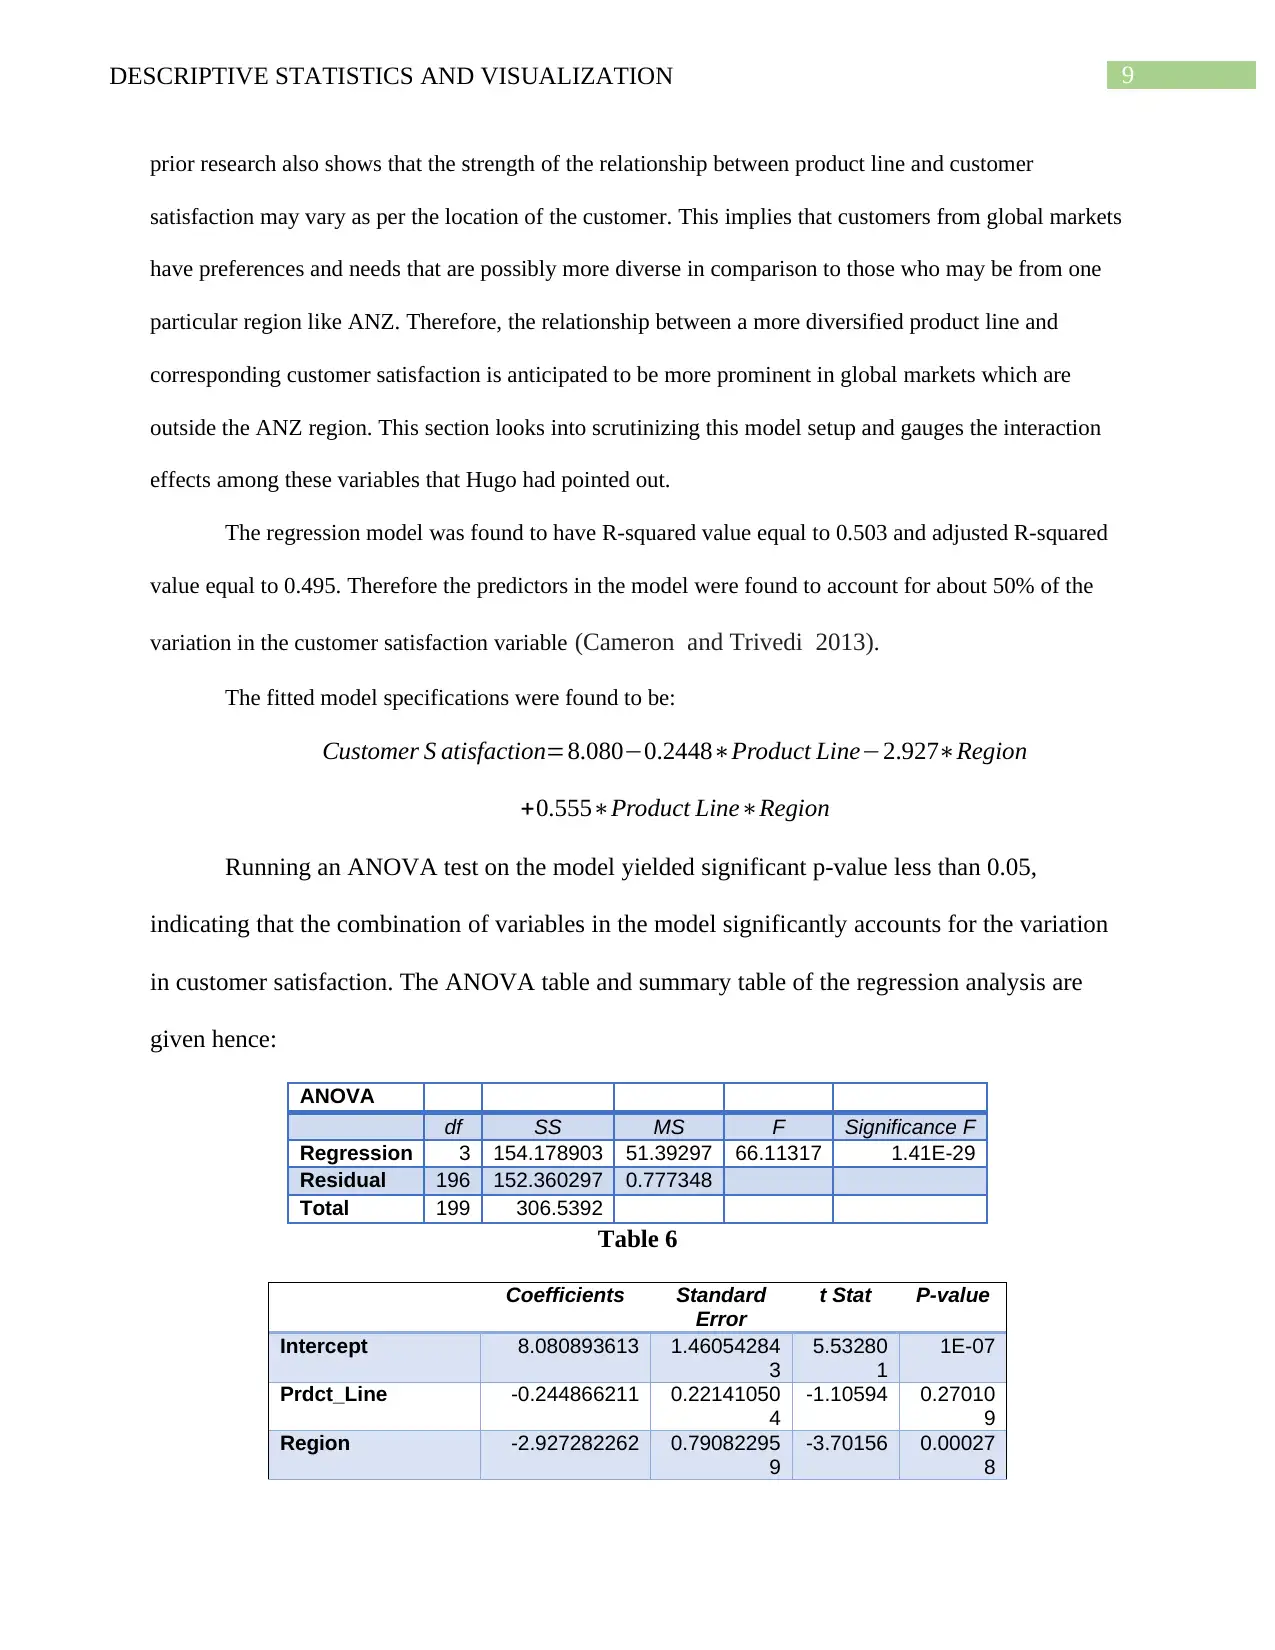
The regression model was found to have R-squared value equal to 0.503 and adjusted R-squared
value equal to 0.495. Therefore the predictors in the model were found to account for about 50% of the
variation in the customer satisfaction variable (Cameron and Trivedi 2013).
The fitted model specifications were found to be:
Customer S atisfaction=8.080−0.2448∗Product Line−2.927∗Region
+0.555∗Product Line∗Region
Running an ANOVA test on the model yielded significant p-value less than 0.05,
indicating that the combination of variables in the model significantly accounts for the variation
in customer satisfaction. The ANOVA table and summary table of the regression analysis are
given hence:
ANOVA
df SS MS F Significance F
Regression 3 154.178903 51.39297 66.11317 1.41E-29
Residual 196 152.360297 0.777348
Total 199 306.5392
Table 6
Coefficients Standard
Error
t Stat P-value
Intercept 8.080893613 1.46054284
3
5.53280
1
1E-07
Prdct_Line -0.244866211 0.22141050
4
-1.10594 0.27010
9
Region -2.927282262 0.79082295
9
-3.70156 0.00027
8
prior research also shows that the strength of the relationship between product line and customer
satisfaction may vary as per the location of the customer. This implies that customers from global markets
have preferences and needs that are possibly more diverse in comparison to those who may be from one
particular region like ANZ. Therefore, the relationship between a more diversified product line and
corresponding customer satisfaction is anticipated to be more prominent in global markets which are
outside the ANZ region. This section looks into scrutinizing this model setup and gauges the interaction
effects among these variables that Hugo had pointed out.
The regression model was found to have R-squared value equal to 0.503 and adjusted R-squared
value equal to 0.495. Therefore the predictors in the model were found to account for about 50% of the
variation in the customer satisfaction variable (Cameron and Trivedi 2013).
The fitted model specifications were found to be:
Customer S atisfaction=8.080−0.2448∗Product Line−2.927∗Region
+0.555∗Product Line∗Region
Running an ANOVA test on the model yielded significant p-value less than 0.05,
indicating that the combination of variables in the model significantly accounts for the variation
in customer satisfaction. The ANOVA table and summary table of the regression analysis are
given hence:
ANOVA
df SS MS F Significance F
Regression 3 154.178903 51.39297 66.11317 1.41E-29
Residual 196 152.360297 0.777348
Total 199 306.5392
Table 6
Coefficients Standard
Error
t Stat P-value
Intercept 8.080893613 1.46054284
3
5.53280
1
1E-07
Prdct_Line -0.244866211 0.22141050
4
-1.10594 0.27010
9
Region -2.927282262 0.79082295
9
-3.70156 0.00027
8
Paraphrase This Document
Need a fresh take? Get an instant paraphrase of this document with our AI Paraphraser
10DESCRIPTIVE STATISTICS AND VISUALIZATION
Region*Productlin
e
0.555042054 0.12413688
2
4.47121 1.32E-05
Table 7
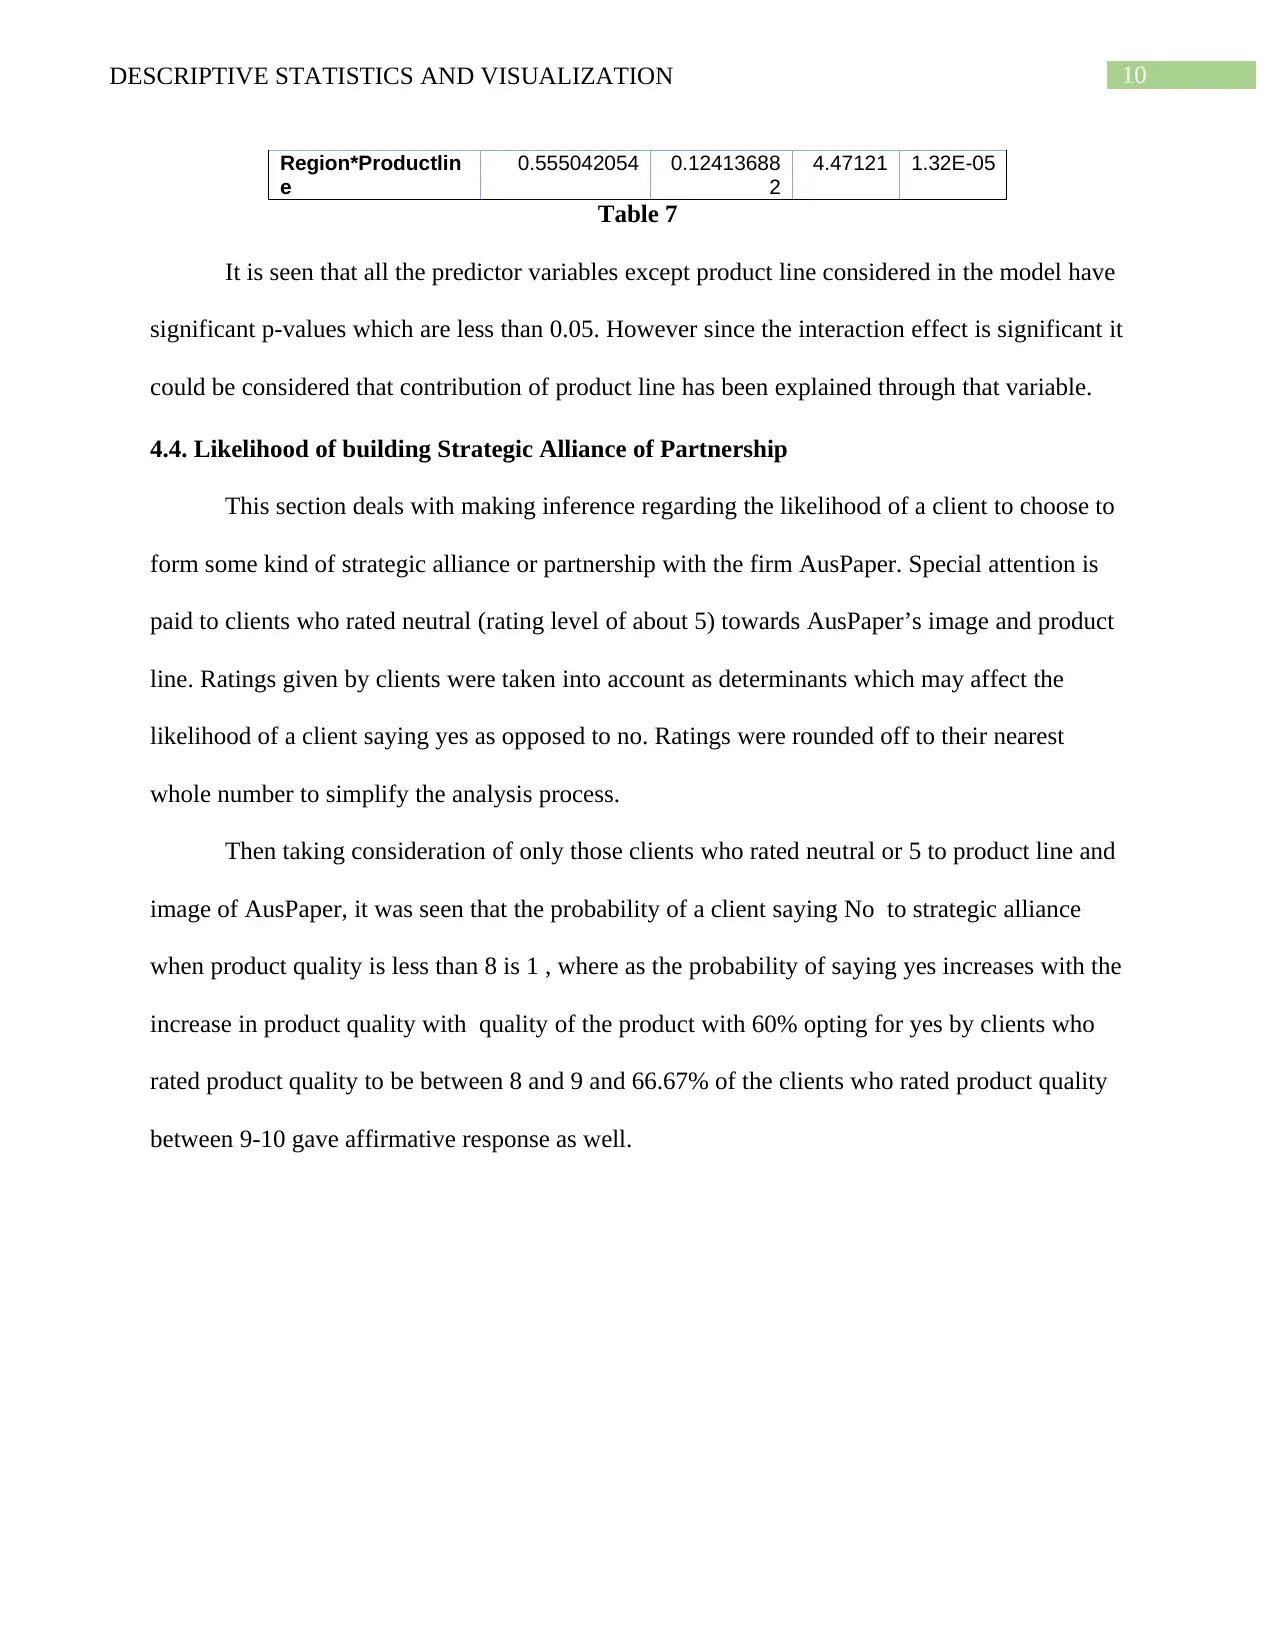
It is seen that all the predictor variables except product line considered in the model have
significant p-values which are less than 0.05. However since the interaction effect is significant it
could be considered that contribution of product line has been explained through that variable.
4.4. Likelihood of building Strategic Alliance of Partnership
This section deals with making inference regarding the likelihood of a client to choose to
form some kind of strategic alliance or partnership with the firm AusPaper. Special attention is
paid to clients who rated neutral (rating level of about 5) towards AusPaper’s image and product
line. Ratings given by clients were taken into account as determinants which may affect the
likelihood of a client saying yes as opposed to no. Ratings were rounded off to their nearest
whole number to simplify the analysis process.
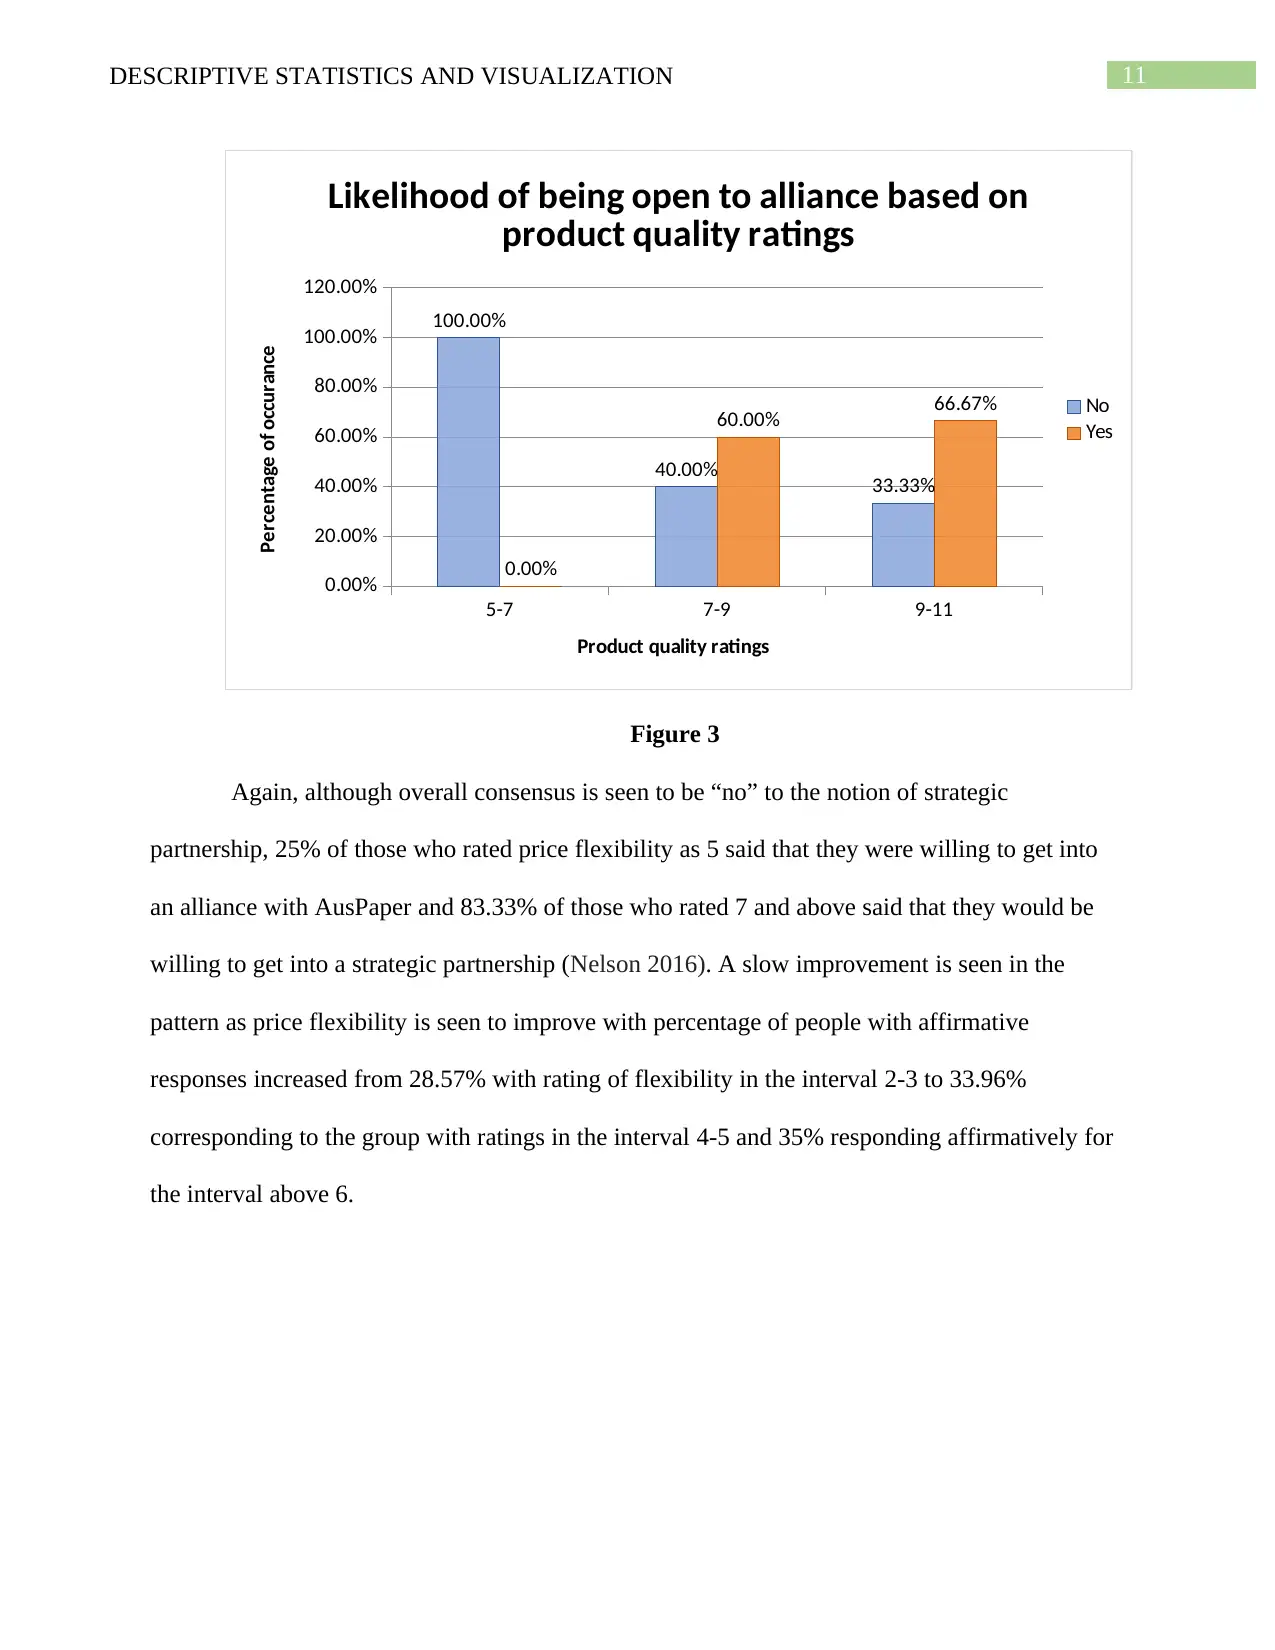
Then taking consideration of only those clients who rated neutral or 5 to product line and
image of AusPaper, it was seen that the probability of a client saying No to strategic alliance
when product quality is less than 8 is 1 , where as the probability of saying yes increases with the
increase in product quality with quality of the product with 60% opting for yes by clients who
rated product quality to be between 8 and 9 and 66.67% of the clients who rated product quality
between 9-10 gave affirmative response as well.
Region*Productlin
e
0.555042054 0.12413688
2
4.47121 1.32E-05
Table 7
It is seen that all the predictor variables except product line considered in the model have
significant p-values which are less than 0.05. However since the interaction effect is significant it
could be considered that contribution of product line has been explained through that variable.
4.4. Likelihood of building Strategic Alliance of Partnership
This section deals with making inference regarding the likelihood of a client to choose to
form some kind of strategic alliance or partnership with the firm AusPaper. Special attention is
paid to clients who rated neutral (rating level of about 5) towards AusPaper’s image and product
line. Ratings given by clients were taken into account as determinants which may affect the
likelihood of a client saying yes as opposed to no. Ratings were rounded off to their nearest
whole number to simplify the analysis process.
Then taking consideration of only those clients who rated neutral or 5 to product line and
image of AusPaper, it was seen that the probability of a client saying No to strategic alliance
when product quality is less than 8 is 1 , where as the probability of saying yes increases with the
increase in product quality with quality of the product with 60% opting for yes by clients who
rated product quality to be between 8 and 9 and 66.67% of the clients who rated product quality
between 9-10 gave affirmative response as well.
11DESCRIPTIVE STATISTICS AND VISUALIZATION
5-7 7-9 9-11
0.00%
20.00%
40.00%
60.00%
80.00%
100.00%
120.00%
100.00%
40.00% 33.33%
0.00%
60.00% 66.67%
Likelihood of being open to alliance based on
product quality ratings
No
Yes
Product quality ratings
Percentage of occurance
Figure 3
Again, although overall consensus is seen to be “no” to the notion of strategic
partnership, 25% of those who rated price flexibility as 5 said that they were willing to get into
an alliance with AusPaper and 83.33% of those who rated 7 and above said that they would be
willing to get into a strategic partnership (Nelson 2016). A slow improvement is seen in the
pattern as price flexibility is seen to improve with percentage of people with affirmative
responses increased from 28.57% with rating of flexibility in the interval 2-3 to 33.96%
corresponding to the group with ratings in the interval 4-5 and 35% responding affirmatively for
the interval above 6.
⊘ This is a preview!⊘
Do you want full access?
Subscribe today to unlock all pages.
Trusted by 1+ million students worldwide
1 out of 18
Related Documents


Your All-in-One AI-Powered Toolkit for Academic Success.
+13062052269
info@desklib.com
Available 24*7 on WhatsApp / Email
![[object Object]](/_next/static/media/star-bottom.7253800d.svg)
Unlock your academic potential
Copyright © 2020–2026 A2Z Services. All Rights Reserved. Developed and managed by ZUCOL.