Lab Report: Determining Glucose Levels in Urine Samples
VerifiedAdded on 2023/01/23
|5
|1300
|87
Report
AI Summary
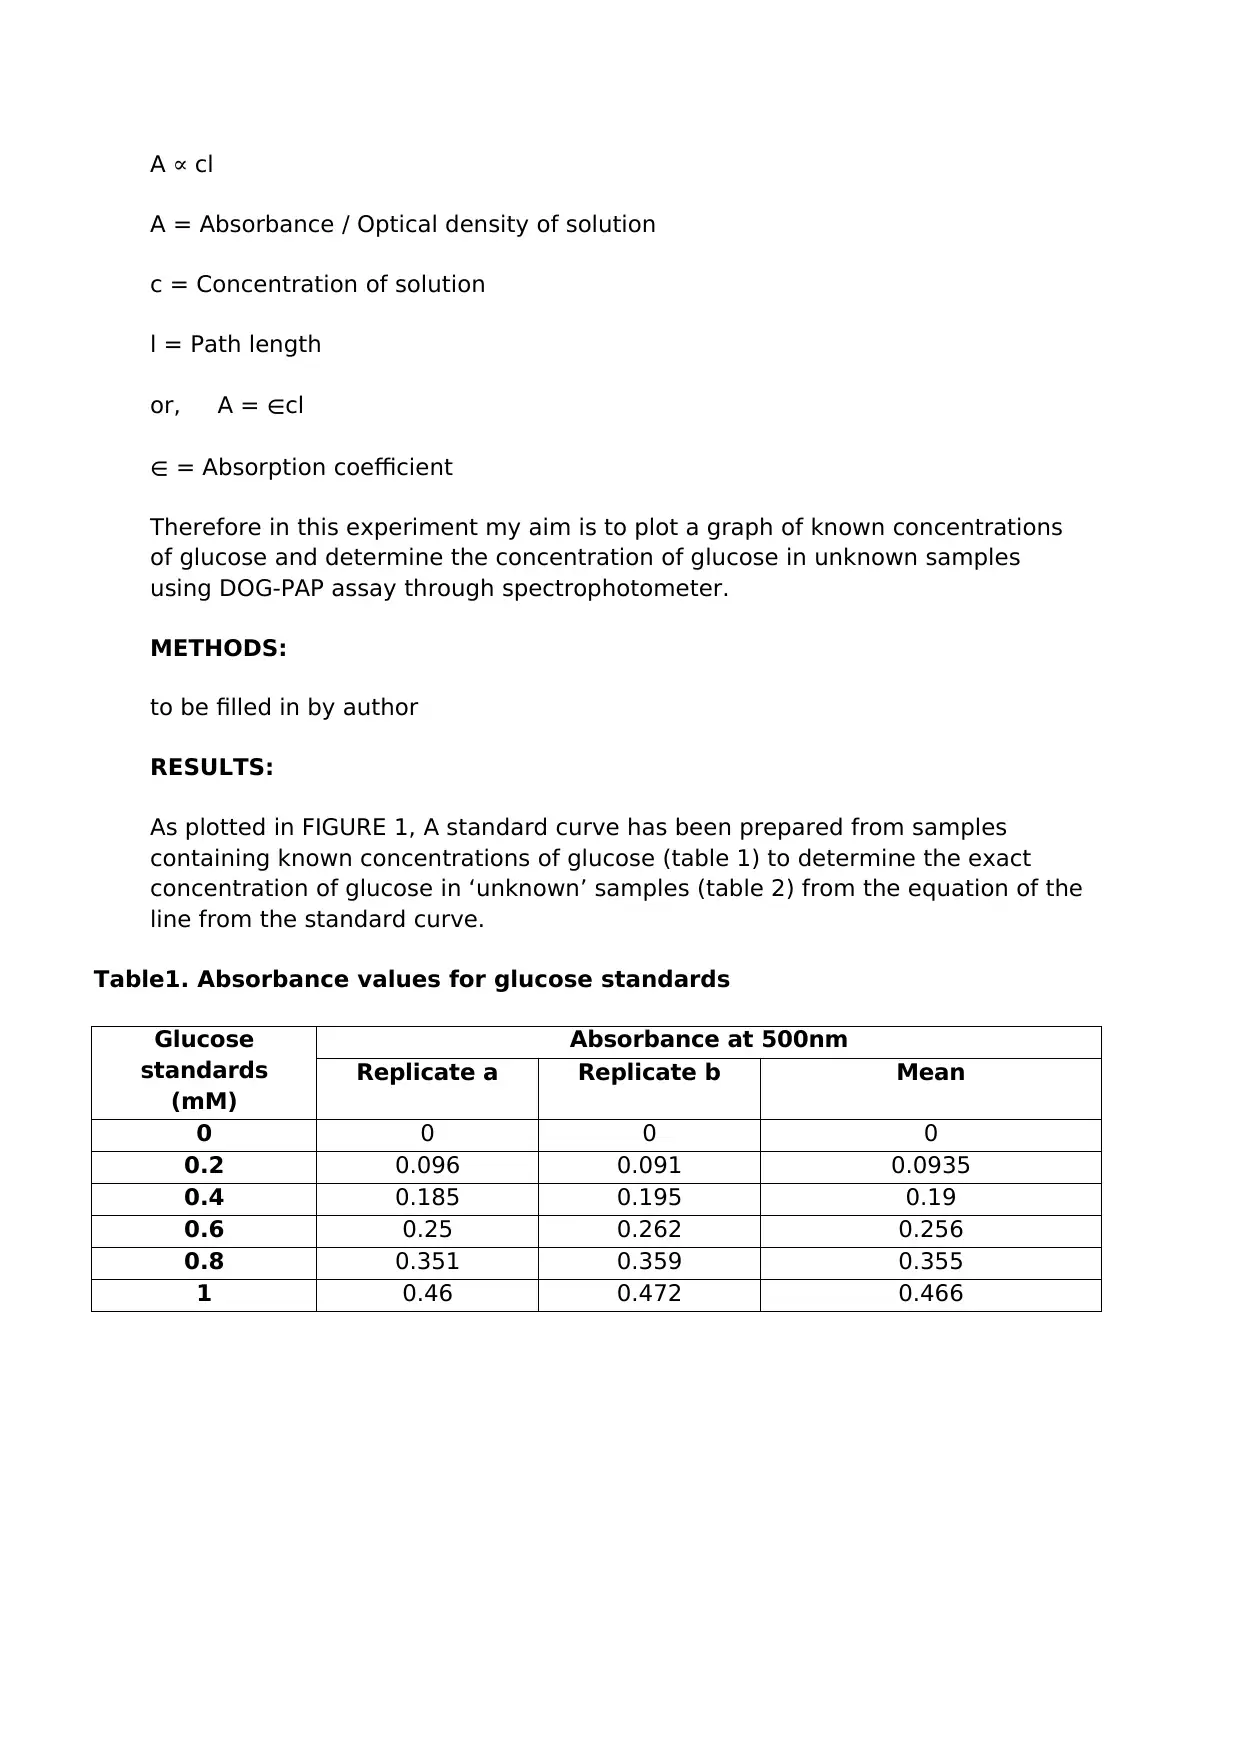
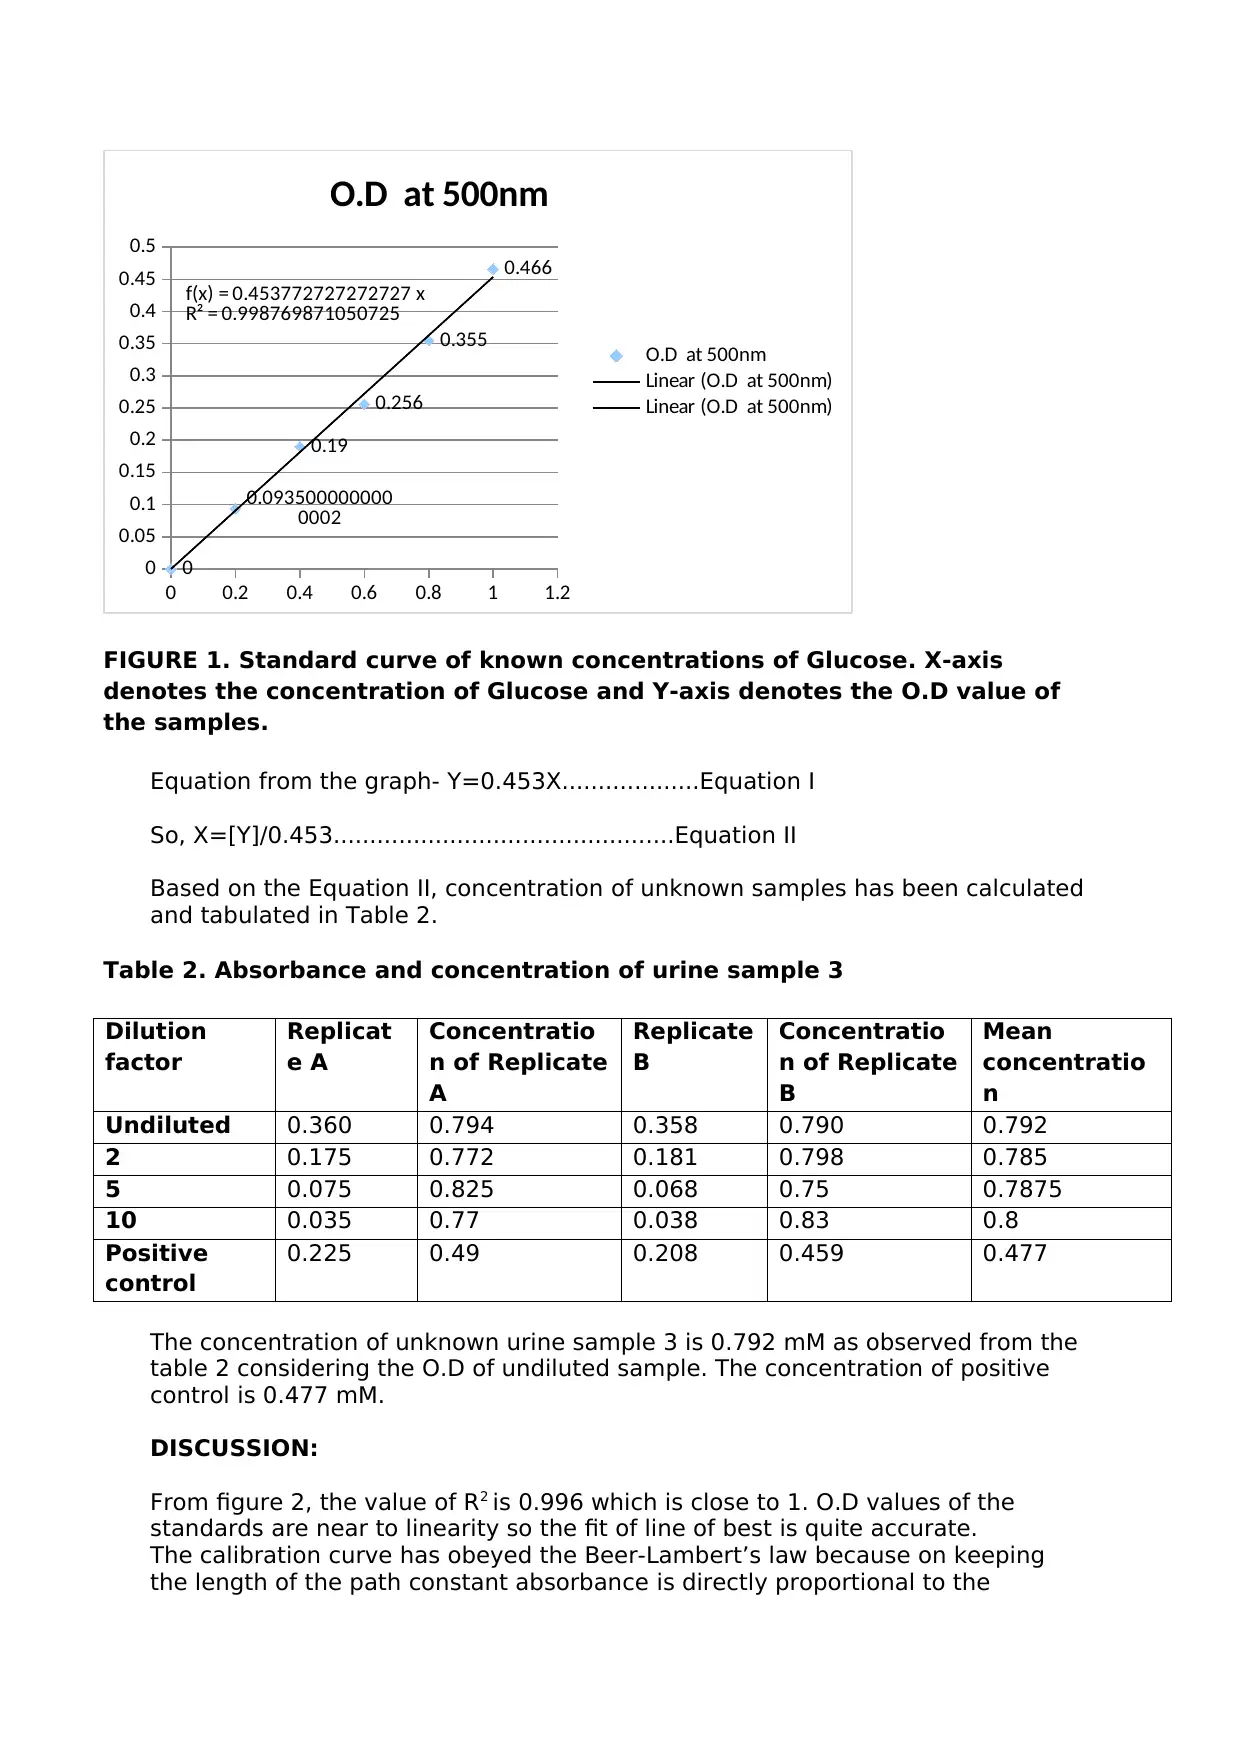
This lab report details an experiment to determine the concentration of glucose in urine samples using the GOD-PAP assay and a spectrophotometer. The introduction provides background information on glucose, its importance, and the health implications of abnormal levels, particularly in urine. The GOD-PAP assay, a colorimetric method, is described, along with the principle of spectrophotometry, including Beer-Lambert's law. The methods section (to be filled in by the author) would outline the experimental procedure. The results section presents a standard curve generated from known glucose concentrations and absorbance values, along with the calculation of glucose concentrations in unknown urine samples. The discussion analyzes the accuracy of the standard curve, adherence to Beer-Lambert's law, and potential sources of error. The report includes tables of absorbance values and the equation used for concentration calculations. The conclusion summarizes the findings and their significance.
1 out of 5


Your All-in-One AI-Powered Toolkit for Academic Success.
+13062052269
info@desklib.com
Available 24*7 on WhatsApp / Email
![[object Object]](/_next/static/media/star-bottom.7253800d.svg)
Copyright © 2020–2026 A2Z Services. All Rights Reserved. Developed and managed by ZUCOL.