Analysis of Single and Two Variables in Aviation Industry Dataset
Added on 2023-04-24
15 Pages2790 Words62 Views
Statistics
Student Name:
Student Number:
Course Instructor:
Date: 22nd January 2019
1 | P a g e
Student Name:
Student Number:
Course Instructor:
Date: 22nd January 2019
1 | P a g e
Table of Contents
1. Section 1: Introduction................................................................................................................3
2. Section 2: Analysis of single variable in Dataset 1.....................................................................4
Descriptive Statistics....................................................................................................................4
3. Section 3: Analysis of two variables in Dataset 1.......................................................................6
4. Section 4: Collect and analyze Dataset2......................................................................................8
Is there association between gender and preferred city of flight?................................................9
Is there association between year of study and preferred city of flight?....................................11
5. Section 5: Discussion & Conclusion.........................................................................................13
References......................................................................................................................................14
2 | P a g e
1. Section 1: Introduction
The Aviation industry supports Australian business and the travel industry and has an expected
yearly income of about $45 billion, adding close to $16 billion to the Australian economy in
2017 (Thomas, 2010). The business utilizes in excess of 88,000 individuals over its five primary
subsectors: International flights, Domestic business flights, general flying, airship cargo transport
and aeronautics support infrastructure (Thomas, 2010).
Dataset 1 is a primary data that has 1000 observations with a total of 14 variables. The variables
are either numerical or nominal. Some of the nominal variables in the dataset include In or Out,
Australian City, International City, Airline, Route, Port Country, Port Region, Service Country
and Service Region. Numerical variables include All Flights and Maximum Seats.
Dataset 2 is also a primary dataset that was collected among the KOI students. The data was
randomly selected in order to avoid bias that might arise. A total of 100 cases was used with
three variables. All the three variables were nominal variables (Hunter & Leahey, 2009). The
three variables include the gender of the student, the student’s year of study and the airport that
the student prefers to fly in and out of. The limitation of this data is the fact that the data was
collected from one institution and the sample size was to large enough to allow for generalization
(Fugard & Potts , 2015).
Table 1 below presents the description of variables in dataset 2;
Table 1: Description of the variables
Variable Description Values
In-Out Airlines comes in or goes out I for in and O for out
Australian City Which Australian city airline lands or Flies
out. Australian city names
International City Which international city airline lands or
flies out International city names
3 | P a g e
Airlines Name of the airline Name of the airline
Route Via which airport airlines flies Short forms of various
airports
Port country Which country airlines belongs to Name of the country
Port Region Which region airline belongs to Region name
Service country Which country do the service Country name
Stops Number of stops airlines have 0,1,2
All Flights Number flight in or out in the month Number in integer
Max seat Number of maximum seats Number in integer
Year Which year Number in the year
Month Number Which month Number of the month
2. Section 2: Analysis of single variable in Dataset 1
Descriptive Statistics
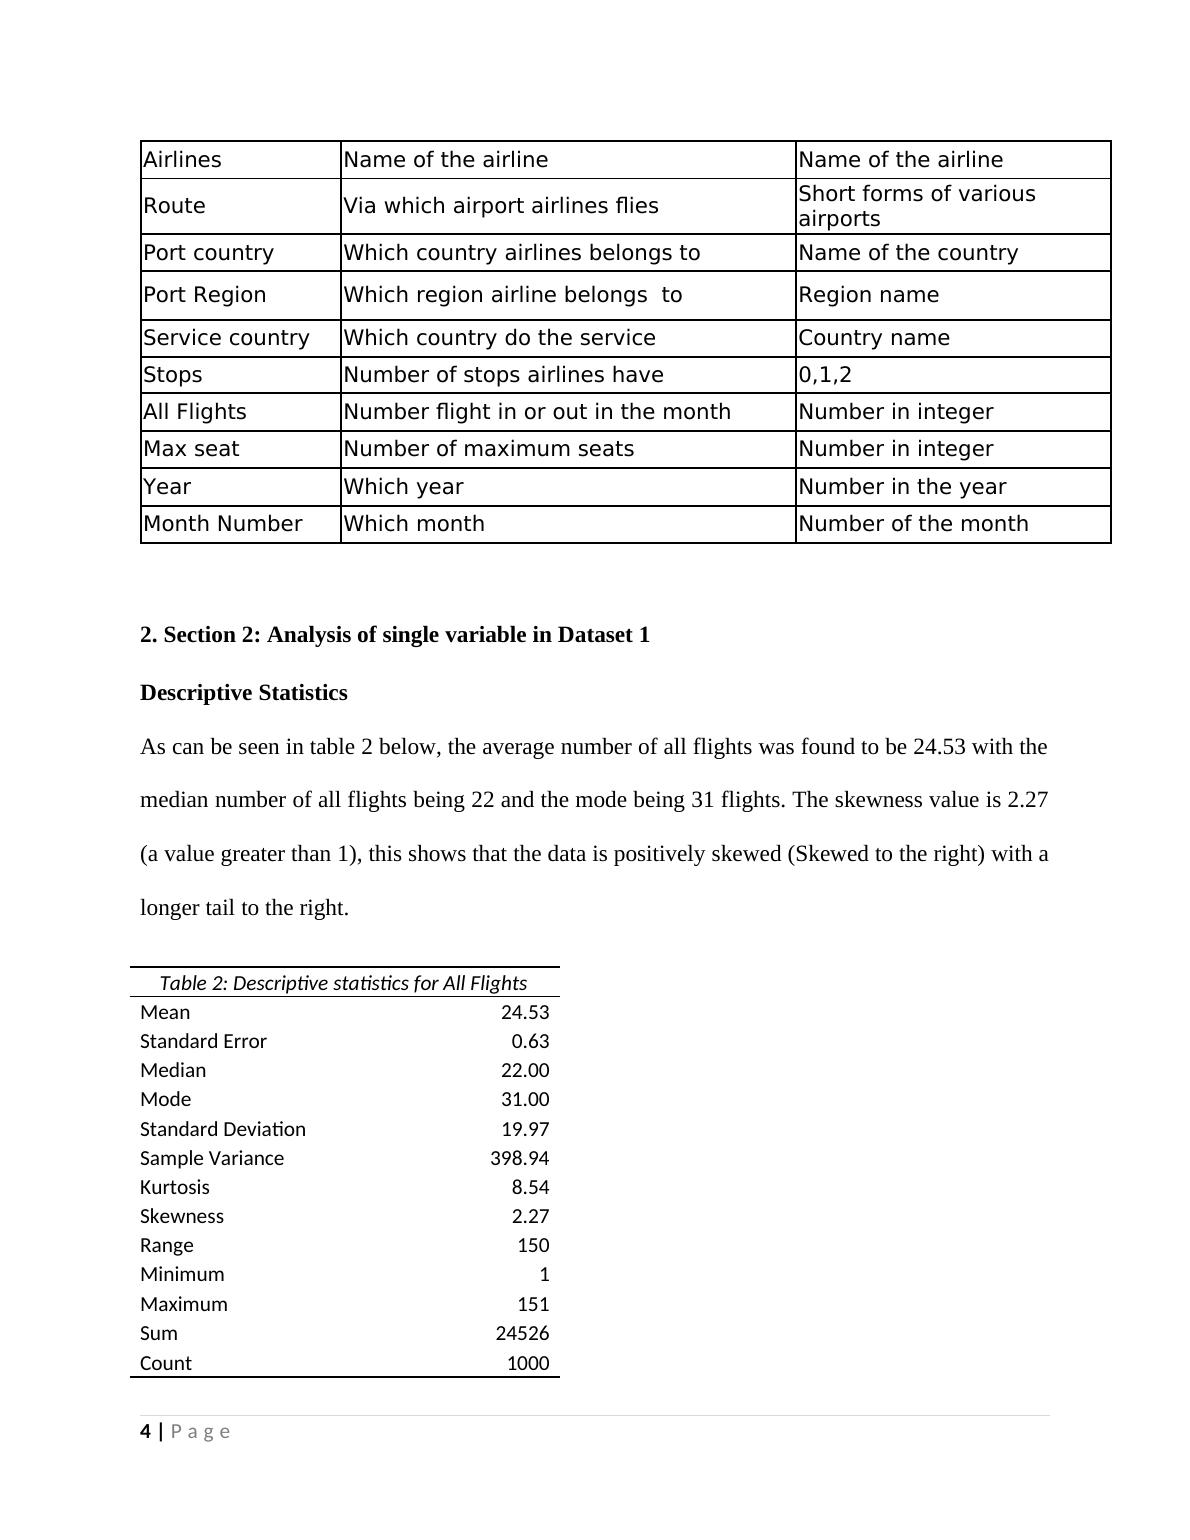
As can be seen in table 2 below, the average number of all flights was found to be 24.53 with the
median number of all flights being 22 and the mode being 31 flights. The skewness value is 2.27
(a value greater than 1), this shows that the data is positively skewed (Skewed to the right) with a
longer tail to the right.
Table 2: Descriptive statistics for All Flights
Mean 24.53
Standard Error 0.63
Median 22.00
Mode 31.00
Standard Deviation 19.97
Sample Variance 398.94
Kurtosis 8.54
Skewness 2.27
Range 150
Minimum 1
Maximum 151
Sum 24526
Count 1000
4 | P a g e
Route Via which airport airlines flies Short forms of various
airports
Port country Which country airlines belongs to Name of the country
Port Region Which region airline belongs to Region name
Service country Which country do the service Country name
Stops Number of stops airlines have 0,1,2
All Flights Number flight in or out in the month Number in integer
Max seat Number of maximum seats Number in integer
Year Which year Number in the year
Month Number Which month Number of the month
2. Section 2: Analysis of single variable in Dataset 1
Descriptive Statistics
As can be seen in table 2 below, the average number of all flights was found to be 24.53 with the
median number of all flights being 22 and the mode being 31 flights. The skewness value is 2.27
(a value greater than 1), this shows that the data is positively skewed (Skewed to the right) with a
longer tail to the right.
Table 2: Descriptive statistics for All Flights
Mean 24.53
Standard Error 0.63
Median 22.00
Mode 31.00
Standard Deviation 19.97
Sample Variance 398.94
Kurtosis 8.54
Skewness 2.27
Range 150
Minimum 1
Maximum 151
Sum 24526
Count 1000
4 | P a g e
End of preview
Want to access all the pages? Upload your documents or become a member.
Related Documents
Analysis of Flights Dataset from Deskliblg...
|11
|2460
|55
Evaluating Airlines Frequencies and Passenger Satisfaction of Australian International Airportslg...
|10
|2222
|238
Analyzing Airlines Services Data: Insights from Dataset Analysis and Discussionlg...
|8
|2251
|190
Analysis of International Flights in Australialg...
|11
|2547
|107
Analysis of International Flights in Australialg...
|9
|1734
|256
Analysis of Aviation Industry in Australialg...
|9
|1558
|411