Analysis of International Flights in Australia
Added on 2023-04-21
9 Pages1734 Words256 Views
STATISTICS
STUDENT ID:
[Pick the date]
STUDENT ID:
[Pick the date]

Section 1: Introduction
a) The share of international airlines in the traffic from Australia is increasing. The given report gains
significance in this backdrop as it is imperative for various airports to improve their performance to
get a higher share in the expanding pie. It is estimated that international airlines have a healthy 25%
share in the flights coming to or departing from Australia. The impressive aspect is that the growth
of international airlines in Australia has been in excess of 5% unlike the domestic airlines which have
witnessed a sub 2% growth rate. The international airlines market share has also received a boost
owing to decrease in capacity of Qantas which happens to be the largest domestic player. As this
trend continues in the future, the airports need to focus on attracting a higher share in these rise of
international air traffic (AnnaAero, 2018).
b) Dataset 1 highlights information in regards to international flights including the flight date, stops,
seats, start city, destination route and whether the flight is flying into or out of Australia. This
dataset would be categorised as secondary data considering the fact that this data has not been
collected through any research by the University and instead obtained from Australian Government
Open Data (Fehr and Grossman, 2013). The given data primarily comprises of categorical variables
which have a nominal measurement scale. There are some variables namely max seats, stops and all
flight that have numerical values and have ratio measurement scale (Hastie, Tibshirani and
Friedman, 2014). The cases of interest for the given dataset comprises of international flights that
either originate from Australia or have the same as the end destination.
c) Dataset 2 highlights information in regards to 20 international flights whose data has been
obtained from the survey comprising of 20 KOI students. Since the dataset has been collected
directly from the respondents, hence this is an example of primary data. The represented variables
are only three namely the Australian city, Airline and International City. All these variables are
essentially categorical with the underlying measurement scale being nominal. A potential issue with
this dataset 2 is that it may be biased owing to use of non-probability based sampling. This is
because selection of 20 respondents was more driven by convenience rather than random selection
(Lieberman et. al., 2013). The cases of interest are limited to students who aware of international
flights essentially from three airports (i.e. Brisbane, Melbourne or Sydney).
Section 2: Dataset 1 Analysis (Single Variable)
a) The “All Flights” variable numerical summary is as offered below.
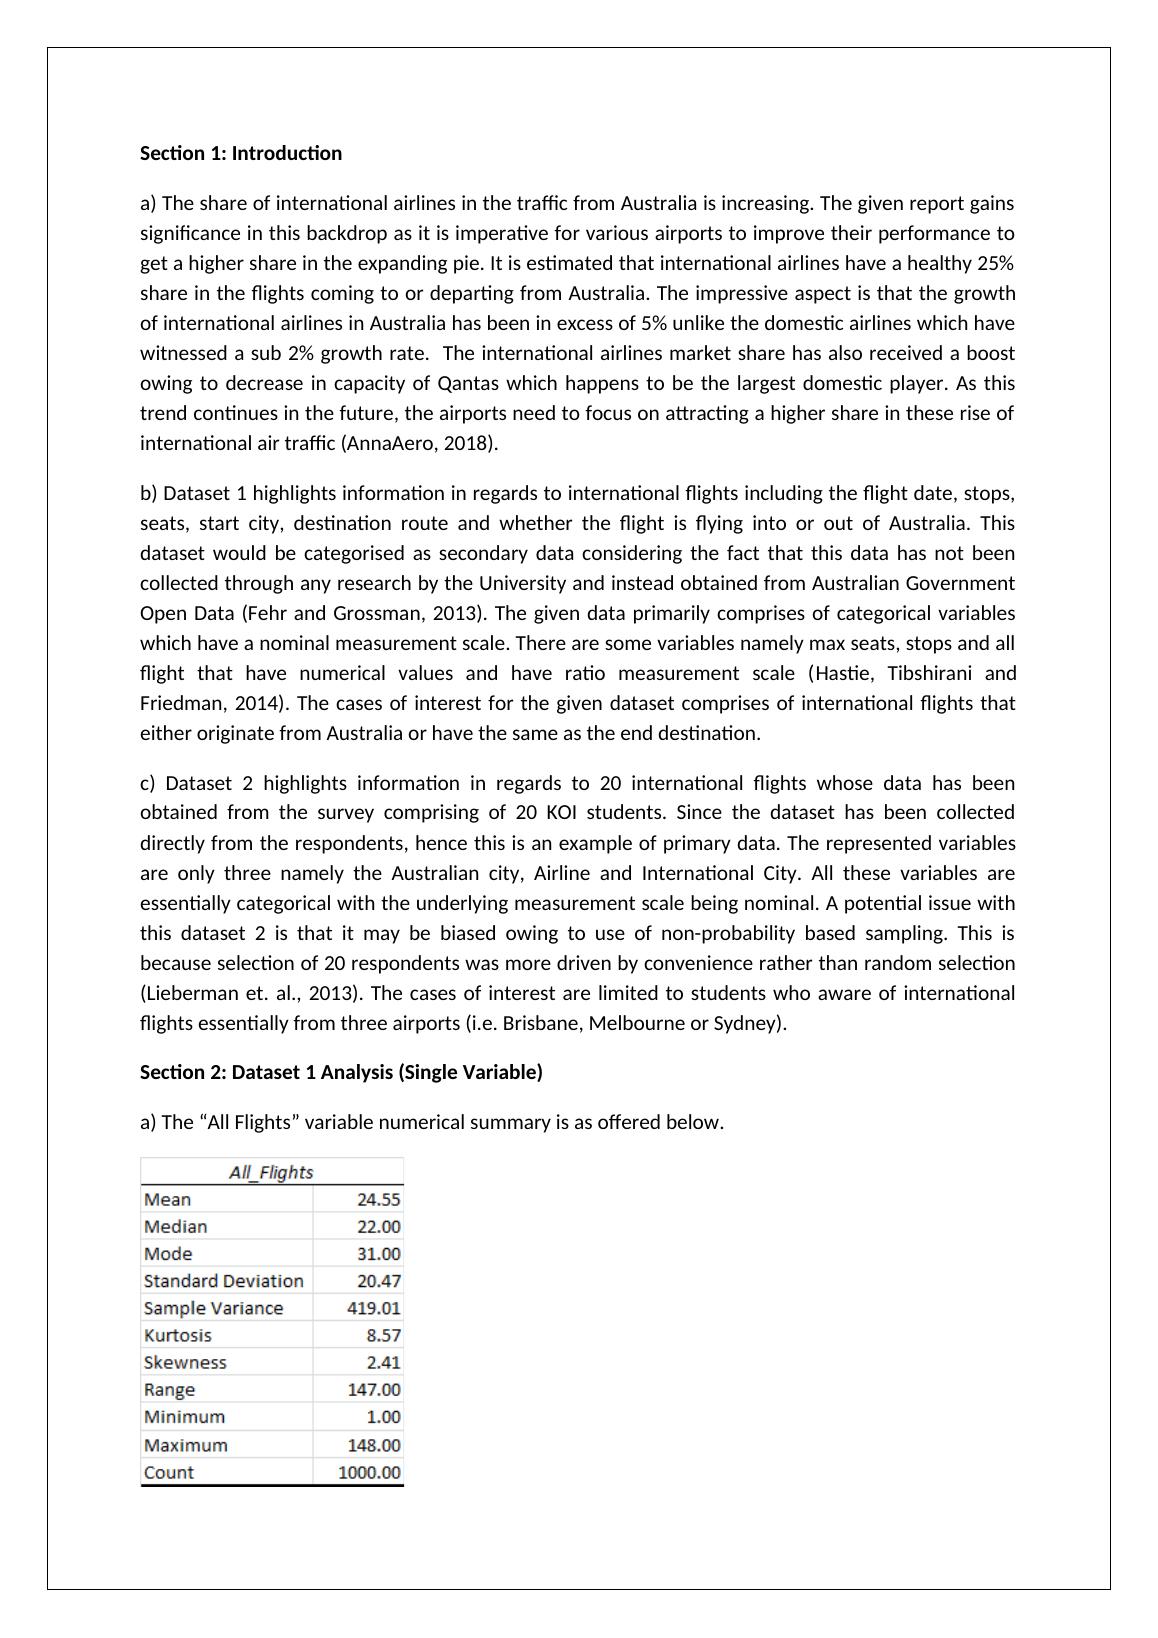
The summary statistics clearly highlights that the value of skew is quite high. This is also confirmed
with the range of values considering that the minimum is 1 and maximum is 148. It is apparent that
taking the mean of 24.55 in consideration, the highest value of 148 seems very high and certain
values may be outliers. In such a scenario, the shape of variable distribution would be non-
symmetric thereby indicating the non-normal nature of distribution (Lind, Marchal and Wathen,
2015).
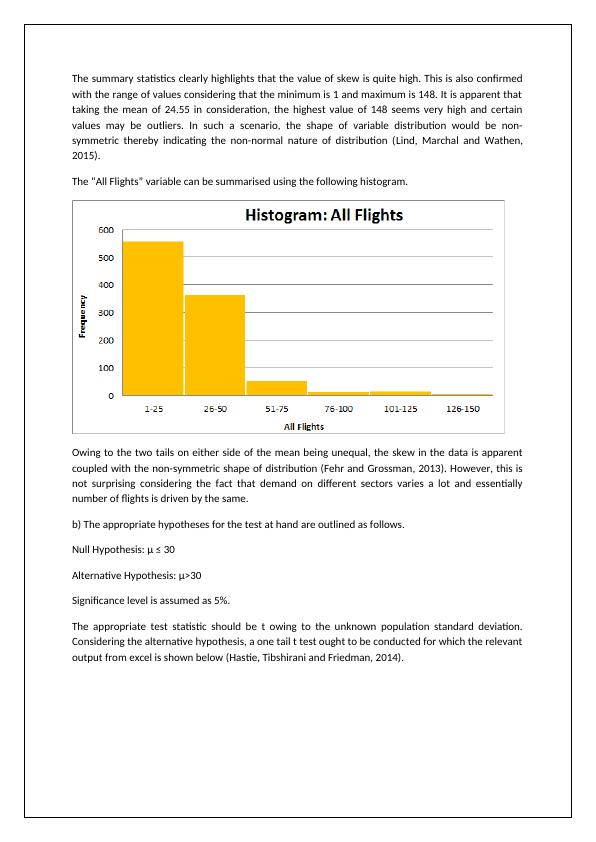
The “All Flights” variable can be summarised using the following histogram.
Owing to the two tails on either side of the mean being unequal, the skew in the data is apparent
coupled with the non-symmetric shape of distribution (Fehr and Grossman, 2013). However, this is
not surprising considering the fact that demand on different sectors varies a lot and essentially
number of flights is driven by the same.
b) The appropriate hypotheses for the test at hand are outlined as follows.
Null Hypothesis: μ ≤ 30
Alternative Hypothesis: μ>30
Significance level is assumed as 5%.
The appropriate test statistic should be t owing to the unknown population standard deviation.
Considering the alternative hypothesis, a one tail t test ought to be conducted for which the relevant
output from excel is shown below (Hastie, Tibshirani and Friedman, 2014).
with the range of values considering that the minimum is 1 and maximum is 148. It is apparent that
taking the mean of 24.55 in consideration, the highest value of 148 seems very high and certain
values may be outliers. In such a scenario, the shape of variable distribution would be non-
symmetric thereby indicating the non-normal nature of distribution (Lind, Marchal and Wathen,
2015).
The “All Flights” variable can be summarised using the following histogram.
Owing to the two tails on either side of the mean being unequal, the skew in the data is apparent
coupled with the non-symmetric shape of distribution (Fehr and Grossman, 2013). However, this is
not surprising considering the fact that demand on different sectors varies a lot and essentially
number of flights is driven by the same.
b) The appropriate hypotheses for the test at hand are outlined as follows.
Null Hypothesis: μ ≤ 30
Alternative Hypothesis: μ>30
Significance level is assumed as 5%.
The appropriate test statistic should be t owing to the unknown population standard deviation.
Considering the alternative hypothesis, a one tail t test ought to be conducted for which the relevant
output from excel is shown below (Hastie, Tibshirani and Friedman, 2014).
End of preview
Want to access all the pages? Upload your documents or become a member.
Related Documents
Analysis of International Flight Traffic in Australialg...
|11
|2383
|237
Statistical Analysis of International Flights in Australialg...
|9
|2620
|464
Analysis of International Flights in Australialg...
|11
|2547
|107
Analysis of International Flights in Australialg...
|9
|2400
|97
Evaluating Airlines Frequencies and Passenger Satisfaction of Australian International Airportslg...
|10
|2222
|238
Analyzing Airlines Services Data: Insights from Dataset Analysis and Discussionlg...
|8
|2251
|190