ICT110: East Asia and Pacific Health and Population Data Report
VerifiedAdded on 2023/06/11
|22
|3497
|268
Report
AI Summary
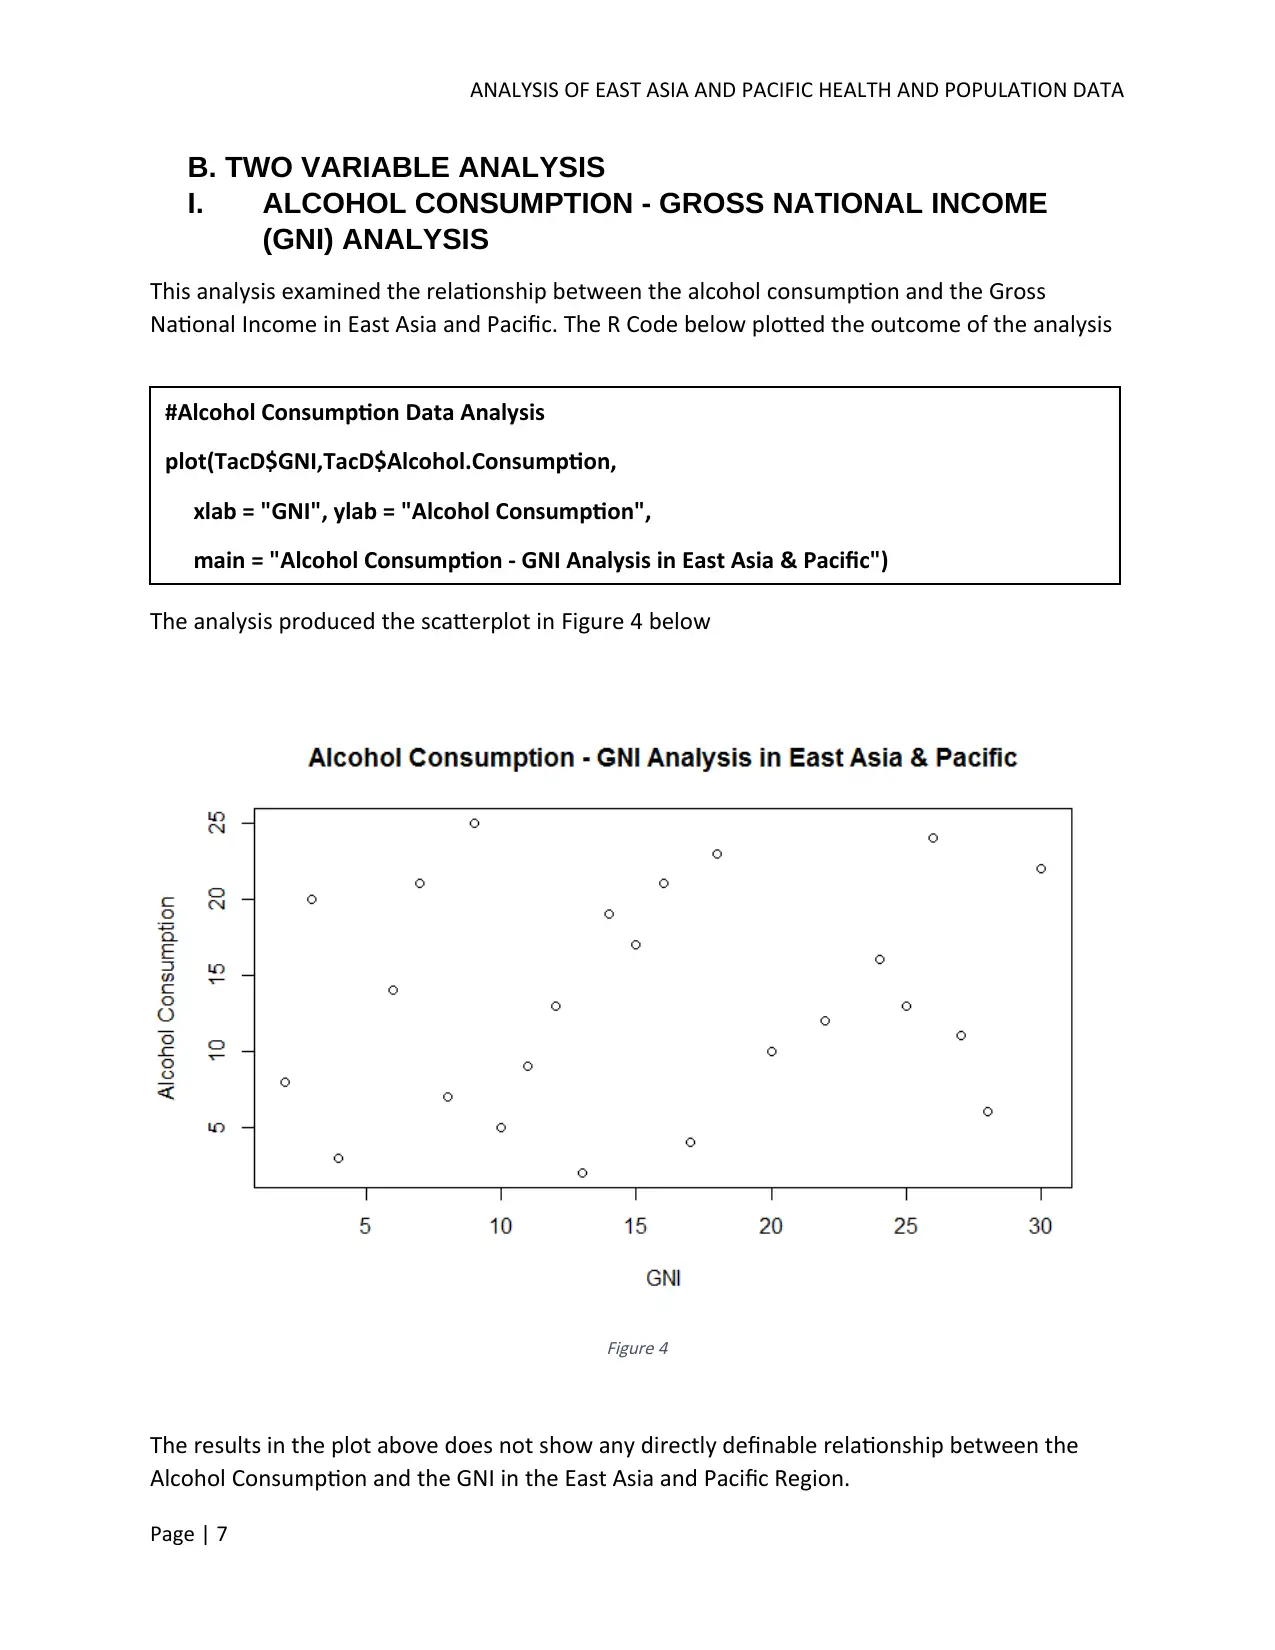
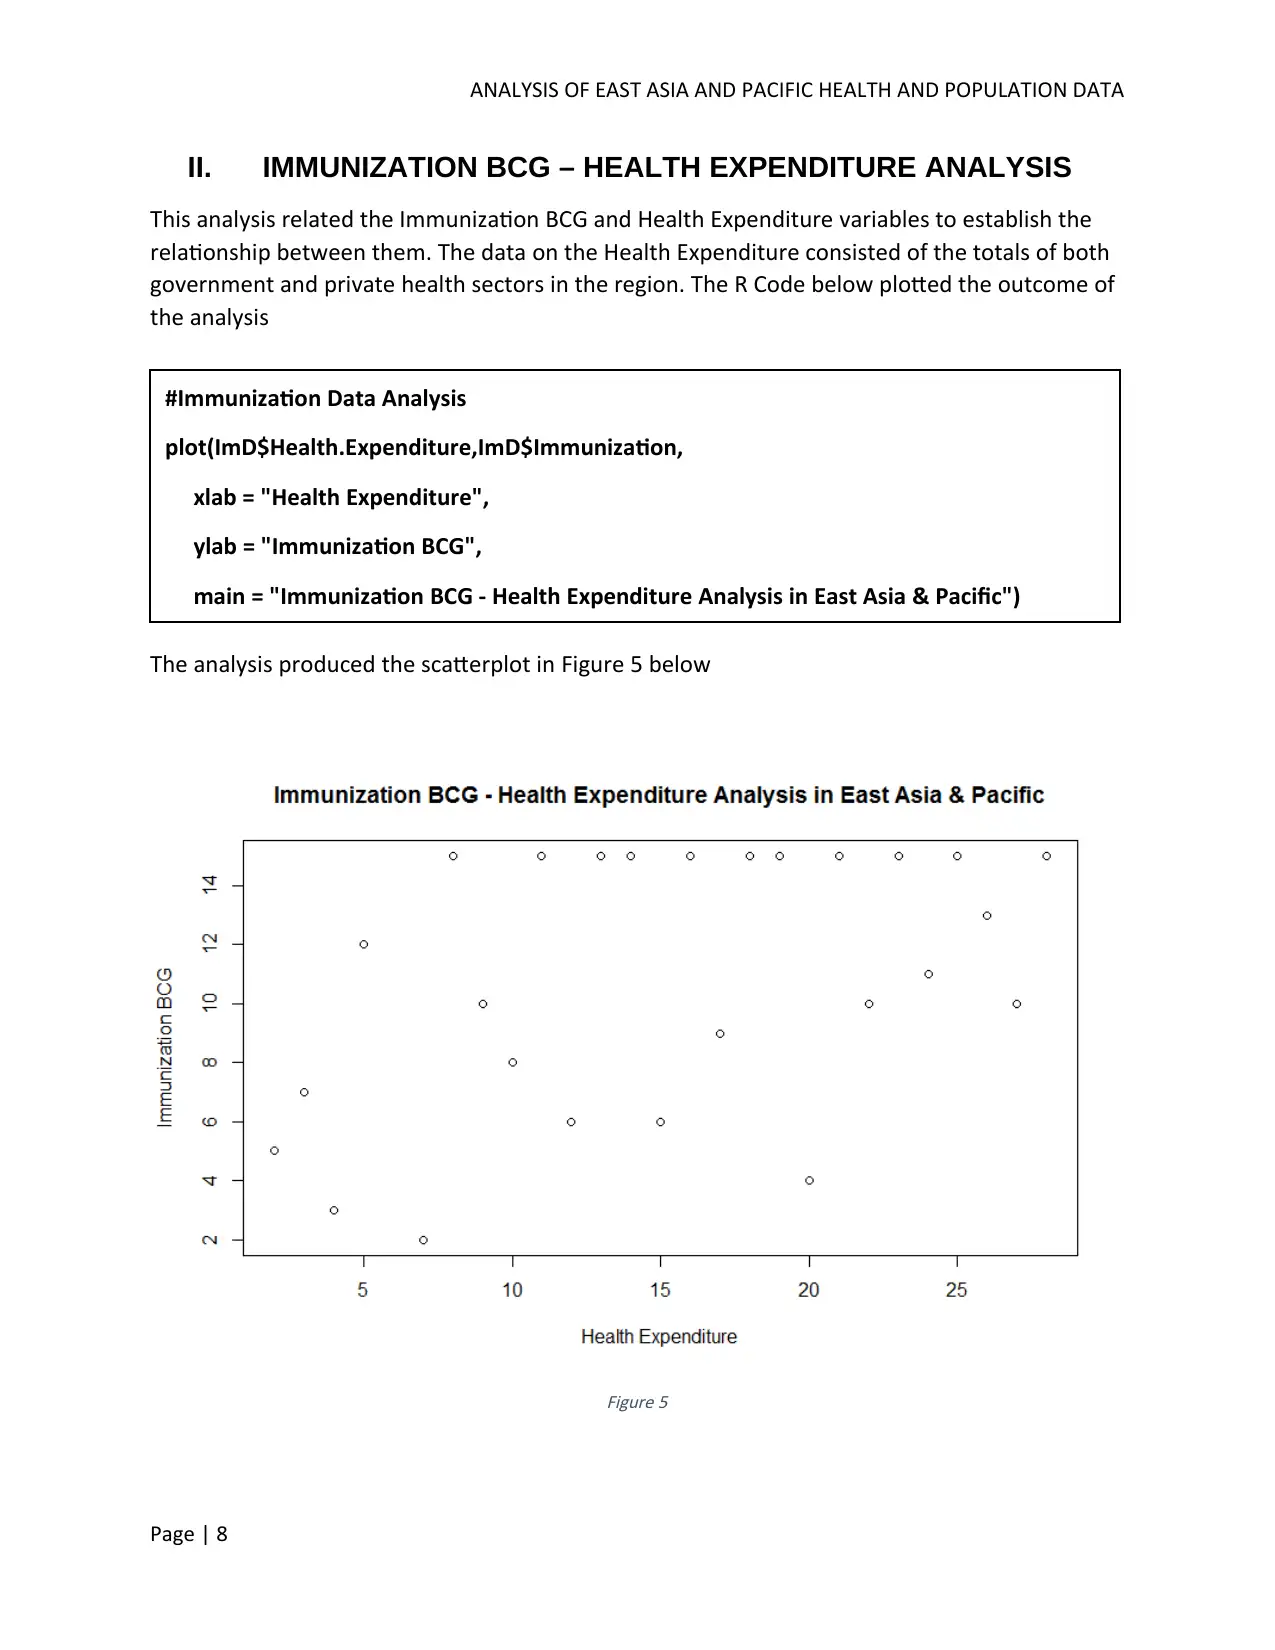
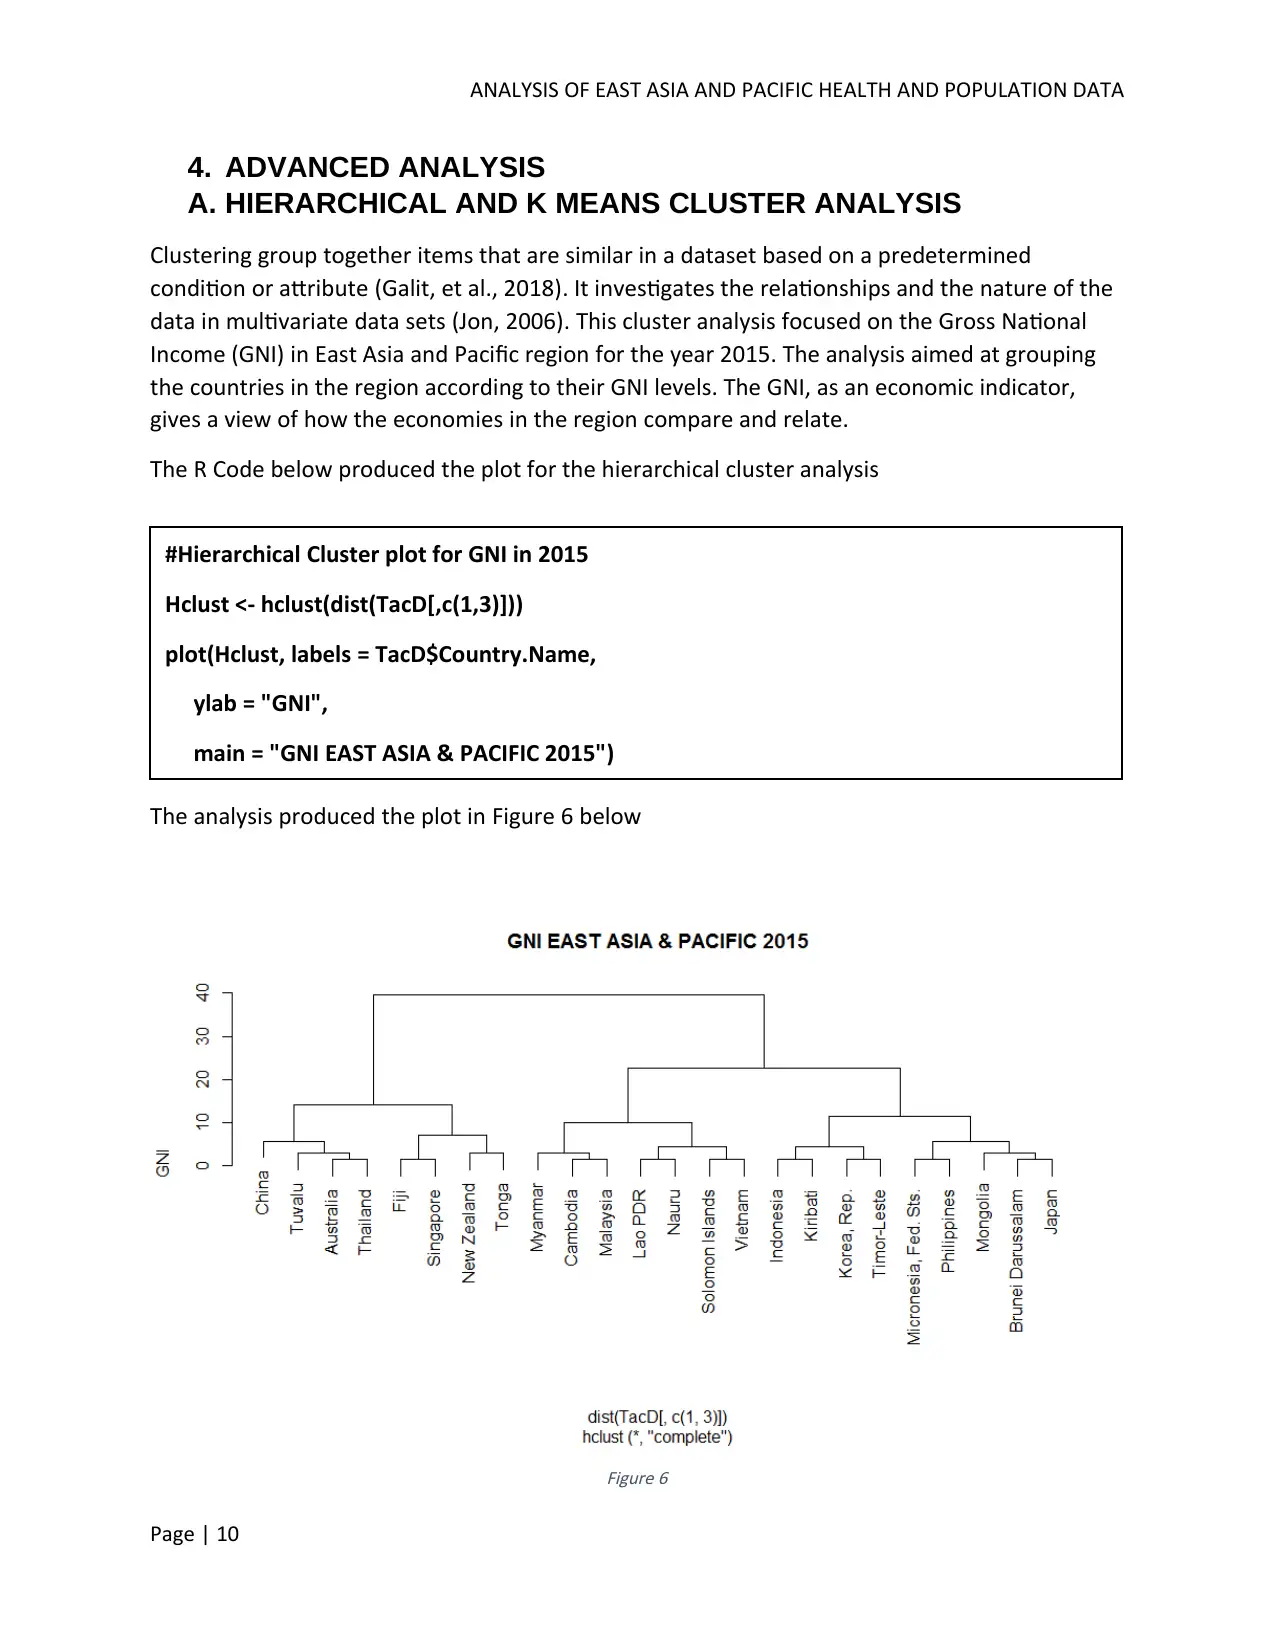
This report analyzes health and population data from the East Asia and Pacific region, focusing on immunization and alcohol consumption. The analysis uses data from the World Bank to compare immunization rates and their relationship to health expenditure across countries, revealing variations in immunization coverage and a dispersed trend relative to health expenditure levels. It also examines the correlation between alcohol consumption and Gross National Income (GNI), finding no directly definable relationship. Advanced analysis includes hierarchical and K-means clustering of countries based on GNI, highlighting economic disparities within the region. Linear regression models are applied to explore the relationships between alcohol consumption and GNI, as well as immunization and health expenditure, providing insights into the factors influencing health outcomes and economic indicators in East Asia and the Pacific.
1 out of 22
Related Documents


Your All-in-One AI-Powered Toolkit for Academic Success.
+13062052269
info@desklib.com
Available 24*7 on WhatsApp / Email
![[object Object]](/_next/static/media/star-bottom.7253800d.svg)
Copyright © 2020–2026 A2Z Services. All Rights Reserved. Developed and managed by ZUCOL.