Econometrics Study Material
This assignment involves analyzing a dataset on job training for low-income men in the United States in 1976. The assignment requires reconstructing frequency tables and performing computations.
9 Pages1273 Words23 Views
Added on 2023-01-03
About This Document
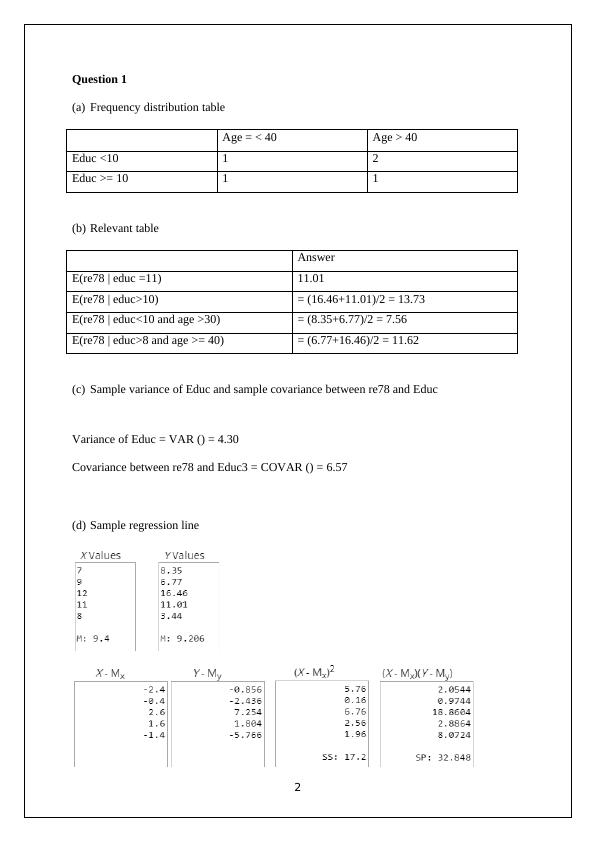
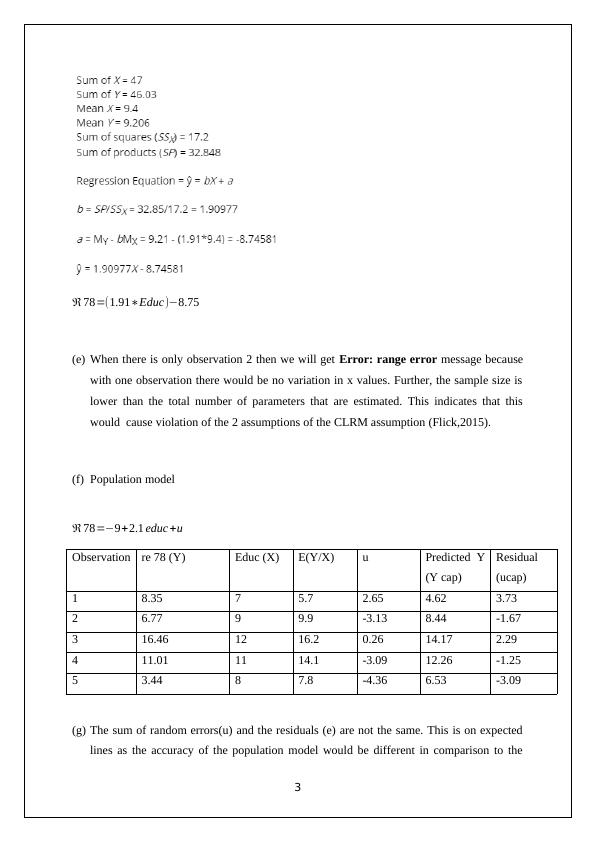
This document provides study material for Econometrics, including a frequency distribution table, relevant tables, sample variance and covariance, sample regression line, population model, regression analysis, scatter plot, OLS regression output, and more. It also discusses the significance of regression coefficients and violation of assumptions. The document concludes with a regression model testing the law of demand and its implications.
Econometrics Study Material
This assignment involves analyzing a dataset on job training for low-income men in the United States in 1976. The assignment requires reconstructing frequency tables and performing computations.
Added on 2023-01-03
ShareRelated Documents
End of preview
Want to access all the pages? Upload your documents or become a member.
Statistics for Business
|9
|709
|408
Statistics: Examination Scores, Sample Size, ANOVA, Regression Model
|9
|598
|256
Statistics Study Material with Solved Assignments and Dissertation - Desklib
|12
|770
|302
THE SIMPLE LINEAR REGRESSION
|11
|1622
|8
1. INTRODUCTION TO ECONOMIC METHODS by Student’s Name.
|4
|398
|136
Statistics: ANOVA, Regression Analysis and Hypothesis Testing
|10
|1103
|376