Statistics: ANOVA, Regression Analysis and Hypothesis Testing
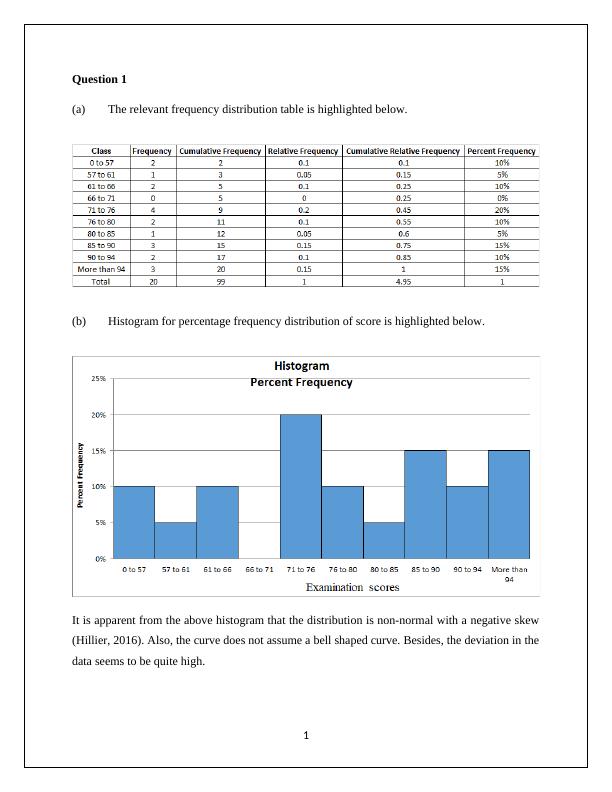
Construct frequency distribution, cumulative frequency distribution, relative frequency distribution, cumulative relative frequency distribution, and percent frequency distribution for given data set. Construct a histogram and analyze the shape of the distribution. Determine sample size for a regression analysis.
10 Pages1103 Words376 Views
Added on 2023-06-04
About This Document
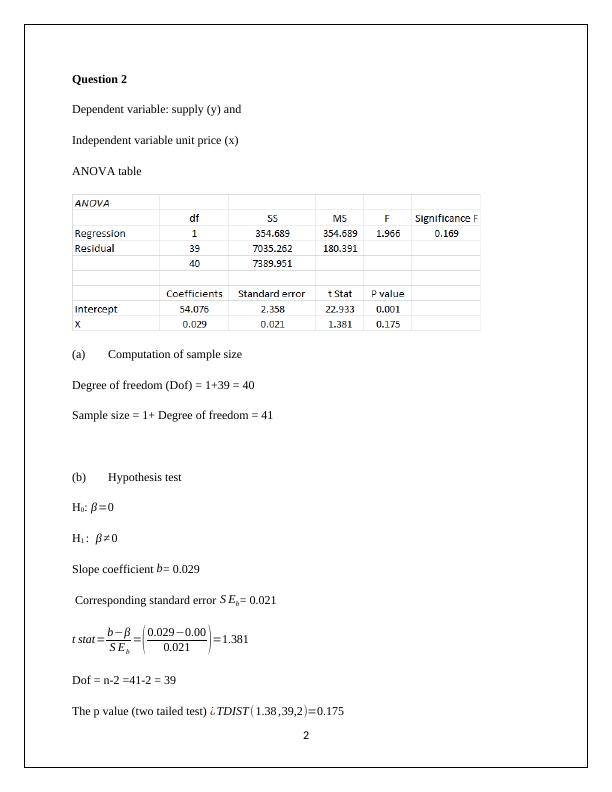
This article covers ANOVA, Regression Analysis and Hypothesis Testing in Statistics. It includes computation of sample size, hypothesis test, coefficient of determination, coefficient of correlation, regression model and significance of variables.
Statistics: ANOVA, Regression Analysis and Hypothesis Testing
Construct frequency distribution, cumulative frequency distribution, relative frequency distribution, cumulative relative frequency distribution, and percent frequency distribution for given data set. Construct a histogram and analyze the shape of the distribution. Determine sample size for a regression analysis.
Added on 2023-06-04
ShareRelated Documents
End of preview
Want to access all the pages? Upload your documents or become a member.
Statistics: ANOVA, Regression Analysis and Hypothesis Testing
|9
|832
|317
Statistics: ANOVA, Regression Analysis and Frequency Distribution Table
|5
|939
|123
Statistics Exam: Frequency Distribution, Regression Analysis, ANOVA, and Sales Data
|7
|1353
|141
Statistics Study Material with Solved Assignments and Dissertation - Desklib
|12
|770
|302
Statistics for Business Decisions - Desklib
|6
|836
|321
Statistics: Examination Scores, Sample Size, ANOVA, Regression Model
|9
|598
|256