Quality of social and emotional wellbeing services for families of young Indigenous children attending primary care centers; a cross sectional analysis
VerifiedAdded on 2023/01/20
|11
|11073
|61
AI Summary
This study assesses the delivery of social and emotional wellbeing services to the families of young and older Indigenous children attending primary care centers. The study found that the proportion of families receiving social and emotional wellbeing services ranged from 10.6% to 74.7%. Families of children aged 3–11 months were more likely to receive social and emotional wellbeing services than families of children aged 12–59 months. Remote area families received similar services to rural and urban families.
Contribute Materials
Your contribution can guide someone’s learning journey. Share your
documents today.
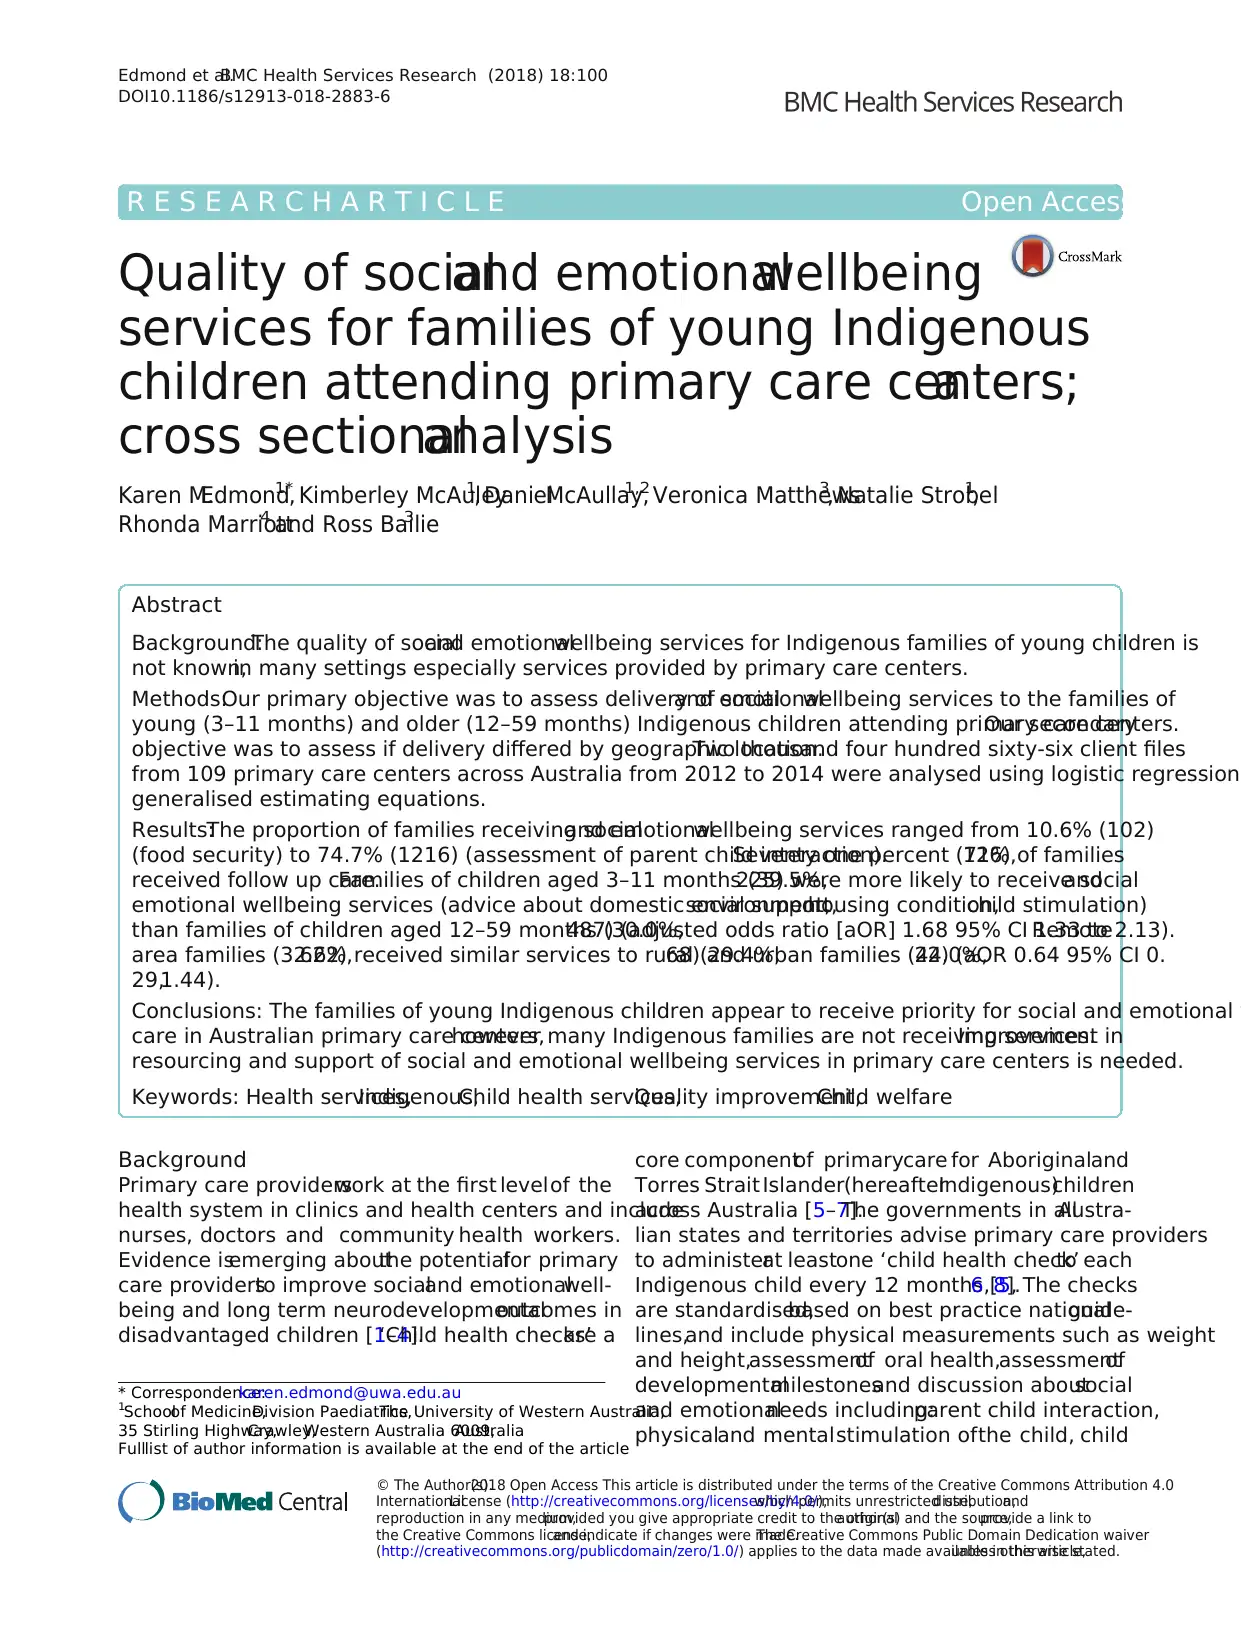
R E S E A R C H A R T I C L E Open Access
Quality of socialand emotionalwellbeing
services for families of young Indigenous
children attending primary care centers;a
cross sectionalanalysis
Karen M.Edmond1*
, Kimberley McAuley1
, DanielMcAullay1,2
, Veronica Matthews3
, Natalie Strobel1
,
Rhonda Marriott4 and Ross Bailie3
Abstract
Background:The quality of socialand emotionalwellbeing services for Indigenous families of young children is
not known,in many settings especially services provided by primary care centers.
Methods:Our primary objective was to assess delivery of socialand emotionalwellbeing services to the families of
young (3–11 months) and older (12–59 months) Indigenous children attending primary care centers.Our secondary
objective was to assess if delivery differed by geographic location.Two thousand four hundred sixty-six client files
from 109 primary care centers across Australia from 2012 to 2014 were analysed using logistic regression
generalised estimating equations.
Results:The proportion of families receiving socialand emotionalwellbeing services ranged from 10.6% (102)
(food security) to 74.7% (1216) (assessment of parent child interaction).Seventy one percent (71%,126) of families
received follow up care.Families of children aged 3–11 months (39.5%,225) were more likely to receive socialand
emotional wellbeing services (advice about domestic environment,social support,housing condition,child stimulation)
than families of children aged 12–59 months (30.0%,487) (adjusted odds ratio [aOR] 1.68 95% CI 1.33 to 2.13).Remote
area families (32.6%,622) received similar services to rural (29.4%,68) and urban families (44.0%,22) (aOR 0.64 95% CI 0.
29,1.44).
Conclusions: The families of young Indigenous children appear to receive priority for social and emotional w
care in Australian primary care centers,however many Indigenous families are not receiving services.Improvement in
resourcing and support of social and emotional wellbeing services in primary care centers is needed.
Keywords: Health services,Indigenous,Child health services,Quality improvement,Child welfare
Background
Primary care providerswork at the first levelof the
health system in clinics and health centers and include
nurses, doctors and community health workers.
Evidence isemerging aboutthe potentialfor primary
care providersto improve socialand emotionalwell-
being and long term neurodevelopmentaloutcomes in
disadvantaged children [1–4].‘Child health checks’are a
core componentof primarycare for Aboriginaland
Torres Strait Islander(hereafterIndigenous)children
across Australia [5–7].The governments in allAustra-
lian states and territories advise primary care providers
to administerat leastone ‘child health check’to each
Indigenous child every 12 months [5,6, 8].The checks
are standardised,based on best practice nationalguide-
lines,and include physical measurements such as weight
and height,assessmentof oral health,assessmentof
developmentalmilestonesand discussion aboutsocial
and emotionalneeds including:parent child interaction,
physicaland mentalstimulation ofthe child, child
* Correspondence:karen.edmond@uwa.edu.au
1Schoolof Medicine,Division Paediatrics,The University of Western Australia,
35 Stirling Highway,Crawley,Western Australia 6009,Australia
Fulllist of author information is available at the end of the article
© The Author(s).2018 Open Access This article is distributed under the terms of the Creative Commons Attribution 4.0
InternationalLicense (http://creativecommons.org/licenses/by/4.0/),which permits unrestricted use,distribution,and
reproduction in any medium,provided you give appropriate credit to the originalauthor(s) and the source,provide a link to
the Creative Commons license,and indicate if changes were made.The Creative Commons Public Domain Dedication waiver
(http://creativecommons.org/publicdomain/zero/1.0/) applies to the data made available in this article,unless otherwise stated.
Edmond et al.BMC Health Services Research (2018) 18:100
DOI10.1186/s12913-018-2883-6
Secure Best Marks with AI Grader
Need help grading? Try our AI Grader for instant feedback on your assignments.
behaviour,optimaldomesticand socialenvironment,
housing and food security,and social and family support
services [8].
However,it is not clear how wellsocialand emotional
wellbeing services are being implemented in busy pri-
mary care settings,and there is little information about
the implementation ofsocialand emotionalservices for
the familiesof the youngestinfantswho requirethe
most support.Variation betweenurban, rural and
remote locations is also unclear.
The Audit and Best Practicefor Chronic Disease
(ABCD) program is a continuous quality improvement
(CQI) program for the prevention and managementof
chronic disease in Indigenous people in Australia [9,10].
The program broadened itsscope in 2007 to include
maternaland child health,mentalhealth and health
promotion.By the end of2014 ABCD and its service
support organisation (One21seventy [11]) had supported
over270 primary care centersacrossAustralia.There
are now data availablefrom standardisedaudits of
almost15,000 clinicalfiles ofIndigenous children who
attended primarycare centersacrossAustraliafrom
2007 to 2014.
The primary objective of this study was to use ABCD
data from 2012 to 2014 to assess the delivery ofsocial
and emotionalwellbeing services in Australian primary
care centers to the families of young (3–11 months) and
older (12–59 months) Indigenous children.The second-
ary objectivewas to assessif deliverydifferedby
geographic location.
Methods
Study setting and design
This was a cross sectionalstudy ofclient files from the
109 remote,rural and urban Australian primary care
centers thatparticipated in ABCD from 2012 to 2014.
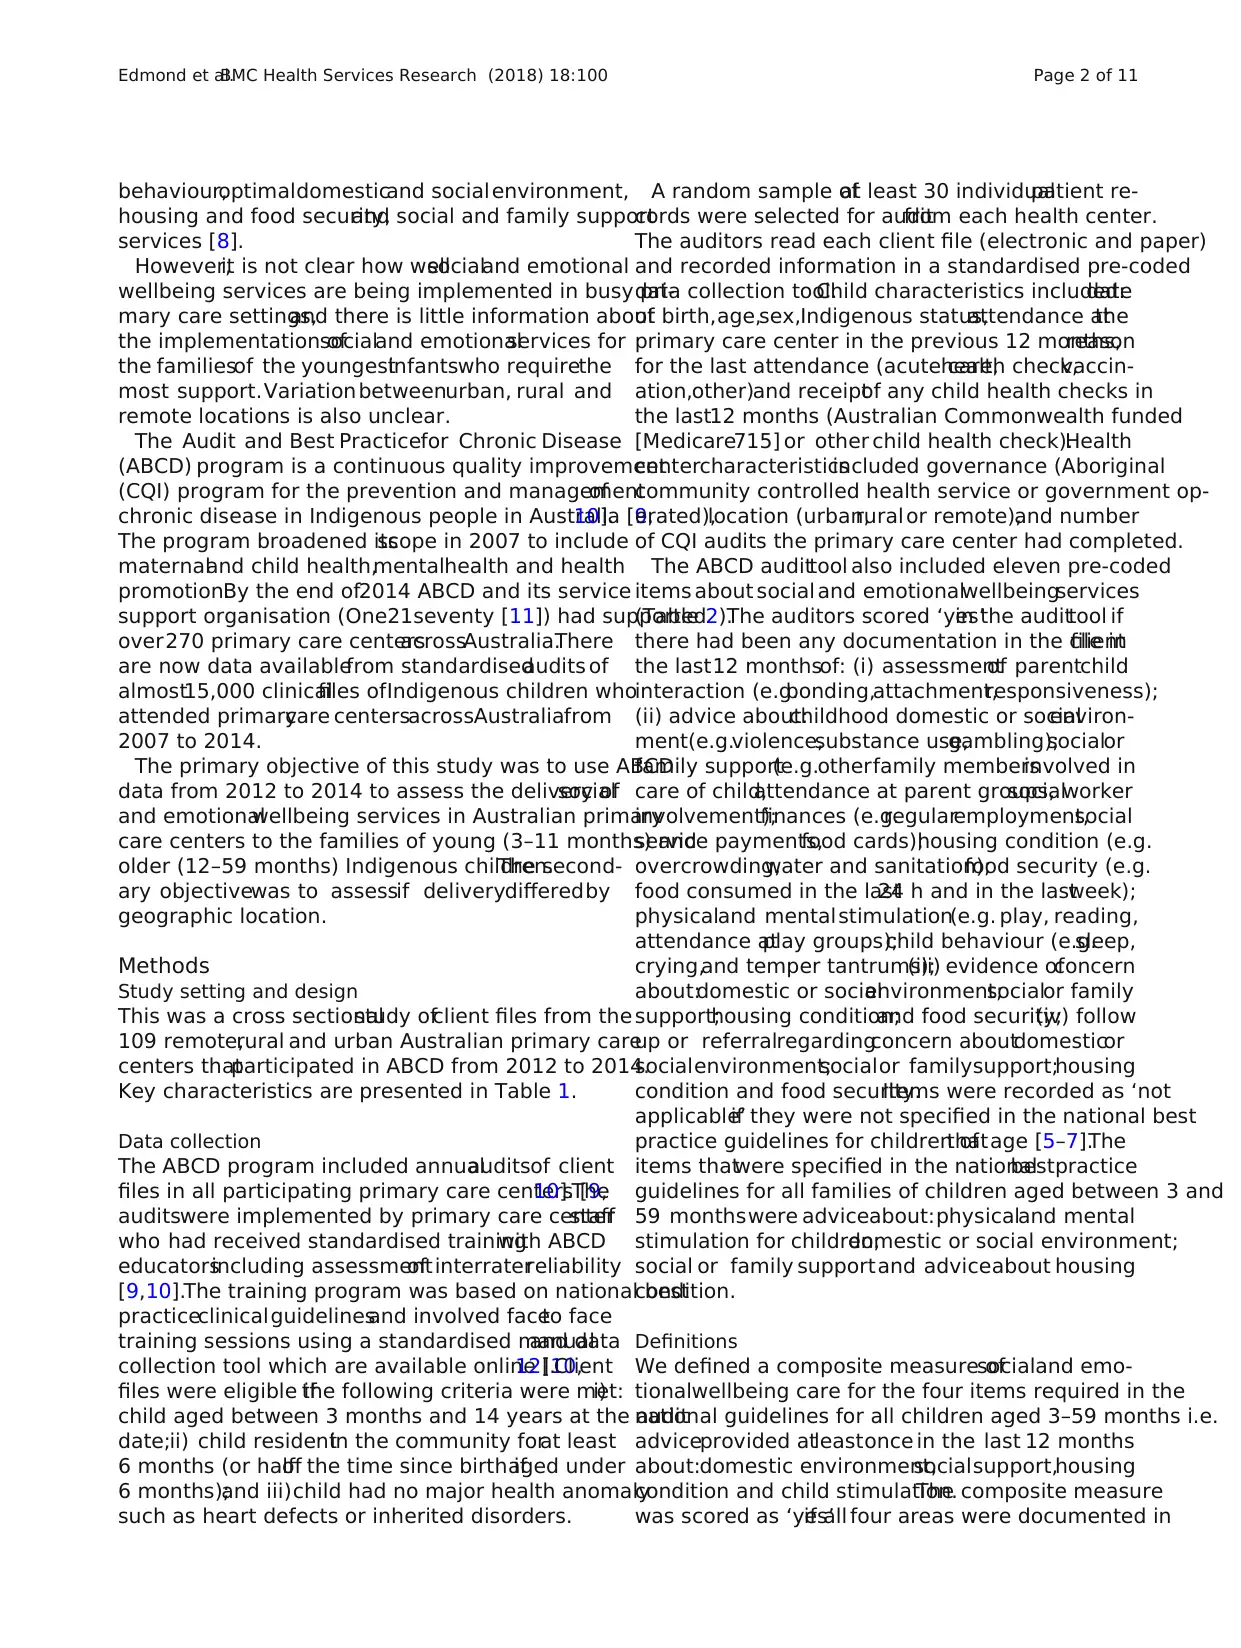
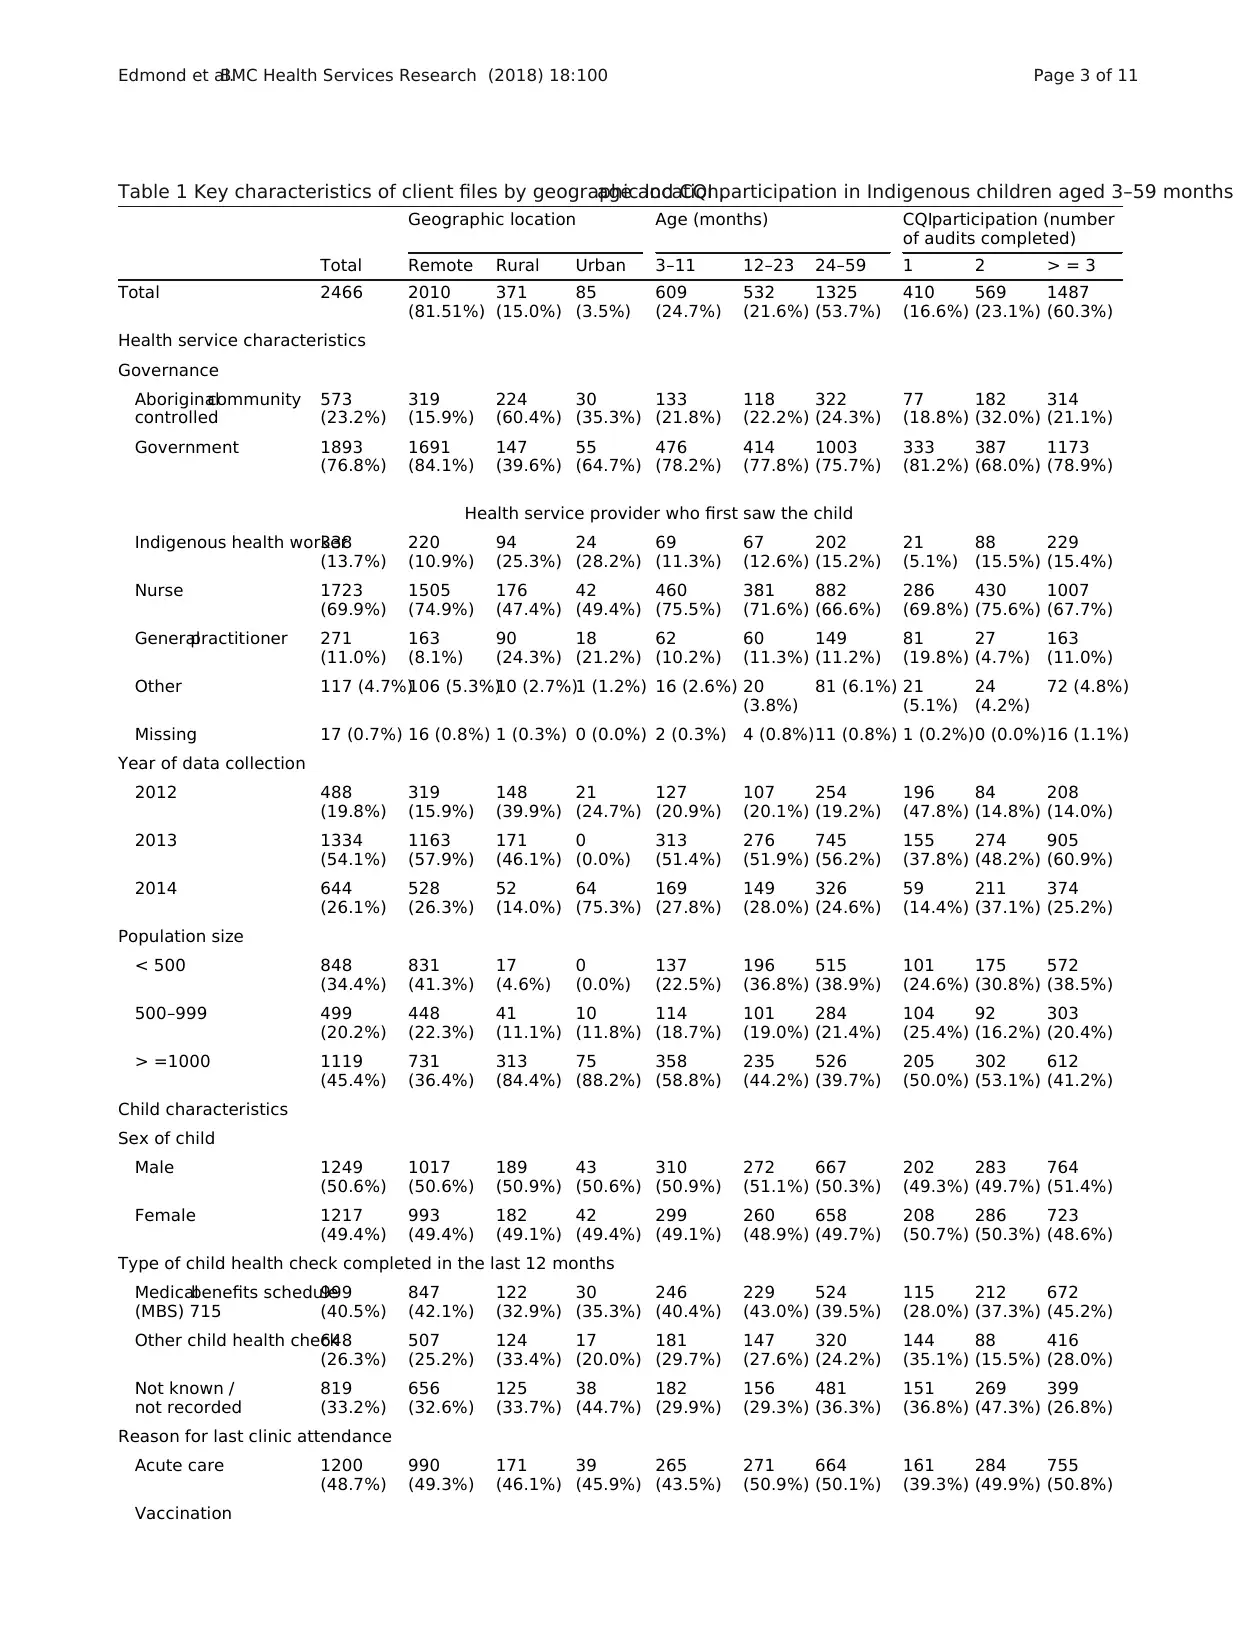
Key characteristics are presented in Table 1.
Data collection
The ABCD program included annualauditsof client
files in all participating primary care centers [9,10].The
auditswere implemented by primary care centerstaff
who had received standardised trainingwith ABCD
educatorsincluding assessmentof interraterreliability
[9,10].The training program was based on national best
practiceclinicalguidelinesand involved faceto face
training sessions using a standardised manualand data
collection tool which are available online [10,12].Client
files were eligible ifthe following criteria were met:i)
child aged between 3 months and 14 years at the audit
date;ii) child residentin the community forat least
6 months (or halfof the time since birth ifaged under
6 months);and iii)child had no major health anomaly
such as heart defects or inherited disorders.
A random sample ofat least 30 individualpatient re-
cords were selected for auditfrom each health center.
The auditors read each client file (electronic and paper)
and recorded information in a standardised pre-coded
data collection tool.Child characteristics included:date
of birth,age,sex,Indigenous status,attendance atthe
primary care center in the previous 12 months,reason
for the last attendance (acute care,health check,vaccin-
ation,other)and receiptof any child health checks in
the last12 months (Australian Commonwealth funded
[Medicare715] or other child health check).Health
centercharacteristicsincluded governance (Aboriginal
community controlled health service or government op-
erated),location (urban,rural or remote),and number
of CQI audits the primary care center had completed.
The ABCD audittool also included eleven pre-coded
items about social and emotionalwellbeingservices
(Table 2).The auditors scored ‘yes’in the audittool if
there had been any documentation in the clientfile in
the last12 monthsof: (i) assessmentof parentchild
interaction (e.g.bonding,attachment,responsiveness);
(ii) advice about:childhood domestic or socialenviron-
ment(e.g.violence,substance use,gambling);socialor
family support(e.g.otherfamily membersinvolved in
care of child,attendance at parent groups,socialworker
involvement);finances (e.g.regularemployment,social
service payments,food cards);housing condition (e.g.
overcrowding,water and sanitation);food security (e.g.
food consumed in the last24 h and in the lastweek);
physicaland mentalstimulation(e.g. play, reading,
attendance atplay groups);child behaviour (e.g.sleep,
crying,and temper tantrums);(iii) evidence ofconcern
about:domestic or socialenvironment;socialor family
support;housing condition;and food security;(iv) follow
up or referralregardingconcern aboutdomesticor
socialenvironment;socialor familysupport;housing
condition and food security.Items were recorded as ‘not
applicable’if they were not specified in the national best
practice guidelines for children ofthatage [5–7].The
items thatwere specified in the nationalbestpractice
guidelines for all families of children aged between 3 and
59 monthswere adviceabout:physicaland mental
stimulation for children;domestic or social environment;
social or family supportand adviceabout housing
condition.
Definitions
We defined a composite measure ofsocialand emo-
tionalwellbeing care for the four items required in the
national guidelines for all children aged 3–59 months i.e.
adviceprovided atleastonce in the last 12 months
about:domestic environment,socialsupport,housing
condition and child stimulation.The composite measure
was scored as ‘yes’if all four areas were documented in
Edmond et al.BMC Health Services Research (2018) 18:100 Page 2 of 11
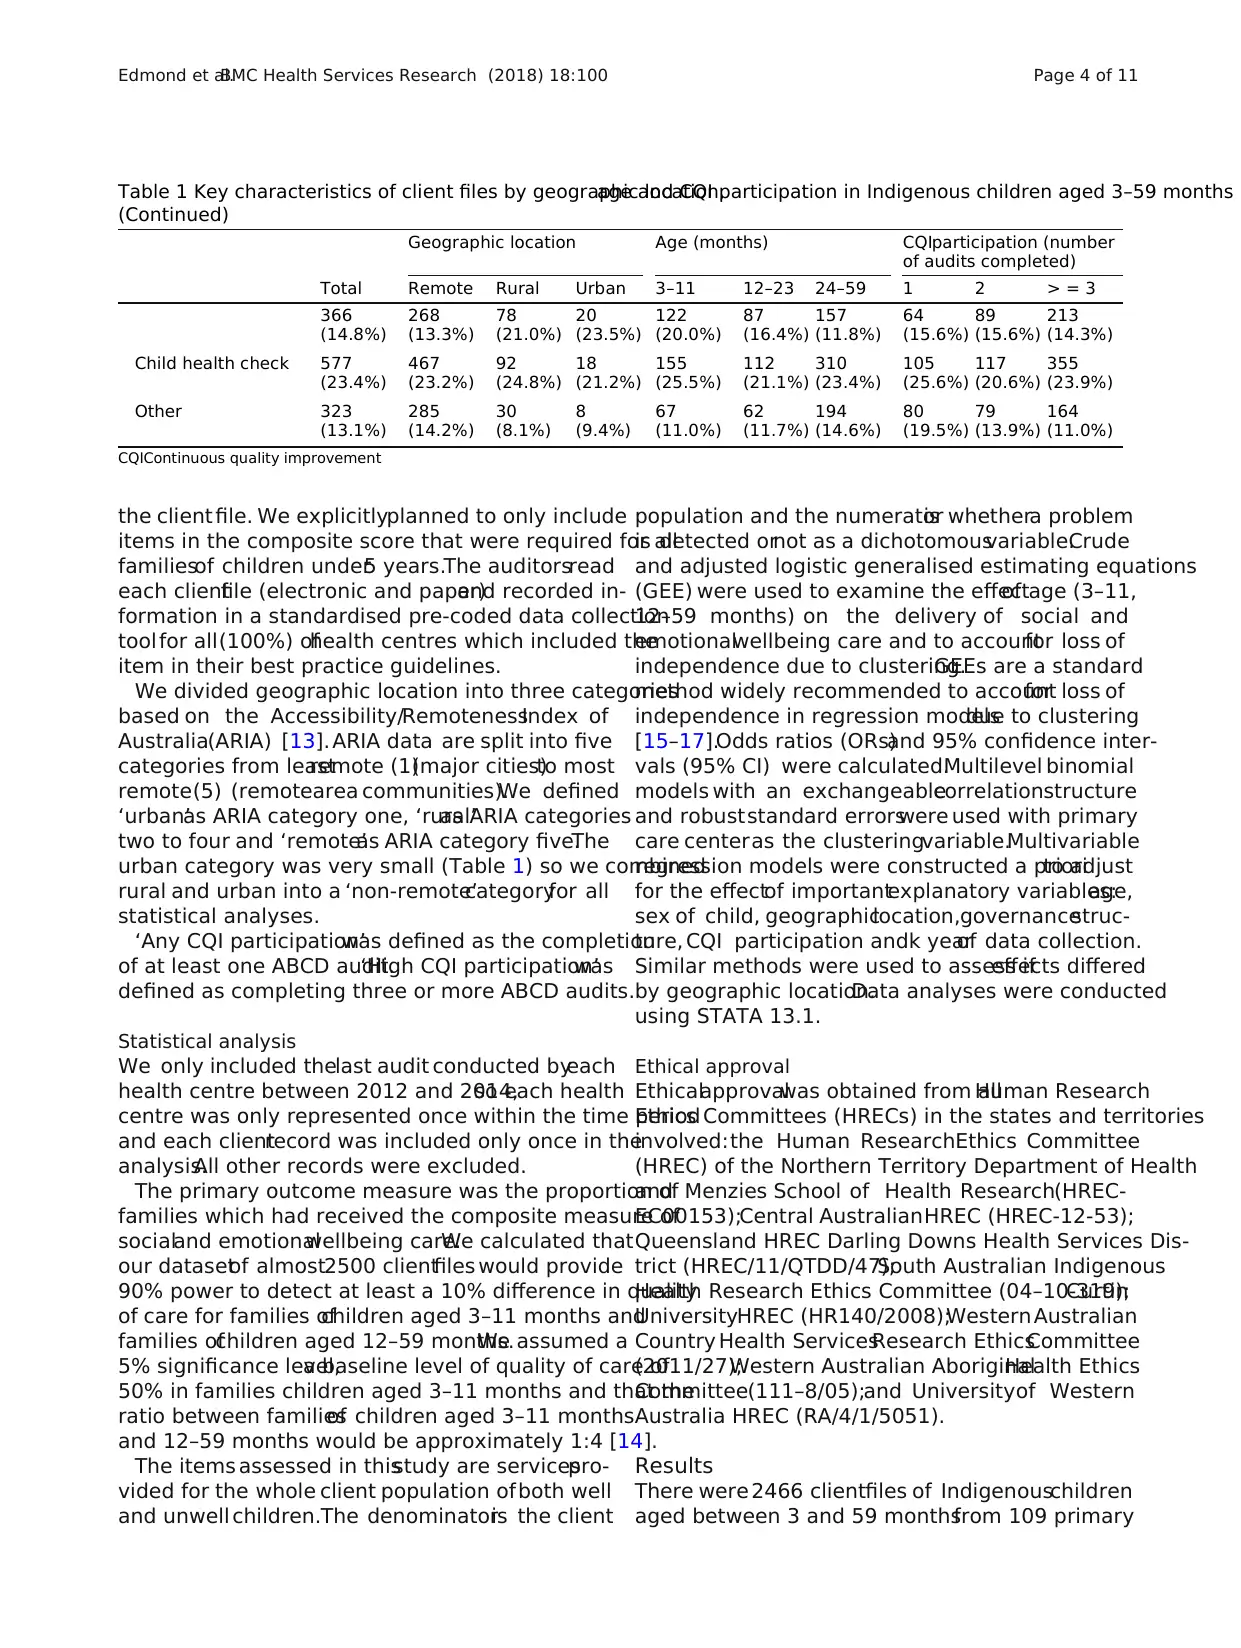
Table 1 Key characteristics of client files by geographic location,age and CQI participation in Indigenous children aged 3–59 months
Geographic location Age (months) CQIparticipation (number
of audits completed)
Total Remote Rural Urban 3–11 12–23 24–59 1 2 > = 3
Total 2466 2010
(81.51%)
371
(15.0%)
85
(3.5%)
609
(24.7%)
532
(21.6%)
1325
(53.7%)
410
(16.6%)
569
(23.1%)
1487
(60.3%)
Health service characteristics
Governance
Aboriginalcommunity
controlled
573
(23.2%)
319
(15.9%)
224
(60.4%)
30
(35.3%)
133
(21.8%)
118
(22.2%)
322
(24.3%)
77
(18.8%)
182
(32.0%)
314
(21.1%)
Government 1893
(76.8%)
1691
(84.1%)
147
(39.6%)
55
(64.7%)
476
(78.2%)
414
(77.8%)
1003
(75.7%)
333
(81.2%)
387
(68.0%)
1173
(78.9%)
Health service provider who first saw the child
Indigenous health worker338
(13.7%)
220
(10.9%)
94
(25.3%)
24
(28.2%)
69
(11.3%)
67
(12.6%)
202
(15.2%)
21
(5.1%)
88
(15.5%)
229
(15.4%)
Nurse 1723
(69.9%)
1505
(74.9%)
176
(47.4%)
42
(49.4%)
460
(75.5%)
381
(71.6%)
882
(66.6%)
286
(69.8%)
430
(75.6%)
1007
(67.7%)
Generalpractitioner 271
(11.0%)
163
(8.1%)
90
(24.3%)
18
(21.2%)
62
(10.2%)
60
(11.3%)
149
(11.2%)
81
(19.8%)
27
(4.7%)
163
(11.0%)
Other 117 (4.7%)106 (5.3%)10 (2.7%)1 (1.2%) 16 (2.6%) 20
(3.8%)
81 (6.1%) 21
(5.1%)
24
(4.2%)
72 (4.8%)
Missing 17 (0.7%) 16 (0.8%) 1 (0.3%) 0 (0.0%) 2 (0.3%) 4 (0.8%)11 (0.8%) 1 (0.2%)0 (0.0%)16 (1.1%)
Year of data collection
2012 488
(19.8%)
319
(15.9%)
148
(39.9%)
21
(24.7%)
127
(20.9%)
107
(20.1%)
254
(19.2%)
196
(47.8%)
84
(14.8%)
208
(14.0%)
2013 1334
(54.1%)
1163
(57.9%)
171
(46.1%)
0
(0.0%)
313
(51.4%)
276
(51.9%)
745
(56.2%)
155
(37.8%)
274
(48.2%)
905
(60.9%)
2014 644
(26.1%)
528
(26.3%)
52
(14.0%)
64
(75.3%)
169
(27.8%)
149
(28.0%)
326
(24.6%)
59
(14.4%)
211
(37.1%)
374
(25.2%)
Population size
< 500 848
(34.4%)
831
(41.3%)
17
(4.6%)
0
(0.0%)
137
(22.5%)
196
(36.8%)
515
(38.9%)
101
(24.6%)
175
(30.8%)
572
(38.5%)
500–999 499
(20.2%)
448
(22.3%)
41
(11.1%)
10
(11.8%)
114
(18.7%)
101
(19.0%)
284
(21.4%)
104
(25.4%)
92
(16.2%)
303
(20.4%)
> =1000 1119
(45.4%)
731
(36.4%)
313
(84.4%)
75
(88.2%)
358
(58.8%)
235
(44.2%)
526
(39.7%)
205
(50.0%)
302
(53.1%)
612
(41.2%)
Child characteristics
Sex of child
Male 1249
(50.6%)
1017
(50.6%)
189
(50.9%)
43
(50.6%)
310
(50.9%)
272
(51.1%)
667
(50.3%)
202
(49.3%)
283
(49.7%)
764
(51.4%)
Female 1217
(49.4%)
993
(49.4%)
182
(49.1%)
42
(49.4%)
299
(49.1%)
260
(48.9%)
658
(49.7%)
208
(50.7%)
286
(50.3%)
723
(48.6%)
Type of child health check completed in the last 12 months
Medicalbenefits schedule
(MBS) 715
999
(40.5%)
847
(42.1%)
122
(32.9%)
30
(35.3%)
246
(40.4%)
229
(43.0%)
524
(39.5%)
115
(28.0%)
212
(37.3%)
672
(45.2%)
Other child health check648
(26.3%)
507
(25.2%)
124
(33.4%)
17
(20.0%)
181
(29.7%)
147
(27.6%)
320
(24.2%)
144
(35.1%)
88
(15.5%)
416
(28.0%)
Not known /
not recorded
819
(33.2%)
656
(32.6%)
125
(33.7%)
38
(44.7%)
182
(29.9%)
156
(29.3%)
481
(36.3%)
151
(36.8%)
269
(47.3%)
399
(26.8%)
Reason for last clinic attendance
Acute care 1200
(48.7%)
990
(49.3%)
171
(46.1%)
39
(45.9%)
265
(43.5%)
271
(50.9%)
664
(50.1%)
161
(39.3%)
284
(49.9%)
755
(50.8%)
Vaccination
Edmond et al.BMC Health Services Research (2018) 18:100 Page 3 of 11
the client file. We explicitlyplanned to only include
items in the composite score that were required for all
familiesof children under5 years.The auditorsread
each clientfile (electronic and paper)and recorded in-
formation in a standardised pre-coded data collection
tool for all(100%) ofhealth centres which included the
item in their best practice guidelines.
We divided geographic location into three categories
based on the Accessibility/RemotenessIndex of
Australia(ARIA) [13]. ARIA data are split into five
categories from leastremote (1)(major cities)to most
remote(5) (remotearea communities).We defined
‘urban’as ARIA category one, ‘rural’as ARIA categories
two to four and ‘remote’as ARIA category five.The
urban category was very small (Table 1) so we combined
rural and urban into a ‘non-remote’categoryfor all
statistical analyses.
‘Any CQI participation’was defined as the completion
of at least one ABCD audit.‘High CQI participation’was
defined as completing three or more ABCD audits.
Statistical analysis
We only included thelast audit conducted byeach
health centre between 2012 and 2014,so each health
centre was only represented once within the time period
and each clientrecord was included only once in the
analysis.All other records were excluded.
The primary outcome measure was the proportion of
families which had received the composite measure of
socialand emotionalwellbeing care.We calculated that
our datasetof almost2500 clientfiles would provide
90% power to detect at least a 10% difference in quality
of care for families ofchildren aged 3–11 months and
families ofchildren aged 12–59 months.We assumed a
5% significance level,a baseline level of quality of care of
50% in families children aged 3–11 months and that the
ratio between familiesof children aged 3–11 months
and 12–59 months would be approximately 1:4 [14].
The items assessed in thisstudy are servicespro-
vided for the whole client population of both well
and unwell children.The denominatoris the client
population and the numeratoris whethera problem
is detected ornot as a dichotomousvariable.Crude
and adjusted logistic generalised estimating equations
(GEE) were used to examine the effectof age (3–11,
12–59 months) on the delivery of social and
emotionalwellbeing care and to accountfor loss of
independence due to clustering.GEEs are a standard
method widely recommended to accountfor loss of
independence in regression modelsdue to clustering
[15–17].Odds ratios (ORs)and 95% confidence inter-
vals (95% CI) were calculated.Multilevel binomial
models with an exchangeablecorrelationstructure
and robuststandard errorswere used with primary
care centeras the clusteringvariable.Multivariable
regression models were constructed a priorito adjust
for the effectof importantexplanatory variables:age,
sex of child, geographiclocation,governancestruc-
ture, CQI participation andk yearof data collection.
Similar methods were used to assess ifeffects differed
by geographic location.Data analyses were conducted
using STATA 13.1.
Ethical approval
Ethicalapprovalwas obtained from allHuman Research
Ethics Committees (HRECs) in the states and territories
involved:the Human ResearchEthics Committee
(HREC) of the Northern Territory Department of Health
and Menzies School of Health Research(HREC-
EC00153);Central AustralianHREC (HREC-12-53);
Queensland HREC Darling Downs Health Services Dis-
trict (HREC/11/QTDD/47);South Australian Indigenous
Health Research Ethics Committee (04–10-319);Curtin
UniversityHREC (HR140/2008);Western Australian
Country Health ServicesResearch EthicsCommittee
(2011/27);Western Australian AboriginalHealth Ethics
Committee(111–8/05);and Universityof Western
Australia HREC (RA/4/1/5051).
Results
There were 2466 clientfiles of Indigenouschildren
aged between 3 and 59 monthsfrom 109 primary
Table 1 Key characteristics of client files by geographic location,age and CQI participation in Indigenous children aged 3–59 months
(Continued)
Geographic location Age (months) CQIparticipation (number
of audits completed)
Total Remote Rural Urban 3–11 12–23 24–59 1 2 > = 3
366
(14.8%)
268
(13.3%)
78
(21.0%)
20
(23.5%)
122
(20.0%)
87
(16.4%)
157
(11.8%)
64
(15.6%)
89
(15.6%)
213
(14.3%)
Child health check 577
(23.4%)
467
(23.2%)
92
(24.8%)
18
(21.2%)
155
(25.5%)
112
(21.1%)
310
(23.4%)
105
(25.6%)
117
(20.6%)
355
(23.9%)
Other 323
(13.1%)
285
(14.2%)
30
(8.1%)
8
(9.4%)
67
(11.0%)
62
(11.7%)
194
(14.6%)
80
(19.5%)
79
(13.9%)
164
(11.0%)
CQIContinuous quality improvement
Edmond et al.BMC Health Services Research (2018) 18:100 Page 4 of 11
Secure Best Marks with AI Grader
Need help grading? Try our AI Grader for instant feedback on your assignments.
care centers across five Australian states and
territories (Northern Territory, Queensland,New
South Wales,South Australia and Western Australia)
from 2012 to 2014 (Table 1). The mean age of
children was27.3 months(standard deviation 16.8)
and the median was25 months(interquartile range
12 to 42).Eighty one percent(2010,81.5%)of audits
were performed in remote areasand only 3.5% (85)
in urban areas. 60.3% (1487)of audits were con-
ducted in clinicsthat had completed three ormore
audits (Table 1). There was little differencein the
characteristicsof health centersthat reviewed young
(3–11 months)and older (12–59 months)children
(Table 1). There were also few differencesbetween
the characteristicsof health centersin remote and
non remote locationsand those thatparticipated in
one or more ABCD audits (Table 1,Additionalfile 1:
Tables S1-S4).
All 100% (109)of primary care centers included the
eleven age specific social and emotional wellbeing items
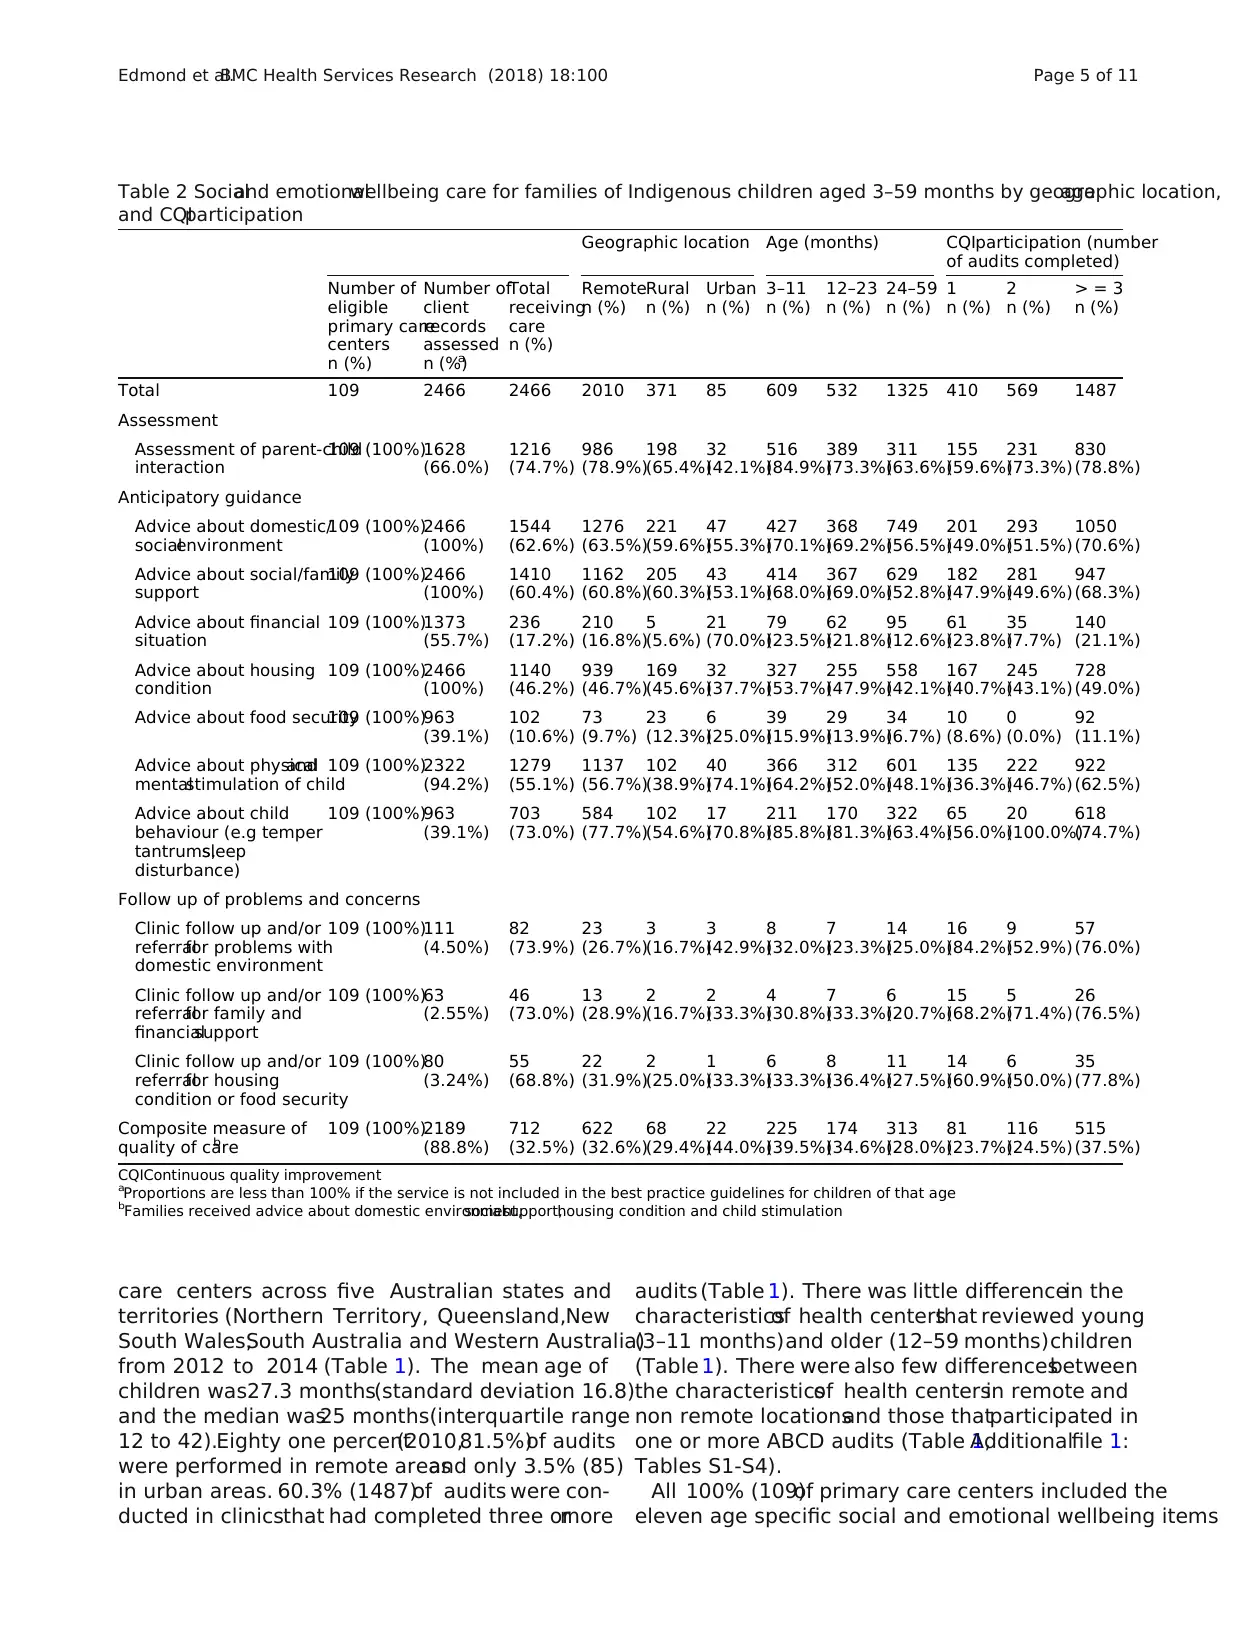
Table 2 Socialand emotionalwellbeing care for families of Indigenous children aged 3–59 months by geographic location,age
and CQIparticipation
Geographic location Age (months) CQIparticipation (number
of audits completed)
Number of
eligible
primary care
centers
n (%)
Number of
client
records
assessed
n (%)a
Total
receiving
care
n (%)
Remote
n (%)
Rural
n (%)
Urban
n (%)
3–11
n (%)
12–23
n (%)
24–59
n (%)
1
n (%)
2
n (%)
> = 3
n (%)
Total 109 2466 2466 2010 371 85 609 532 1325 410 569 1487
Assessment
Assessment of parent-child
interaction
109 (100%)1628
(66.0%)
1216
(74.7%)
986
(78.9%)
198
(65.4%)
32
(42.1%)
516
(84.9%)
389
(73.3%)
311
(63.6%)
155
(59.6%)
231
(73.3%)
830
(78.8%)
Anticipatory guidance
Advice about domestic/
socialenvironment
109 (100%)2466
(100%)
1544
(62.6%)
1276
(63.5%)
221
(59.6%)
47
(55.3%)
427
(70.1%)
368
(69.2%)
749
(56.5%)
201
(49.0%)
293
(51.5%)
1050
(70.6%)
Advice about social/family
support
109 (100%)2466
(100%)
1410
(60.4%)
1162
(60.8%)
205
(60.3%)
43
(53.1%)
414
(68.0%)
367
(69.0%)
629
(52.8%)
182
(47.9%)
281
(49.6%)
947
(68.3%)
Advice about financial
situation
109 (100%)1373
(55.7%)
236
(17.2%)
210
(16.8%)
5
(5.6%)
21
(70.0%)
79
(23.5%)
62
(21.8%)
95
(12.6%)
61
(23.8%)
35
(7.7%)
140
(21.1%)
Advice about housing
condition
109 (100%)2466
(100%)
1140
(46.2%)
939
(46.7%)
169
(45.6%)
32
(37.7%)
327
(53.7%)
255
(47.9%)
558
(42.1%)
167
(40.7%)
245
(43.1%)
728
(49.0%)
Advice about food security109 (100%)963
(39.1%)
102
(10.6%)
73
(9.7%)
23
(12.3%)
6
(25.0%)
39
(15.9%)
29
(13.9%)
34
(6.7%)
10
(8.6%)
0
(0.0%)
92
(11.1%)
Advice about physicaland
mentalstimulation of child
109 (100%)2322
(94.2%)
1279
(55.1%)
1137
(56.7%)
102
(38.9%)
40
(74.1%)
366
(64.2%)
312
(52.0%)
601
(48.1%)
135
(36.3%)
222
(46.7%)
922
(62.5%)
Advice about child
behaviour (e.g temper
tantrums,sleep
disturbance)
109 (100%)963
(39.1%)
703
(73.0%)
584
(77.7%)
102
(54.6%)
17
(70.8%)
211
(85.8%)
170
(81.3%)
322
(63.4%)
65
(56.0%)
20
(100.0%)
618
(74.7%)
Follow up of problems and concerns
Clinic follow up and/or
referralfor problems with
domestic environment
109 (100%)111
(4.50%)
82
(73.9%)
23
(26.7%)
3
(16.7%)
3
(42.9%)
8
(32.0%)
7
(23.3%)
14
(25.0%)
16
(84.2%)
9
(52.9%)
57
(76.0%)
Clinic follow up and/or
referralfor family and
financialsupport
109 (100%)63
(2.55%)
46
(73.0%)
13
(28.9%)
2
(16.7%)
2
(33.3%)
4
(30.8%)
7
(33.3%)
6
(20.7%)
15
(68.2%)
5
(71.4%)
26
(76.5%)
Clinic follow up and/or
referralfor housing
condition or food security
109 (100%)80
(3.24%)
55
(68.8%)
22
(31.9%)
2
(25.0%)
1
(33.3%)
6
(33.3%)
8
(36.4%)
11
(27.5%)
14
(60.9%)
6
(50.0%)
35
(77.8%)
Composite measure of
quality of careb
109 (100%)2189
(88.8%)
712
(32.5%)
622
(32.6%)
68
(29.4%)
22
(44.0%)
225
(39.5%)
174
(34.6%)
313
(28.0%)
81
(23.7%)
116
(24.5%)
515
(37.5%)
CQIContinuous quality improvement
aProportions are less than 100% if the service is not included in the best practice guidelines for children of that age
bFamilies received advice about domestic environment,socialsupport,housing condition and child stimulation
Edmond et al.BMC Health Services Research (2018) 18:100 Page 5 of 11
in their clinic protocols (Table 2).However,only 37 %
(37.5%,515) of families received the composite measure
of quality ofcare (advice about domestic environment,
socialsupport,housing condition and child stimula-
tion).The proportion offamilies who received specific
services ranged from 10.6% (102) (advice about food se-
curity) to 74.7% (1216)(assessmentof parentchild
interaction) (Table 2).Sixty two percent (62.5%,922) of
families received advice about child stimulation.
Seventy five percent (74.7%,618) received advice about
child behaviour.Almost 76% (75.9%,57) received clinic
follow up or referralfor concernsabout domestic
environment,76% (76.5%,26) received follow up for
concerns aboutfamily supportand financialsituation
and almost78% (77.8%,35) received follow up for
concerns about housing condition and food security.
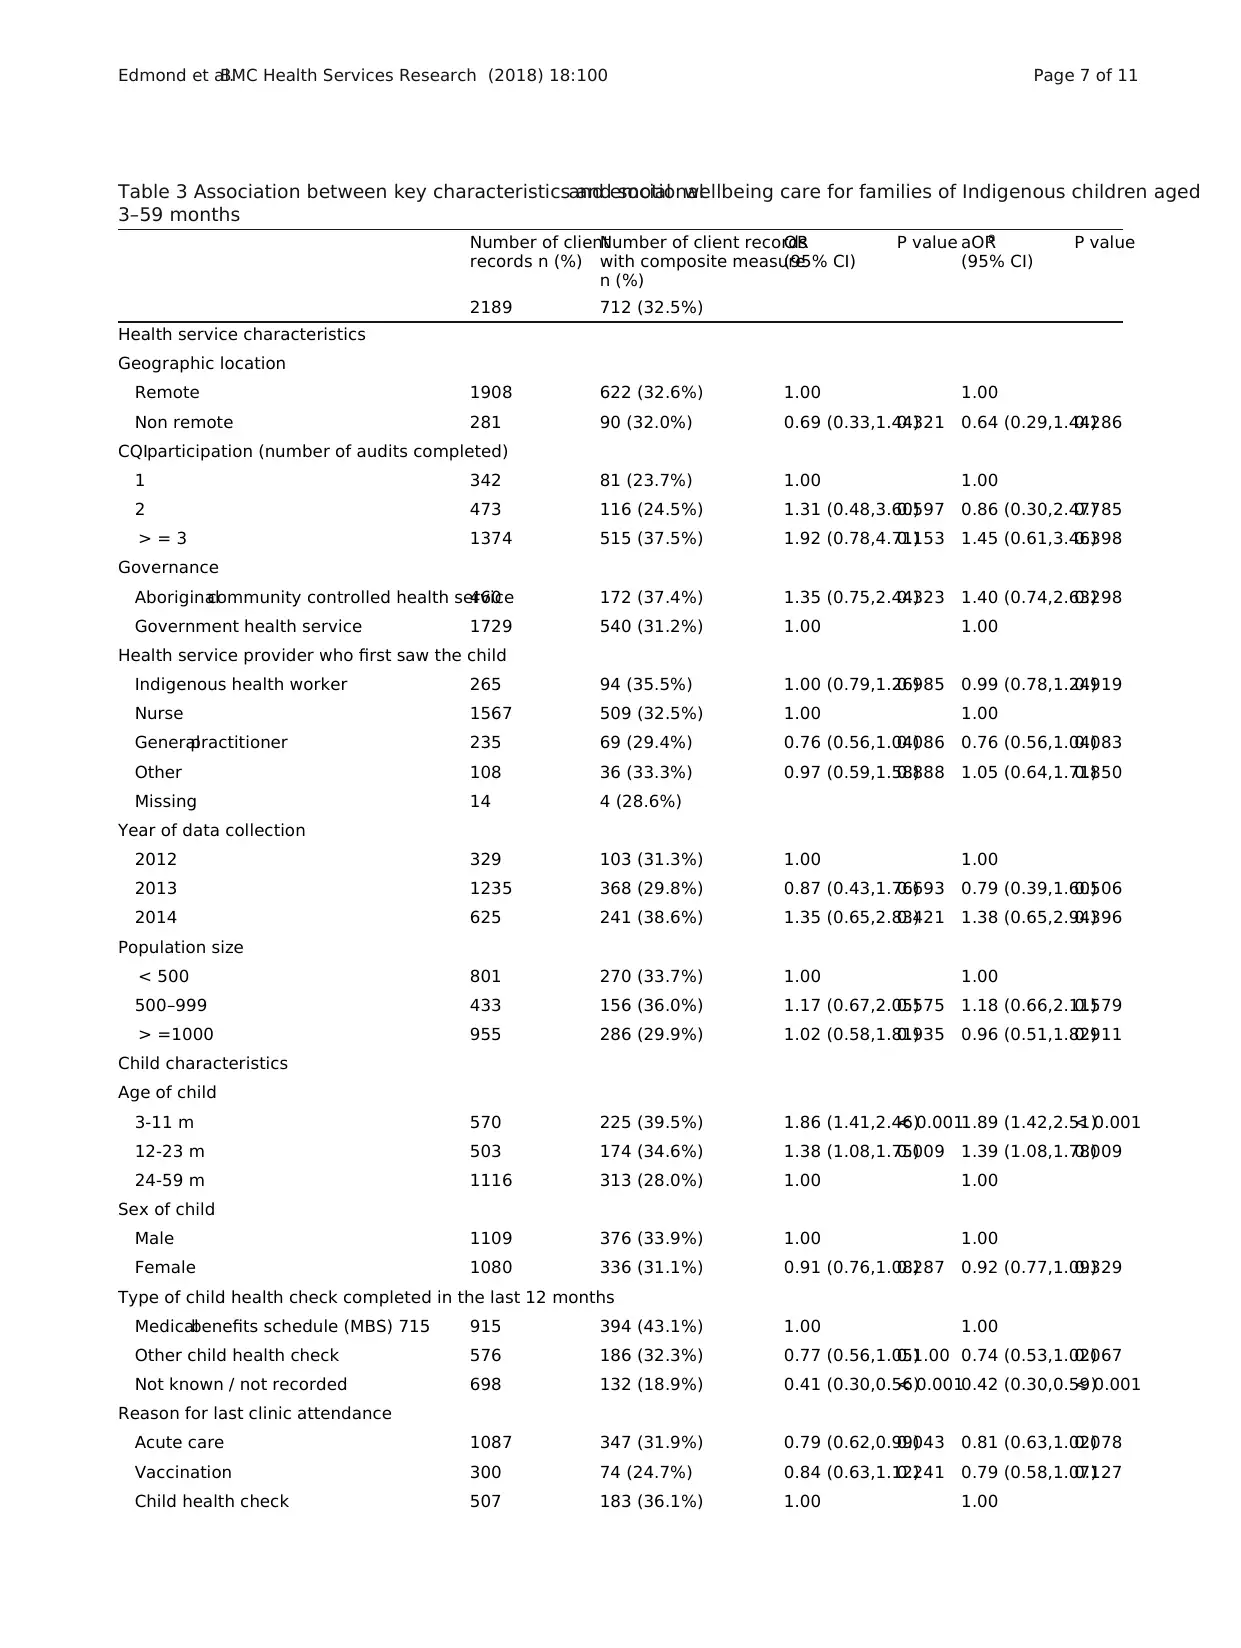
Age ofthe child was strongly associated with quality
of socialand emotionalwellbeing care (Tables 2 and 3).
Familiesof children aged 3–11 months(39.5%,225)
were more likely to receivethe compositemeasure
(adviceabout domesticenvironment,social support,
housing condition,child stimulation)than familiesof
children aged 12–59 months (30.0%,487) (adjusted odds
ratio [aOR] 1.68 95% CI 1.33 to 2.13).Families ofchil-
dren aged 3–11 months were also more likely to receive
the composite measure than familiesof children aged
12–23 months (34.6%,174) (aOR 1.39 95% CI 1.11,1.78)
and families of children aged 24–59 months (28.0%,313)
(aOR 1.89 95% CI 1.42,2.51).
Geographic location was notassociated with quality
of care (Tables 2 and 3).Families living in remote areas
(32.6%,622)had a similar composite measure to fam-
ilies living in rural(29.4%,68) and urban areas (44.0%,
22) (aOR 0.64 95% CI0.29,1.44).Familiesattending
centers with high CQIparticipation (completed three
or more ABCD audits) had a similar composite
measure(37.5%,515) to familiesattendingcenters
which had completed only one audit (23.7%,81) (aOR
1.45 95% CI0.61,3.46)(Table 2).In clinics with high
CQI participation,deliveryranged from 11.1% (92)
(adviceabout nutrition and food security)to 78.8%
(830) (assessment of parent child interaction) (Table 2).
Sixty two percent(62.5%,922) of familiesreceived
adviceabout stimulation oftheir child. Seventyfive
percent (74.7%,618) receivedadvice about child
behaviour.71% (126)of familiesreceived follow up
care.
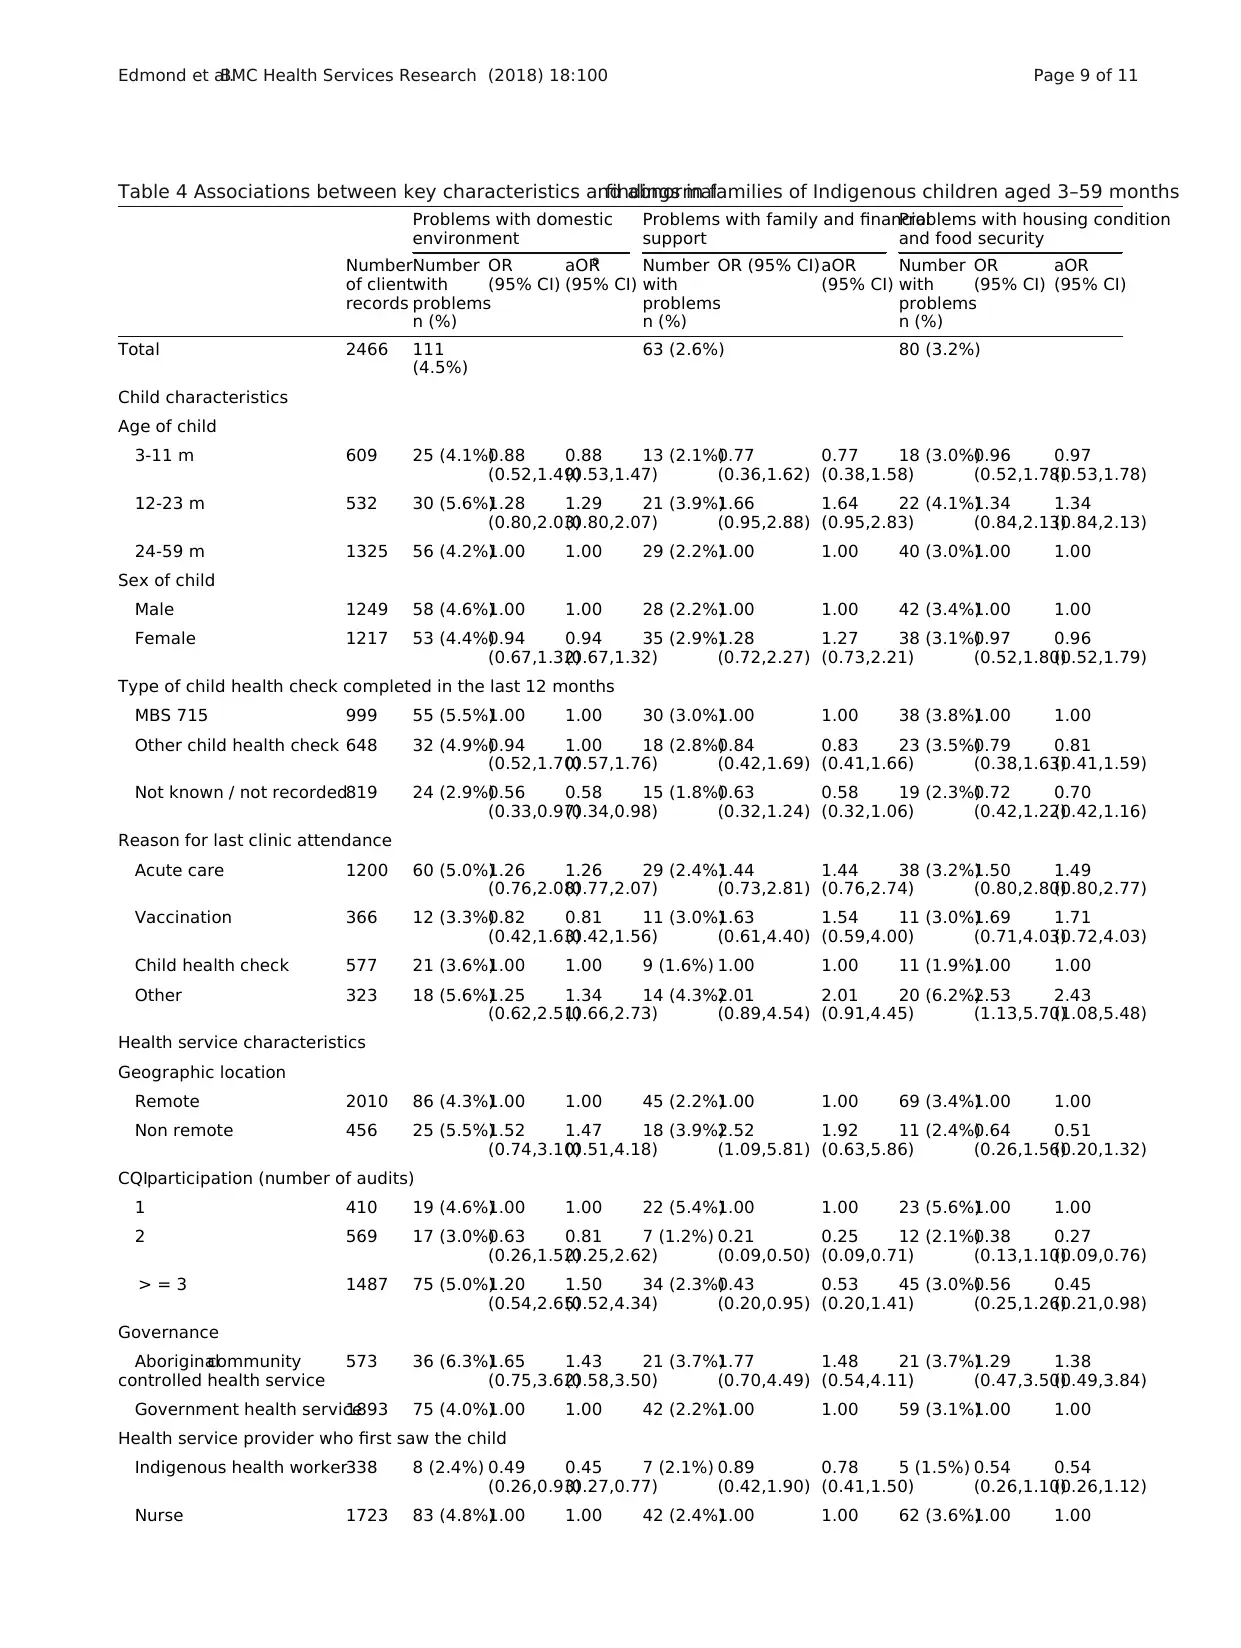
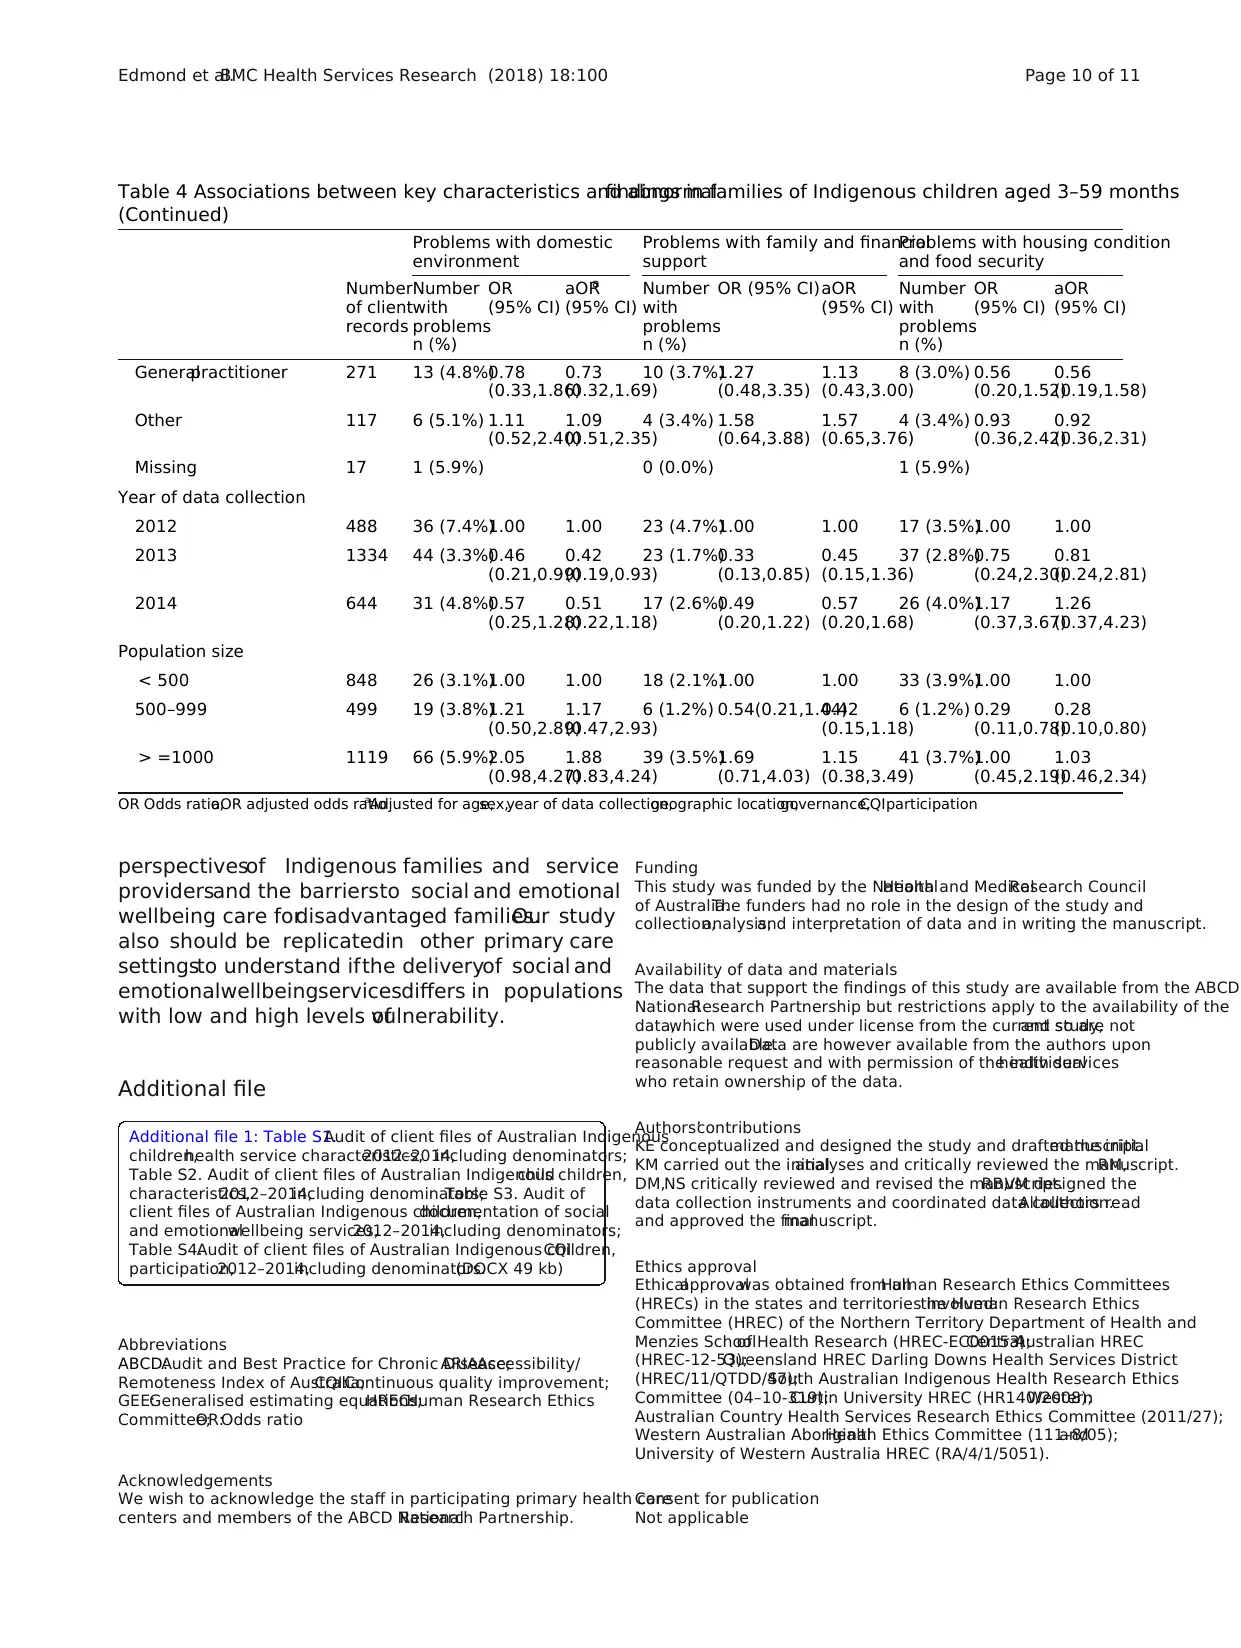
Only 4.5% (111)of familieswere reported to have
concernsaboutdomesticenvironment,2.6% (63)had
concerns about family support and 3.2% (80) had concerns
about housing and food security (Table 4). Two percent of
families(56,2.3%)had two ormore concerns.Overall
92.8% (2288)of familieswere reportedto have no
concerns.Age of the child was not associated with
reporting of concerns (Table 4). The proportion of families
who had at least one concern was also similar in remote
(7.1%, 143) and non remote areas (7.7%, 35) and in center
with high and low CQI participation (Table 4).
Discussion
To our knowledge,this is the first published report of
the quality ofsocialand emotionalwellbeing services
for familiesof young Indigenouschildren in primary
care centers.In our study,Indigenouschildren aged
less than 12 monthsappeared to receive priority for
socialand emotionalwellbeing care but many children
did not appear to be receiving services.There was little
difference in the documentation ofservices in remote,
rural and urban primary care centers.
In Australia,there are specific nationalguidelines for
socialand emotionalwellbeing services in primary care
centers [3,5–8],and allour primary care centers used
these bestpractice guidelines for socialand emotional
wellbeing care.However,socialand emotionalservices
did not appear to be welldelivered in the primary care
centers thatparticipated in our study.Delivery ranged
from 11% (advice aboutnutrition and food security)to
75% (assessment ofparent child interaction).Only 55%
of familiesreceived advice aboutstimulation oftheir
child and 73% received advice aboutchild behaviour.
Almost 25% of families had no clinic follow up or refer-
ral for concernsaboutdomesticenvironment,family
supportand financialsituation,housing condition and
food security.
Other Australian studies reporteven poorer quality
of socialand emotionalwellbeing care[18–22].Foe
example,only 7–40% of women in urban and ruralpri-
mary care centers in Western Australia received basic
advice aboutfamily and socialsupports and maternal
depression screening [19,21].In contrast,coverage of
childhood services such as vaccination has consistently
been above 92% at 12 months and 90% at 24 months in
Australian Indigenous children [23,24].It is likely that
families may value the provision ofvaccinations more
highly than socialand emotionalwellbeing services.
Providers may also find it less challenging to provide a
vaccinationthan to provide a lengthyconsultation
about socialand emotionalwellbeing.However,vaccin-
ation contacts provide opportunities for services such
as anticipatory guidance and socialsupport.The low
proportion offamiliesthat received socialand emo-
tionalwellbeing care in our study is disappointing and
indicates that there are many missed opportunities for
social and emotionalwellbeingcare in Australian
primary care centers.
In our study,we reported better provision ofsocial
and emotional wellbeing care in younger (3–11 months)
compared to older(12–59 months)children.Other
Edmond et al.BMC Health Services Research (2018) 18:100 Page 6 of 11
Table 3 Association between key characteristics and socialand emotionalwellbeing care for families of Indigenous children aged
3–59 months
Number of client
records n (%)
Number of client records
with composite measure
n (%)
OR
(95% CI)
P value aORa
(95% CI)
P value
2189 712 (32.5%)
Health service characteristics
Geographic location
Remote 1908 622 (32.6%) 1.00 1.00
Non remote 281 90 (32.0%) 0.69 (0.33,1.44)0.321 0.64 (0.29,1.44)0.286
CQIparticipation (number of audits completed)
1 342 81 (23.7%) 1.00 1.00
2 473 116 (24.5%) 1.31 (0.48,3.60)0.597 0.86 (0.30,2.47)0.785
> = 3 1374 515 (37.5%) 1.92 (0.78,4.71)0.153 1.45 (0.61,3.46)0.398
Governance
Aboriginalcommunity controlled health service460 172 (37.4%) 1.35 (0.75,2.44)0.323 1.40 (0.74,2.63)0.298
Government health service 1729 540 (31.2%) 1.00 1.00
Health service provider who first saw the child
Indigenous health worker 265 94 (35.5%) 1.00 (0.79,1.26)0.985 0.99 (0.78,1.24)0.919
Nurse 1567 509 (32.5%) 1.00 1.00
Generalpractitioner 235 69 (29.4%) 0.76 (0.56,1.04)0.086 0.76 (0.56,1.04)0.083
Other 108 36 (33.3%) 0.97 (0.59,1.58)0.888 1.05 (0.64,1.71)0.850
Missing 14 4 (28.6%)
Year of data collection
2012 329 103 (31.3%) 1.00 1.00
2013 1235 368 (29.8%) 0.87 (0.43,1.76)0.693 0.79 (0.39,1.60)0.506
2014 625 241 (38.6%) 1.35 (0.65,2.83)0.421 1.38 (0.65,2.94)0.396
Population size
< 500 801 270 (33.7%) 1.00 1.00
500–999 433 156 (36.0%) 1.17 (0.67,2.05)0.575 1.18 (0.66,2.11)0.579
> =1000 955 286 (29.9%) 1.02 (0.58,1.81)0.935 0.96 (0.51,1.82)0.911
Child characteristics
Age of child
3-11 m 570 225 (39.5%) 1.86 (1.41,2.46)< 0.0011.89 (1.42,2.51)< 0.001
12-23 m 503 174 (34.6%) 1.38 (1.08,1.75)0.009 1.39 (1.08,1.78)0.009
24-59 m 1116 313 (28.0%) 1.00 1.00
Sex of child
Male 1109 376 (33.9%) 1.00 1.00
Female 1080 336 (31.1%) 0.91 (0.76,1.08)0.287 0.92 (0.77,1.09)0.329
Type of child health check completed in the last 12 months
Medicalbenefits schedule (MBS) 715 915 394 (43.1%) 1.00 1.00
Other child health check 576 186 (32.3%) 0.77 (0.56,1.05)0.1.00 0.74 (0.53,1.02)0.067
Not known / not recorded 698 132 (18.9%) 0.41 (0.30,0.56)< 0.0010.42 (0.30,0.59)< 0.001
Reason for last clinic attendance
Acute care 1087 347 (31.9%) 0.79 (0.62,0.99)0.043 0.81 (0.63,1.02)0.078
Vaccination 300 74 (24.7%) 0.84 (0.63,1.12)0.241 0.79 (0.58,1.07)0.127
Child health check 507 183 (36.1%) 1.00 1.00
Edmond et al.BMC Health Services Research (2018) 18:100 Page 7 of 11
Paraphrase This Document
Need a fresh take? Get an instant paraphrase of this document with our AI Paraphraser
studies have reported better timeliness and coverage in
youngerchildren [25,26]. Low coverageof mental
health services and socialsupport for families of school
aged children and adolescents has also been reported
[27, 28]. However,there appear to be no other
published studiesthat have assessed quality ofsocial
and emotionalwellbeing services for young children in
primary care settings.There are more data on the deliv-
ery of primary care services across differing geographic
locations.Vaccine delivery,anaemiacare and oral
health care were reported to be better in smallremote
communities compared to urban areas [24,26,28,29].
Australian health service providers reportthat this is
due to better communication and engagementwith
smallerpopulation cohorts[27, 30]. We reported no
difference in the documentation of social and emotional
wellbeing care across remote,ruraland urban commu-
nities in our study.However,these analyses were under
powered as only four urban and 14 ruralclinics were
included in our study.
Our study had some limitations.We were only able
to include information thatwas documented in elec-
tronic and paper files and we were not able to include
observationsor interviewswith familiesor service
providers.We had smallnumbers in some subgroups
and statisticalpower was lacking in some analyses.The
primary care centers were notrandomly selected and
participation wasvoluntary,thus familieswith fewer
socialand emotionalproblems may have attended our
clinics.However,our study wasdesigned to measure
quality of care rather than disease burden,any selection
bias is likely to be non differential,and strengths of our
study include our large data set of over 2000 client files,
the large numberof participatingcentersand little
missing data.We accounted for clustering using multi-
levelbinomialmodels with an exchangeable correlation
structure and robuststandard errorswere used with
primary care centeras the clustering variable.Crude
and adjusted logistic generalised estimating equations
(GEE) were also used to account for loss ofindepend-
ence due to clustering.GEEs do notinclude measures
of ‘goodness-of-fit’and estimates are sensitive to out-
liers [15–17].However,we had no important outliers in
our paper and we did not require measures of goodness
of fit so we do not consider that these limitations are a
problem in our paper.Finally,our definition ofquality
of care included the explicit delivery of care by a health
service provider.This is consistent with the definitions
provided by Donabedian in the 1980s and 1990s which
are still used by many practitioners today [31,32].
Conclusions
In conclusion,our study clearly showed thatthe fam-
ilies of young Indigenous children receive priority for
social and emotionalwellbeingcare in Australian
primarycare centers,but manyIndigenouschildren
do not receive services.There was little difference in
services provided in remote,rural and urban primary
care centers.
Our study hasimplicationsfor policy and program
development.In contrastto primary care servicesin
many othercountries,Australian Aboriginalcommu-
nity controlled health serviceshavedeveloped from
models ofcomprehensive primary health care and the
socialand emotionalwellbeing offamiliesis at their
center [33–35]. However,many Indigenouspeople
have a high burden ofphysicaland mentalill health
and Indigenous health services have an important role
in proving acute curative care [34].Indigenous health
servicesare busy placesand primarycare providers
can find it difficult to perform all the preventive
servicesthat the clients need. Indeed,only 4% of
Indigenous diabetes patients were recently reported to
receive screening for depression in an urban
Australian health service [36].
Given theseconstraints,it is encouraging thatall
the primarycare centersin this studyincluded the
national best practice guidelines for social and
emotionalwellbeing care and thatimportantservices
such as adviceaboutchild stimulation,parentchild
interaction and child behaviourwere included.How-
ever,implementation and documentation ofsocialand
emotionalwellbeingcare must improvein primary
care centers that provide servicesto Indigenous
families.This requiresbetterresourcing,supervision
and training to improvethe multifaceted skillsthat
are needed to provide these services.It also requires
a greaterindepth qualitativeunderstandingof the
Table 3 Association between key characteristics and socialand emotionalwellbeing care for families of Indigenous children aged
3–59 months (Continued)
Number of client
records n (%)
Number of client records
with composite measure
n (%)
OR
(95% CI)
P value aORa
(95% CI)
P value
2189 712 (32.5%)
Other 295 108 (36.6%) 0.85 (0.62,1.17)0.324 0.92 (0.67,1.28)0.622
OR Odds ratio,aOR adjusted odds ratioaAdjusted for age,sex,year of data collection,geographic location,governance,CQIparticipation
Edmond et al.BMC Health Services Research (2018) 18:100 Page 8 of 11
Table 4 Associations between key characteristics and abnormalfindings in families of Indigenous children aged 3–59 months
Problems with domestic
environment
Problems with family and financial
support
Problems with housing condition
and food security
Number
of client
records
Number
with
problems
n (%)
OR
(95% CI)
aORa
(95% CI)
Number
with
problems
n (%)
OR (95% CI)aOR
(95% CI)
Number
with
problems
n (%)
OR
(95% CI)
aOR
(95% CI)
Total 2466 111
(4.5%)
63 (2.6%) 80 (3.2%)
Child characteristics
Age of child
3-11 m 609 25 (4.1%)0.88
(0.52,1.49)
0.88
(0.53,1.47)
13 (2.1%)0.77
(0.36,1.62)
0.77
(0.38,1.58)
18 (3.0%)0.96
(0.52,1.78)
0.97
(0.53,1.78)
12-23 m 532 30 (5.6%)1.28
(0.80,2.03)
1.29
(0.80,2.07)
21 (3.9%)1.66
(0.95,2.88)
1.64
(0.95,2.83)
22 (4.1%)1.34
(0.84,2.13)
1.34
(0.84,2.13)
24-59 m 1325 56 (4.2%)1.00 1.00 29 (2.2%)1.00 1.00 40 (3.0%)1.00 1.00
Sex of child
Male 1249 58 (4.6%)1.00 1.00 28 (2.2%)1.00 1.00 42 (3.4%)1.00 1.00
Female 1217 53 (4.4%)0.94
(0.67,1.32)
0.94
(0.67,1.32)
35 (2.9%)1.28
(0.72,2.27)
1.27
(0.73,2.21)
38 (3.1%)0.97
(0.52,1.80)
0.96
(0.52,1.79)
Type of child health check completed in the last 12 months
MBS 715 999 55 (5.5%)1.00 1.00 30 (3.0%)1.00 1.00 38 (3.8%)1.00 1.00
Other child health check 648 32 (4.9%)0.94
(0.52,1.70)
1.00
(0.57,1.76)
18 (2.8%)0.84
(0.42,1.69)
0.83
(0.41,1.66)
23 (3.5%)0.79
(0.38,1.63)
0.81
(0.41,1.59)
Not known / not recorded819 24 (2.9%)0.56
(0.33,0.97)
0.58
(0.34,0.98)
15 (1.8%)0.63
(0.32,1.24)
0.58
(0.32,1.06)
19 (2.3%)0.72
(0.42,1.22)
0.70
(0.42,1.16)
Reason for last clinic attendance
Acute care 1200 60 (5.0%)1.26
(0.76,2.08)
1.26
(0.77,2.07)
29 (2.4%)1.44
(0.73,2.81)
1.44
(0.76,2.74)
38 (3.2%)1.50
(0.80,2.80)
1.49
(0.80,2.77)
Vaccination 366 12 (3.3%)0.82
(0.42,1.63)
0.81
(0.42,1.56)
11 (3.0%)1.63
(0.61,4.40)
1.54
(0.59,4.00)
11 (3.0%)1.69
(0.71,4.03)
1.71
(0.72,4.03)
Child health check 577 21 (3.6%)1.00 1.00 9 (1.6%) 1.00 1.00 11 (1.9%)1.00 1.00
Other 323 18 (5.6%)1.25
(0.62,2.51)
1.34
(0.66,2.73)
14 (4.3%)2.01
(0.89,4.54)
2.01
(0.91,4.45)
20 (6.2%)2.53
(1.13,5.70)
2.43
(1.08,5.48)
Health service characteristics
Geographic location
Remote 2010 86 (4.3%)1.00 1.00 45 (2.2%)1.00 1.00 69 (3.4%)1.00 1.00
Non remote 456 25 (5.5%)1.52
(0.74,3.10)
1.47
(0.51,4.18)
18 (3.9%)2.52
(1.09,5.81)
1.92
(0.63,5.86)
11 (2.4%)0.64
(0.26,1.56)
0.51
(0.20,1.32)
CQIparticipation (number of audits)
1 410 19 (4.6%)1.00 1.00 22 (5.4%)1.00 1.00 23 (5.6%)1.00 1.00
2 569 17 (3.0%)0.63
(0.26,1.52)
0.81
(0.25,2.62)
7 (1.2%) 0.21
(0.09,0.50)
0.25
(0.09,0.71)
12 (2.1%)0.38
(0.13,1.10)
0.27
(0.09,0.76)
> = 3 1487 75 (5.0%)1.20
(0.54,2.65)
1.50
(0.52,4.34)
34 (2.3%)0.43
(0.20,0.95)
0.53
(0.20,1.41)
45 (3.0%)0.56
(0.25,1.26)
0.45
(0.21,0.98)
Governance
Aboriginalcommunity
controlled health service
573 36 (6.3%)1.65
(0.75,3.62)
1.43
(0.58,3.50)
21 (3.7%)1.77
(0.70,4.49)
1.48
(0.54,4.11)
21 (3.7%)1.29
(0.47,3.50)
1.38
(0.49,3.84)
Government health service1893 75 (4.0%)1.00 1.00 42 (2.2%)1.00 1.00 59 (3.1%)1.00 1.00
Health service provider who first saw the child
Indigenous health worker338 8 (2.4%) 0.49
(0.26,0.93)
0.45
(0.27,0.77)
7 (2.1%) 0.89
(0.42,1.90)
0.78
(0.41,1.50)
5 (1.5%) 0.54
(0.26,1.10)
0.54
(0.26,1.12)
Nurse 1723 83 (4.8%)1.00 1.00 42 (2.4%)1.00 1.00 62 (3.6%)1.00 1.00
Edmond et al.BMC Health Services Research (2018) 18:100 Page 9 of 11
perspectivesof Indigenous families and service
providersand the barriersto social and emotional
wellbeing care fordisadvantaged families.Our study
also should be replicatedin other primary care
settingsto understand ifthe deliveryof social and
emotionalwellbeingservicesdiffers in populations
with low and high levels ofvulnerability.
Additional file
Additional file 1: Table S1.Audit of client files of Australian Indigenous
children,health service characteristics,2012–2014,including denominators;
Table S2. Audit of client files of Australian Indigenous children,child
characteristics,2012–2014,including denominators;Table S3. Audit of
client files of Australian Indigenous children,documentation of social
and emotionalwellbeing services,2012–2014,including denominators;
Table S4.Audit of client files of Australian Indigenous children,CQI
participation,2012–2014,including denominators.(DOCX 49 kb)
Abbreviations
ABCD:Audit and Best Practice for Chronic Disease;ARIA:Accessibility/
Remoteness Index of Australia;CQI:Continuous quality improvement;
GEE:Generalised estimating equations;HREC:Human Research Ethics
Committee;OR:Odds ratio
Acknowledgements
We wish to acknowledge the staff in participating primary health care
centers and members of the ABCD NationalResearch Partnership.
Funding
This study was funded by the NationalHealth and MedicalResearch Council
of Australia.The funders had no role in the design of the study and
collection,analysis,and interpretation of data and in writing the manuscript.
Availability of data and materials
The data that support the findings of this study are available from the ABCD
NationalResearch Partnership but restrictions apply to the availability of the
data,which were used under license from the current study,and so are not
publicly available.Data are however available from the authors upon
reasonable request and with permission of the individualhealth services
who retain ownership of the data.
Authors’contributions
KE conceptualized and designed the study and drafted the initialmanuscript.
KM carried out the initialanalyses and critically reviewed the manuscript.RM,
DM,NS critically reviewed and revised the manuscript.RB,VM designed the
data collection instruments and coordinated data collection.Allauthors read
and approved the finalmanuscript.
Ethics approval
Ethicalapprovalwas obtained from allHuman Research Ethics Committees
(HRECs) in the states and territories involved:the Human Research Ethics
Committee (HREC) of the Northern Territory Department of Health and
Menzies Schoolof Health Research (HREC-EC00153);CentralAustralian HREC
(HREC-12-53);Queensland HREC Darling Downs Health Services District
(HREC/11/QTDD/47);South Australian Indigenous Health Research Ethics
Committee (04–10-319);Curtin University HREC (HR140/2008);Western
Australian Country Health Services Research Ethics Committee (2011/27);
Western Australian AboriginalHealth Ethics Committee (111–8/05);and
University of Western Australia HREC (RA/4/1/5051).
Consent for publication
Not applicable
Table 4 Associations between key characteristics and abnormalfindings in families of Indigenous children aged 3–59 months
(Continued)
Problems with domestic
environment
Problems with family and financial
support
Problems with housing condition
and food security
Number
of client
records
Number
with
problems
n (%)
OR
(95% CI)
aORa
(95% CI)
Number
with
problems
n (%)
OR (95% CI)aOR
(95% CI)
Number
with
problems
n (%)
OR
(95% CI)
aOR
(95% CI)
Generalpractitioner 271 13 (4.8%)0.78
(0.33,1.86)
0.73
(0.32,1.69)
10 (3.7%)1.27
(0.48,3.35)
1.13
(0.43,3.00)
8 (3.0%) 0.56
(0.20,1.52)
0.56
(0.19,1.58)
Other 117 6 (5.1%) 1.11
(0.52,2.40)
1.09
(0.51,2.35)
4 (3.4%) 1.58
(0.64,3.88)
1.57
(0.65,3.76)
4 (3.4%) 0.93
(0.36,2.42)
0.92
(0.36,2.31)
Missing 17 1 (5.9%) 0 (0.0%) 1 (5.9%)
Year of data collection
2012 488 36 (7.4%)1.00 1.00 23 (4.7%)1.00 1.00 17 (3.5%)1.00 1.00
2013 1334 44 (3.3%)0.46
(0.21,0.99)
0.42
(0.19,0.93)
23 (1.7%)0.33
(0.13,0.85)
0.45
(0.15,1.36)
37 (2.8%)0.75
(0.24,2.30)
0.81
(0.24,2.81)
2014 644 31 (4.8%)0.57
(0.25,1.28)
0.51
(0.22,1.18)
17 (2.6%)0.49
(0.20,1.22)
0.57
(0.20,1.68)
26 (4.0%)1.17
(0.37,3.67)
1.26
(0.37,4.23)
Population size
< 500 848 26 (3.1%)1.00 1.00 18 (2.1%)1.00 1.00 33 (3.9%)1.00 1.00
500–999 499 19 (3.8%)1.21
(0.50,2.89)
1.17
(0.47,2.93)
6 (1.2%) 0.54(0.21,1.44)0.42
(0.15,1.18)
6 (1.2%) 0.29
(0.11,0.78)
0.28
(0.10,0.80)
> =1000 1119 66 (5.9%)2.05
(0.98,4.27)
1.88
(0.83,4.24)
39 (3.5%)1.69
(0.71,4.03)
1.15
(0.38,3.49)
41 (3.7%)1.00
(0.45,2.19)
1.03
(0.46,2.34)
OR Odds ratio,aOR adjusted odds ratioaAdjusted for age,sex,year of data collection,geographic location,governance,CQIparticipation
Edmond et al.BMC Health Services Research (2018) 18:100 Page 10 of 11
Secure Best Marks with AI Grader
Need help grading? Try our AI Grader for instant feedback on your assignments.
Competing interests
The authors declare that they have no competing interests.
Publisher’s Note
Springer Nature remains neutralwith regard to jurisdictionalclaims in
published maps and institutionalaffiliations.
Author details
1Schoolof Medicine,Division Paediatrics,The University of Western Australia,
35 Stirling Highway,Crawley,Western Australia 6009,Australia.2Edith Cowen
University,Perth,Western Australia,Australia.3University Centre for Rural
Health,University of Sydney,61 Uralba Street,Lismore,New South Wales
2480,Australia.4Schoolof Psychology and Exercise Science,Murdoch
University,90 South Street,Murdoch,Western Australia 6150,Australia.
Received:15 June 2016 Accepted:23 January 2018
References
1. Shonkoff JP,Boyce WT,McEwen BS.Neuroscience,molecular biology,and
the childhood roots of health disparities:building a new framework for
health promotion and disease prevention.JAMA.2009;301(21):2252–9.
2. Blair M,HallD.From health surveillance to health promotion:the changing
focus in preventive children's services.Arch Dis Child.2006;91(9):730–5.
3. Fremantle E,ZurynskiYA,Mahajan D,D'Antoine H,Elliott EJ.Indigenous
child health:urgent need for improved data to underpin better health
outcomes.Med J Aust.2008;188(10):588–91.
4. Engle PL,Fernald LC,Alderman H,et al.Strategies for reducing inequalities
and improving developmentaloutcomes for young children in low-income
and middle-income countries.Lancet.2011;378(9799):1339–53.
5. Health assessment for Aboriginaland Torres Strait Islander people (MBS
Item 715).http://www.health.gov.au/internet/main/publishing.nsf/Content/
mbsprimarycare_ATSI_MBSitem715 Accessed 9 Apr 2016.
6. NACCHO/RACGP.Nationalguide to a preventive health assessment for
Aboriginaland Torres Strait Islander people.2nd ed.South Melbourne:The
RACGP;2012.http://www.naccho.org.au/download/aboriginal-health/1.
National%20guide%20to%20a%20preventive%20health%20assessment
%20for%20Aboriginal%20and%20Torres%20Strait%20Islander%20people
%20%282%29.pdf Accessed 8 Apr 2016
7. Steering Committee for the Review of Government Service Provision.
Overcoming Indigenous Disadvantage:Key Indicators 2014.Canberra.
Accessed 7 Apr 2016:Productivity Commission;2014.
8. Department of Health,Northern Territory.Healthy Under Five Kids Program,
2010.http://remotehealthatlas.nt.gov.au/healthy_under_5_kids_program.pdf
Accessed 1 Apr 2016.
9. Bailie R,Sibthorpe B,Gardner K,SiD.Quality improvement in indigenous
primary health care:history,current initiatives and future directions.Aust J
Primary Health.2008;14:53–7.
10. Bailie R,SiD,Shannon C,et al.Study protocol:nationalresearch partnership
to improve primary health care performance and outcomes for indigenous
peoples.BMC Health Serv Res.2010;10(1):129.
11. One Twenty One Seventy.NationalCentre for Quality Improvement in
Indigenous Primary Health Care.http://www.one21seventy.org.au/ Accessed
5 Feb 2016.
12. Child Health Audit Tool.ABCD 2010.http://www.one21seventy.org.au/
resources?keys=child+health+audit+tool&field_category_tid[]=24&field_
type_tid[]=27&items_per_page=AllAccessed 1 Feb 2106.
13. Commonwealth Department of Health and Aged Care:Measuring remoteness:
Accessibility/remoteness index of Australia (ARIA).Revised edition.Information
and Research Branch Occasional Papers:New Series Number 14 2001.
14. Kirkwood BR,Sterne JAC.EssentialMedicalStatistics.2nd ed.Oxford:
BlackwellScience Ltd;2003.
15. Aloisio KM,Swanson SA,MicaliN,Field A,Horton NJ.Analysis of partially
observed clustered data using generalized estimating equations and
multiple imputation.Stata J.2014;14(4):863–83.
16. Hubbard AE,Ahern J,FleischerNL,et al.To GEE ornot to GEE:
comparing population average and mixed models forestimating the
associations between neighborhood risk factors and health.
Epidemiology.2010;21(4):467–74.
17. Wang M.Generalized estimating equations in longitudinaldata analysis:a
review and recent developments.Adv Stat.2014:1–11.
18. Gausia K,Thompson S,NagelT,et al.Antenatalemotionalwellbeing
screening in aboriginaland Torres Strait islander primary health care
services in Australia.Contemp Nurse.2013;46(1):73–82.
19. Gausia K,Thompson SC,NagelT, SchierhoutG, Matthews V,Bailie R.
Risk ofantenatalpsychosocialdistress in indigenous women and its
managementat primary health care centres in Australia.Gen Hosp
Psychiatry.2015;37(4):335–9.
20. Rumbold A,Bailie R,SiD,et al.Assessing the quality of maternalhealth care
in indigenous primary care services.Med J Aust.2010;192(10):597–8.
21. Rumbold A,Bailie R,SiD,et al.Delivery of maternalhealth care in
indigenous primary care services:baseline data for an ongoing quality
improvement initiative.BMC Pregnancy Childbirth.2011;11(1):16.
22. Bar-Zeev SBL,Kruske S,Kildea S.Factors affecting the quality of antenatal
care provided to remote dwelling aboriginalwomen in northern Australia.
Midwifery.2013;2013(Jun 25):S0266–6138(13).00127-7
23. Bailie RS,SiD,Dowden MC,et al.A systems approach to improving
timeliness of immunisation.Vaccine.2009;27(27):3669–74.
24. Naidu L,Chiu C,Habig A,et al.Vaccine preventable diseases and
vaccination coverage in aboriginaland Torres Strait islander people,
Australia 2006-2010.Commun Dis IntellQ Rep.2013;37 Suppl:S1–95.
25. HullB,Dey A,Menzies R,McIntyre P.Annualimmunisation coverage report,
2010.Commun Dis IntellQ Rep.2013;37(1):E21–39.
26. O'Grady KA,Krause V,Andrews R.Immunisation coverage in Australian
indigenous children:time to move the goal posts.Vaccine.2009;27(2):307–12.
27. Gardner KL,Dowden M,TogniS,Bailie R.Understanding uptake of
continuous quality improvement in indigenous primary health care:lessons
from a multi-site case study of the audit and best practice for chronic
disease project.Implement Sci.2010;5:21.
28. Li SQ,Guthridge SL,Tursan d’Espaignet E,Paterson BA.From infancy to
young adulthood:health status in the northern territory 2006.Darwin:
Department of Health and Community Services;2007.
29. Bar-Zeev SJ,Kruske SG,Barclay LM,Bar-Zeev N,Kildea SV.Adherence to
management guidelines for growth faltering and anaemia in remote
dwelling Australian Aboriginalinfants and barriers to health service delivery.
BMC Health Serv Res.2013 Jul3;13:250.
30. Bailie R,Stevens M,McDonald E,Brewster D,Guthridge S.Exploring cross-
sectionalassociations between common childhood illness,housing and
socialconditions in remote Australian aboriginalcommunities.BMC Public
Health.2010;10:147.
31. Donabedian A.The quality of care.How can it be assessed? JAMA.1988;
260(12):1743–8.
32. Donabedian A.The seven pillars of quality.Arch PatholLab Med.1990;
114(11):1115–8.
33. Anaf J,Baum F,Freeman T,et al.Factors shaping intersectoralaction in
primary health care services.Aust N Z J Public Health.2014;38(6):553–9.
34. Baum FE.Comprehensive primary health care and socialdeterminants as
top priorities.Med J Aust.2014;200(2):86–7.
35. Browne-Yung K,Ziersch A,Baum F,Gallaher G.AboriginalAustralians’
experience of socialcapitaland its relevance to health and wellbeing in
urban settings.Soc SciMed.2013;97:20–8.
36. Schierhout G,NagelT,SiD,Connors C,Brown A,Bailie R.Do competing
demands of physicalillness in type 2 diabetes influence depression
screening,documentation and management in primary care:a cross-
sectionalanalytic study in aboriginaland Torres Strait islander primary
health care settings.Int J Ment Health Syst.2013;7(1):16.
• We accept pre-submission inquiries
• Our selector tool helps you to find the most relevant journal
• We provide round the clock customer support
• Convenient online submission
• Thorough peer review
• Inclusion in PubMed and all major indexing services
• Maximum visibility for your research
Submit your manuscript at
www.biomedcentral.com/submit
Submit your next manuscript to BioMed Central
and we will help you at every step:
Edmond et al.BMC Health Services Research (2018) 18:100 Page 11 of 11
1 out of 11
Related Documents
Your All-in-One AI-Powered Toolkit for Academic Success.
+13062052269
info@desklib.com
Available 24*7 on WhatsApp / Email
Unlock your academic potential
© 2024 | Zucol Services PVT LTD | All rights reserved.