Effects of Solution Concentrations on Potato Osmosis Lab Report
VerifiedAdded on 2023/04/11
|11
|1651
|245
AI Summary
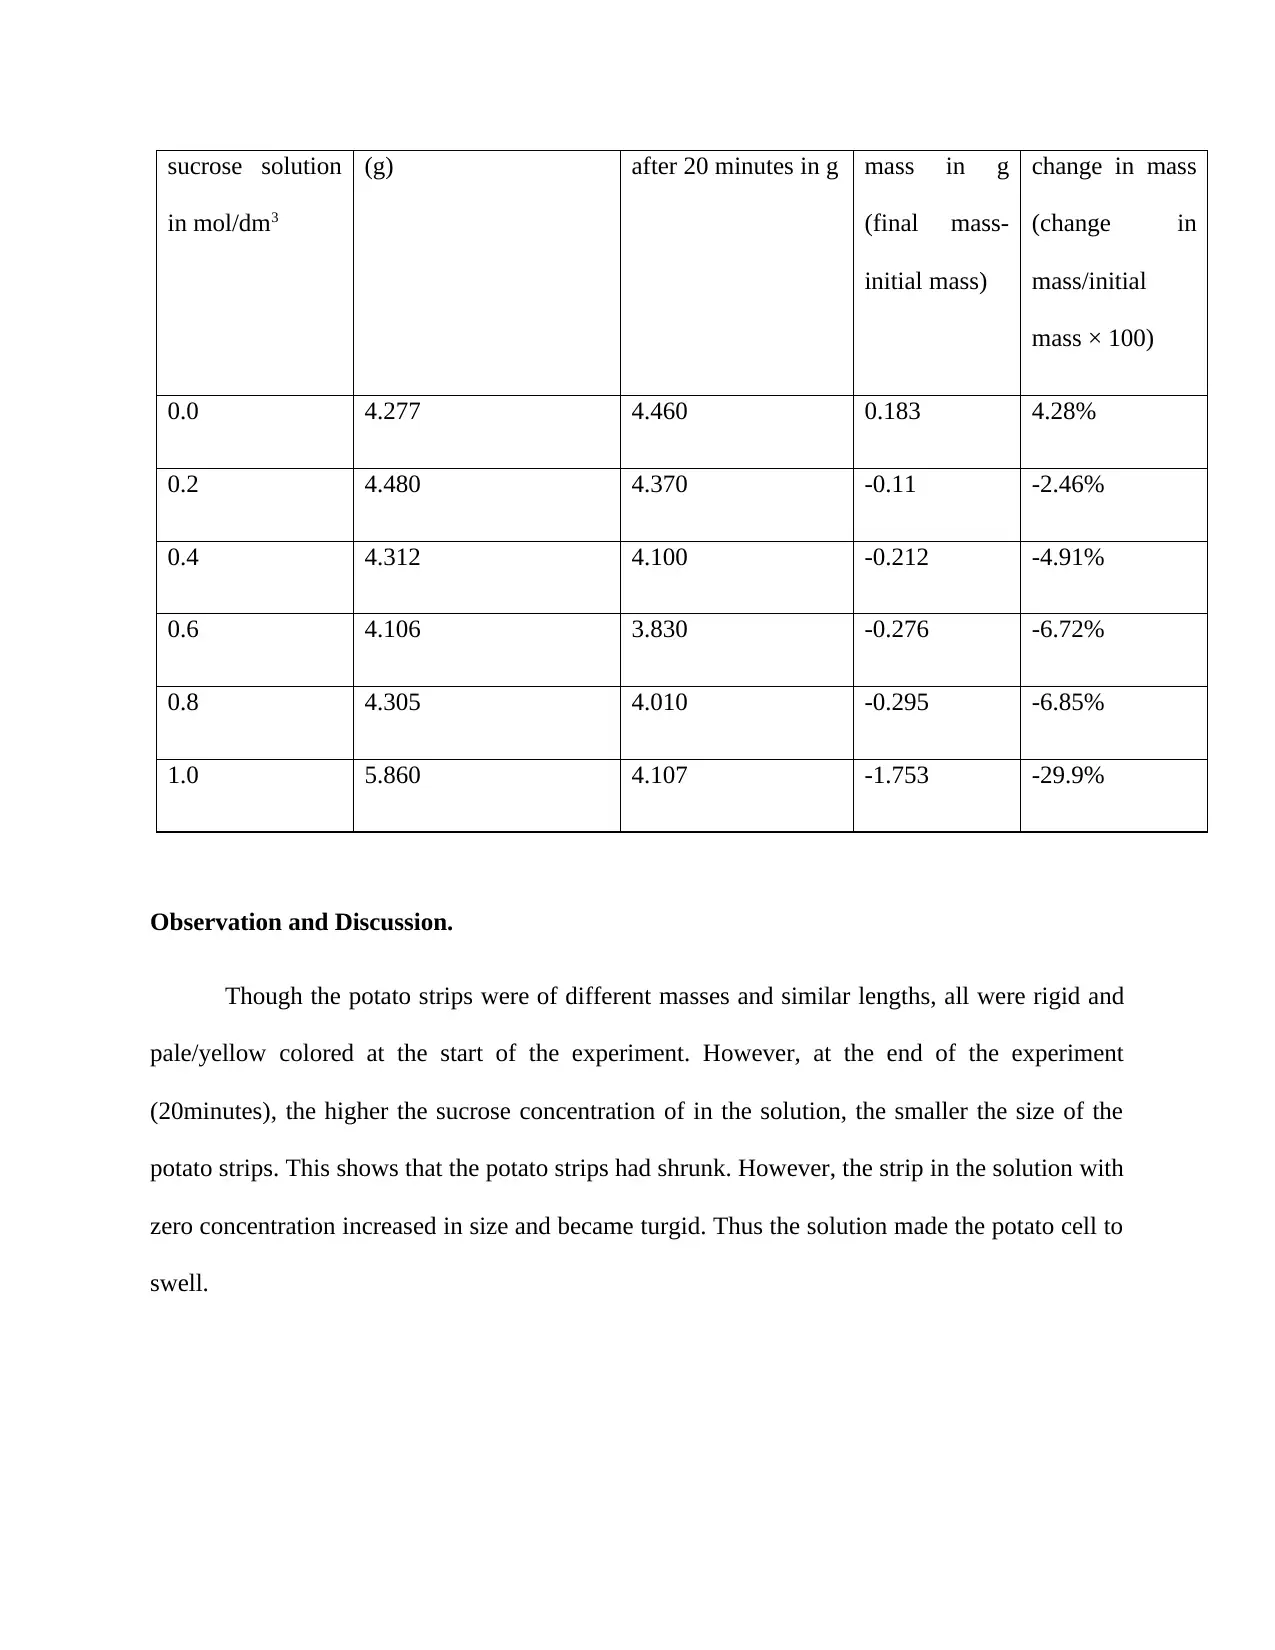
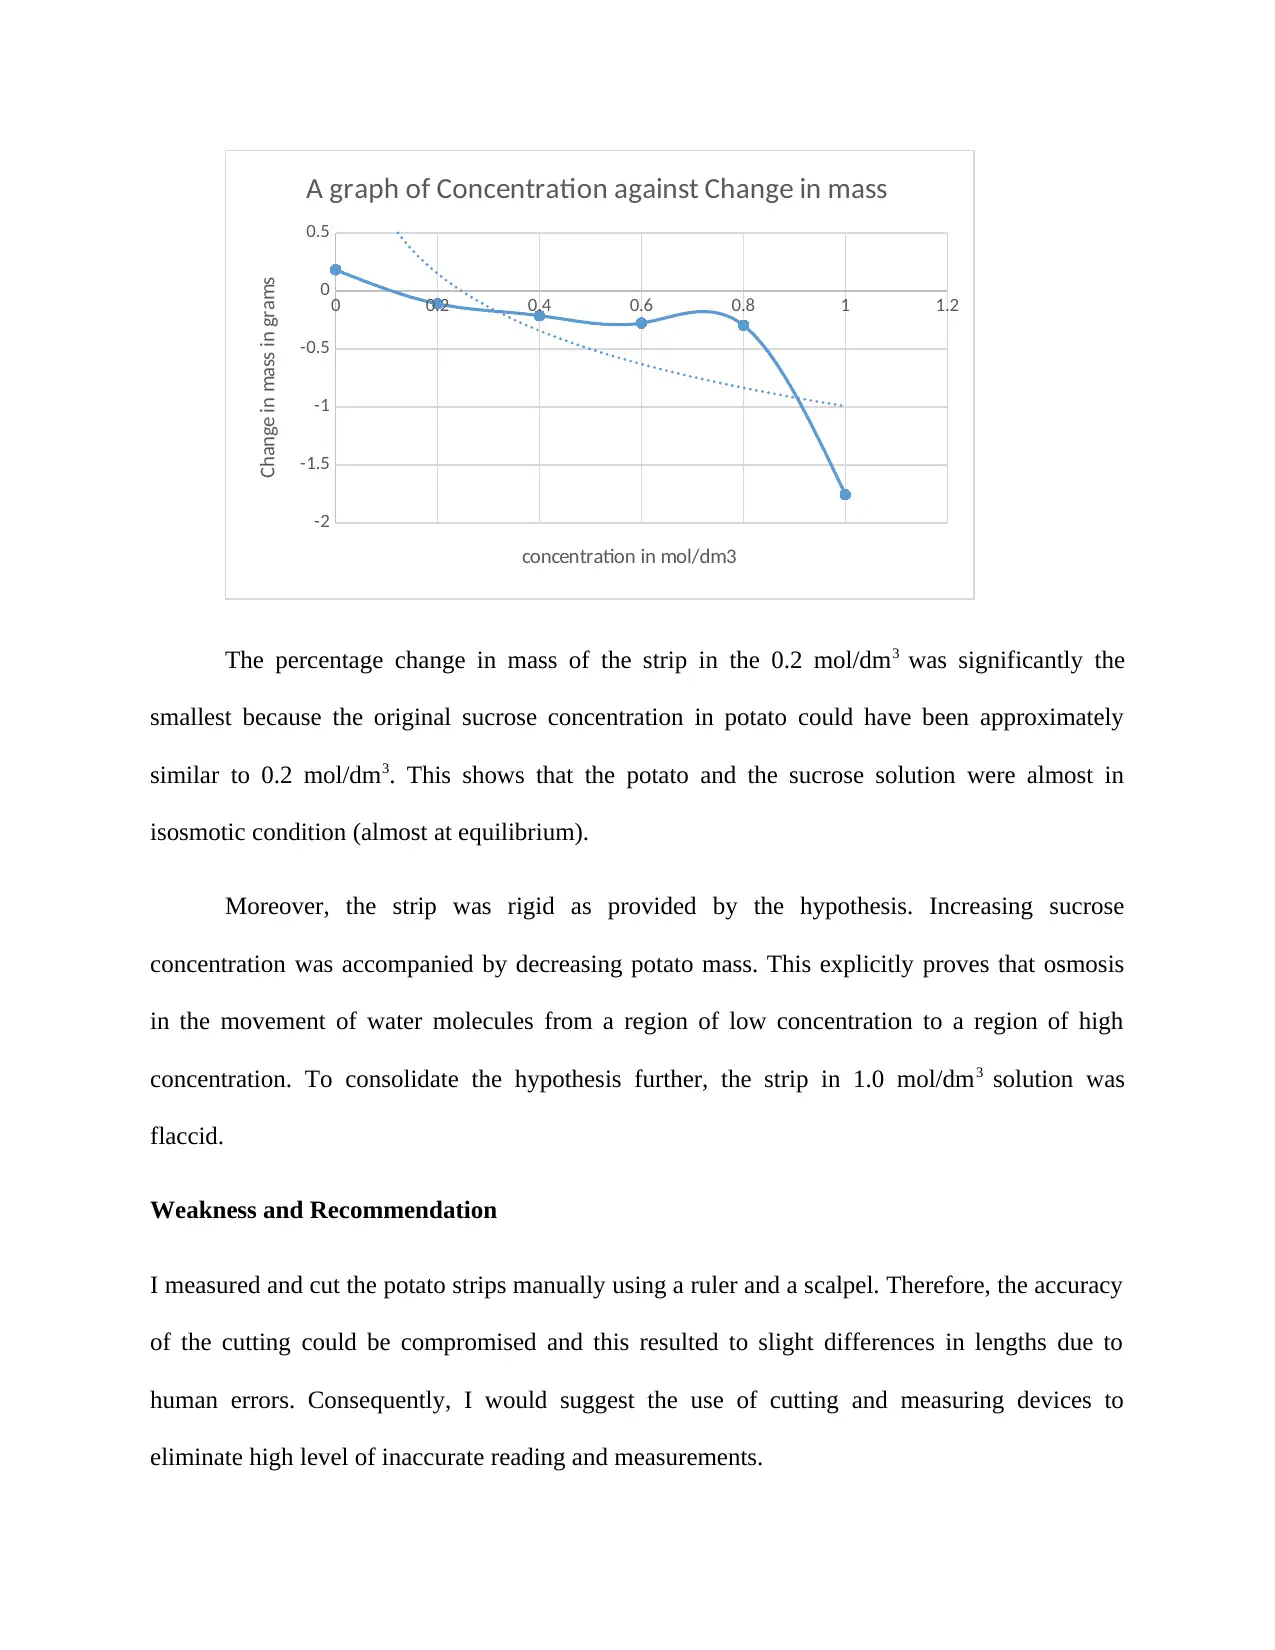
This lab report investigates the effects of varying sucrose solution concentrations on potato strips to demonstrate osmosis. The experiment involved preparing sucrose solutions of different molarities and observing the changes in mass and rigidity of potato strips immersed in these solutions for 20 minutes. The results indicated that potato strips in higher sucrose concentrations lost mass and became flaccid, while those in distilled water gained mass and became turgid. The report includes a detailed methodology, results table, a graph plotting concentration against change in mass, and a discussion of the findings in relation to osmosis principles. The conclusion supports the hypothesis that osmosis is controlled by solution concentration, with water moving from areas of low solute concentration to areas of high solute concentration. Desklib provides a platform for students to access similar lab reports and study resources.
1 out of 11
Related Documents


Your All-in-One AI-Powered Toolkit for Academic Success.
+13062052269
info@desklib.com
Available 24*7 on WhatsApp / Email
![[object Object]](/_next/static/media/star-bottom.7253800d.svg)
Copyright © 2020–2026 A2Z Services. All Rights Reserved. Developed and managed by ZUCOL.