ESSC11002 Measurement and Evaluation in Health Science
Added on 2020-03-16
12 Pages1990 Words57 Views
Data analysis 1Student Name:Student number:Lecturer:

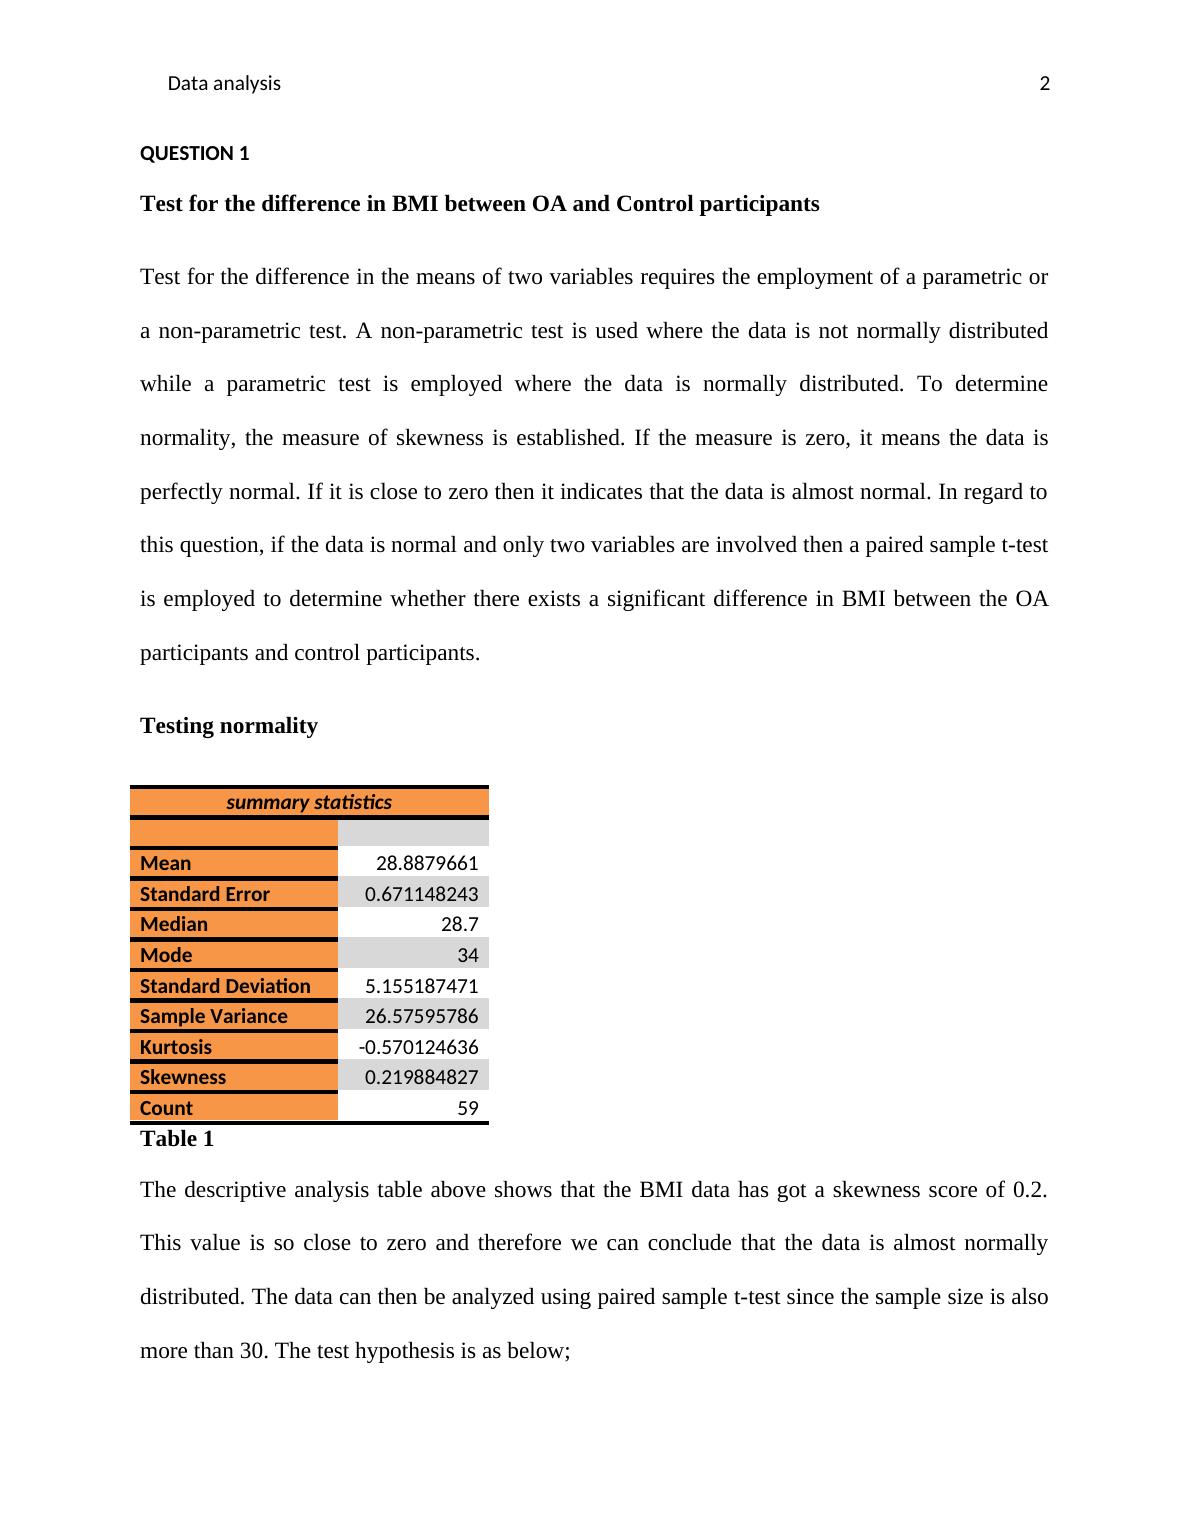
Data analysis 2QUESTION 1Test for the difference in BMI between OA and Control participantsTest for the difference in the means of two variables requires the employment of a parametric ora non-parametric test. A non-parametric test is used where the data is not normally distributedwhile a parametric test is employed where the data is normally distributed. To determinenormality, the measure of skewness is established. If the measure is zero, it means the data isperfectly normal. If it is close to zero then it indicates that the data is almost normal. In regard tothis question, if the data is normal and only two variables are involved then a paired sample t-testis employed to determine whether there exists a significant difference in BMI between the OAparticipants and control participants.Testing normality summary statisticsMean28.8879661Standard Error0.671148243Median28.7Mode34Standard Deviation5.155187471Sample Variance26.57595786Kurtosis-0.570124636Skewness0.219884827Count59Table 1The descriptive analysis table above shows that the BMI data has got a skewness score of 0.2.This value is so close to zero and therefore we can conclude that the data is almost normallydistributed. The data can then be analyzed using paired sample t-test since the sample size is alsomore than 30. The test hypothesis is as below;
Data analysis 3HypothesisNull hypothesis: There is no significant difference in mean BMI between OA and ControlparticipantsAlternative hypothesis: There is a significant difference in mean BMI between OA and ControlparticipantsThe results are below; t-Test: Paired Two Sample for MeanscontrolOAMean28.25862129.61Variance24.51179829.33019Observations2929Pearson Correlation0.1128918Hypothesized Mean Difference0df28t Stat-1.052729P(T<=t) one-tail0.1507329t Critical one-tail1.7011309P(T<=t) two-tail0.3014657t Critical two-tail2.0484071Table 2For us to make a decision, then the p-value computed must be compared to the level ofsignificance in this test which is 0.05. If the p-value is less than the level of significance, then thenull hypothesis is not accepted. The converse also applies. From the test results above, it can be
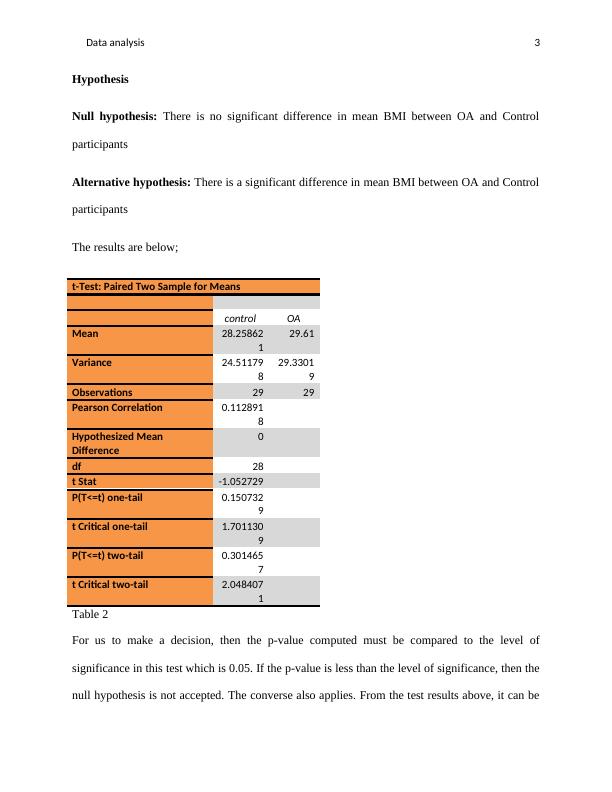
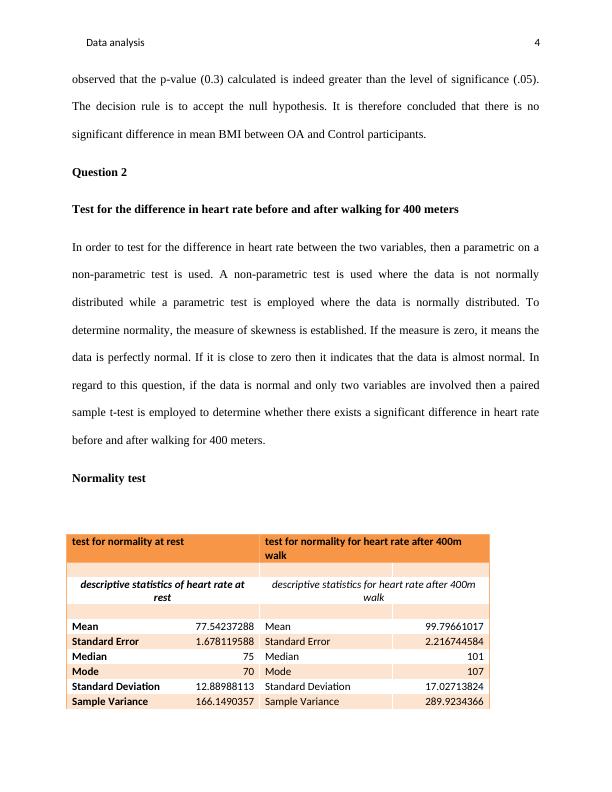
Data analysis 4observed that the p-value (0.3) calculated is indeed greater than the level of significance (.05).The decision rule is to accept the null hypothesis. It is therefore concluded that there is nosignificant difference in mean BMI between OA and Control participants.Question 2Test for the difference in heart rate before and after walking for 400 metersIn order to test for the difference in heart rate between the two variables, then a parametric on anon-parametric test is used. A non-parametric test is used where the data is not normallydistributed while a parametric test is employed where the data is normally distributed. Todetermine normality, the measure of skewness is established. If the measure is zero, it means thedata is perfectly normal. If it is close to zero then it indicates that the data is almost normal. Inregard to this question, if the data is normal and only two variables are involved then a pairedsample t-test is employed to determine whether there exists a significant difference in heart ratebefore and after walking for 400 meters.Normality testtest for normality at resttest for normality for heart rate after 400m walkdescriptive statistics of heart rate atrestdescriptive statistics for heart rate after 400mwalkMean77.54237288Mean99.79661017Standard Error1.678119588Standard Error2.216744584Median75Median101Mode70Mode107Standard Deviation12.88988113Standard Deviation17.02713824Sample Variance166.1490357Sample Variance289.9234366
End of preview
Want to access all the pages? Upload your documents or become a member.
Related Documents
Data analysis 11 Student Name: QUESTION 1 Normal distribution or normal distribution?lg...
|11
|1866
|215
Project#1. Problem Statement. Marks of students in multlg...
|6
|437
|95
Statistics: Test for Difference in Blood Pressure, Time to Complete Exam, Reading Ability, and Cancer Gradeslg...
|13
|2418
|58
The acupuncture group in populationlg...
|10
|1341
|41
Introduction to Biostatisticslg...
|8
|1469
|98
Hypothesis Testing and Confidence Intervals for Grandparent Carers in Parramattalg...
|11
|1459
|221