Analysis on Univariate 2022
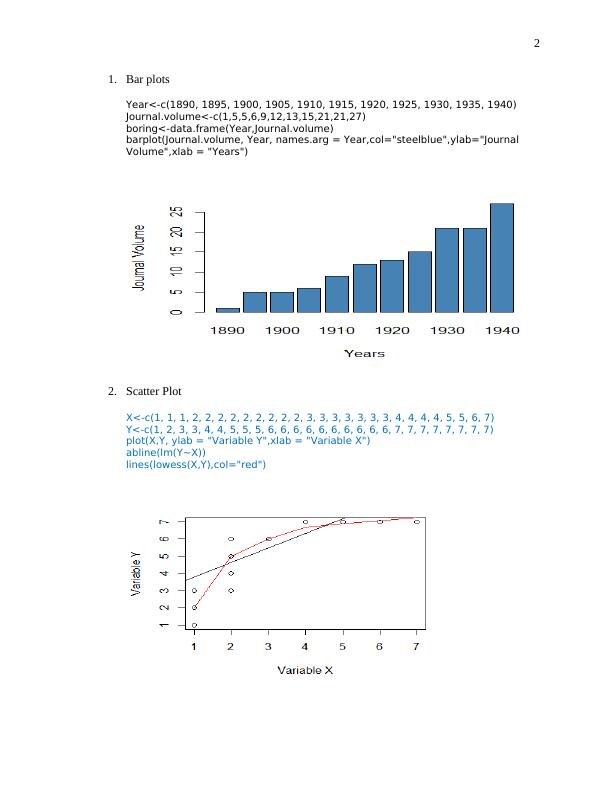
Create a barplot of psychology journal volumes and a scatterplot of two datasets using R.
8 Pages2049 Words14 Views
Added on 2022-10-08
Analysis on Univariate 2022
Create a barplot of psychology journal volumes and a scatterplot of two datasets using R.
Added on 2022-10-08
ShareRelated Documents
End of preview
Want to access all the pages? Upload your documents or become a member.
Numeracy and Data Analysis
|11
|1411
|37
Business Data Analysis
|9
|1076
|43
Assignment (Doc) | Mathematics 2022
|6
|827
|45
Loading Required Package Assignment
|20
|3180
|36
Applied Business Research: Data Analysis, Descriptive Statistics, and Correlation Matrix
|21
|3914
|42
Business Decision Making using Statistical Tools
|11
|1928
|2