NIT6130 - Experiment Design and Result Analysis Report Semester 2 2016
VerifiedAdded on 2023/06/11
|24
|5115
|248
Report
AI Summary
This report provides a comprehensive analysis of experiment design and result analysis, focusing on data collection, preprocessing, feature selection, and implementation. It begins with identifying data sources and collecting relevant data, followed by data preprocessing techniques such as cleaning, integration, transformation, and reduction. The report then details the design and implementation of experiments, including feature selection, dimension reduction, and the design steps involved. Results are analyzed, estimated, and summarized to address the research problems outlined in the introduction. The document includes tables and figures to illustrate the processes and outcomes, offering a clear and structured overview of the experimental methodology and findings.

EXPERIMENT AND RESULT ANALYSIS 1
by (Name)
The Name of the Course
Professor
The Name of the School
The City and State where it is located
The Date
by (Name)
The Name of the Course
Professor
The Name of the School
The City and State where it is located
The Date
Paraphrase This Document
Need a fresh take? Get an instant paraphrase of this document with our AI Paraphraser
EXPERIMENT AND RESULT ANALYSIS 2
TABLE OF CONTENTS
List of Tables.......................................................................................................................4
List of Figures......................................................................................................................4
1. Experiment and Result Analysis................................................................................5
1.1. Data collection....................................................................................................5
1.1.1. Data sources....................................................................................................5
1.1.2. Actual collection of data.................................................................................5
Table 1- Data Collection......................................................................................................5
1.1.3. Storage of data................................................................................................6
Table 2 - Data Storage.........................................................................................................7
1.2. Design and Implementation of Experiments......................................................7
1.2.1. Data pre-processing.........................................................................................7
Figure 1- Data Cleaning.......................................................................................................8
Figure 2 - Data Integration..................................................................................................9
Figure 3 - Data Transformation...........................................................................................9
Figure 4 - Data Reduction..................................................................................................10
1.2.2. Feature selection and dimension reduction...................................................10
EXPERIMENT AND RESULT ANALYSIS 3
Table 3- Feature Selection and Dimension Reduction......................................................10
1.2.3. Experiments Design......................................................................................11
Table 4 - Experiment Design.............................................................................................12
Figure 5 - Data Collection and Analysis............................................................................13
Table 5 - Demographic Information..................................................................................13
Table 6 - Survey Question.................................................................................................14
1.2.4. Implementation.................................................................................................14
Table 7 - Demographic Records and the Total Number of Participants............................14
...........................................................................................................................................15
Figure 9 - The Lifestyle of the Respondent.......................................................................16
Figure 10 - Occupation......................................................................................................16
Table 8 - Experiment Results............................................................................................17
Figure 11 - Responses to Every Question, Expressed as a Percentage.............................18
Figure 12 - The Response Expressed as a Percentage of the Total Responses.................19
1.3. Result analysis..................................................................................................19
1.3.1. Results estimation.........................................................................................19
1.3.2. Results summary...........................................................................................20
1.4. Outline of the experiments and Results Analysis....................................................21
References..........................................................................................................................22
⊘ This is a preview!⊘
Do you want full access?
Subscribe today to unlock all pages.
Trusted by 1+ million students worldwide
EXPERIMENT AND RESULT ANALYSIS 4
List of Tables.
Table 1- Data Collection......................................................................................................5
Table 2 - Data Storage.........................................................................................................6
Table 3- Feature Selection and Dimension Reduction......................................................10
Table 4 - Experiment Design.............................................................................................11
Table 5 - Demographic Information..................................................................................13
Table 6 - Survey Question.................................................................................................14
Table 7 - Demographic Records and the Total Number of Participants............................14
Table 8 - Experiment Results............................................................................................17
List of Figures.
Figure 1- Data Cleaning.......................................................................................................8
Figure 2 - Data Integration..................................................................................................8
Figure 3 - Data Transformation...........................................................................................9
Figure 4 - Data Reduction..................................................................................................10
Figure 5 - Data Collection and Analysis............................................................................13
Figure 6 - Level of Education............................................................................................15
Figure 7 - Gender...............................................................................................................15
Figure 8 - Age Range.........................................................................................................15
Figure 9 - The Lifestyle of the Respondent.......................................................................16
Figure 10 - Occupation......................................................................................................16
Figure 11 - Responses to Every Question, Expressed as a Percentage.............................18
Paraphrase This Document
Need a fresh take? Get an instant paraphrase of this document with our AI Paraphraser
EXPERIMENT AND RESULT ANALYSIS 5
Figure 12 - The Response Expressed as a Percentage of the Total Responses.................19
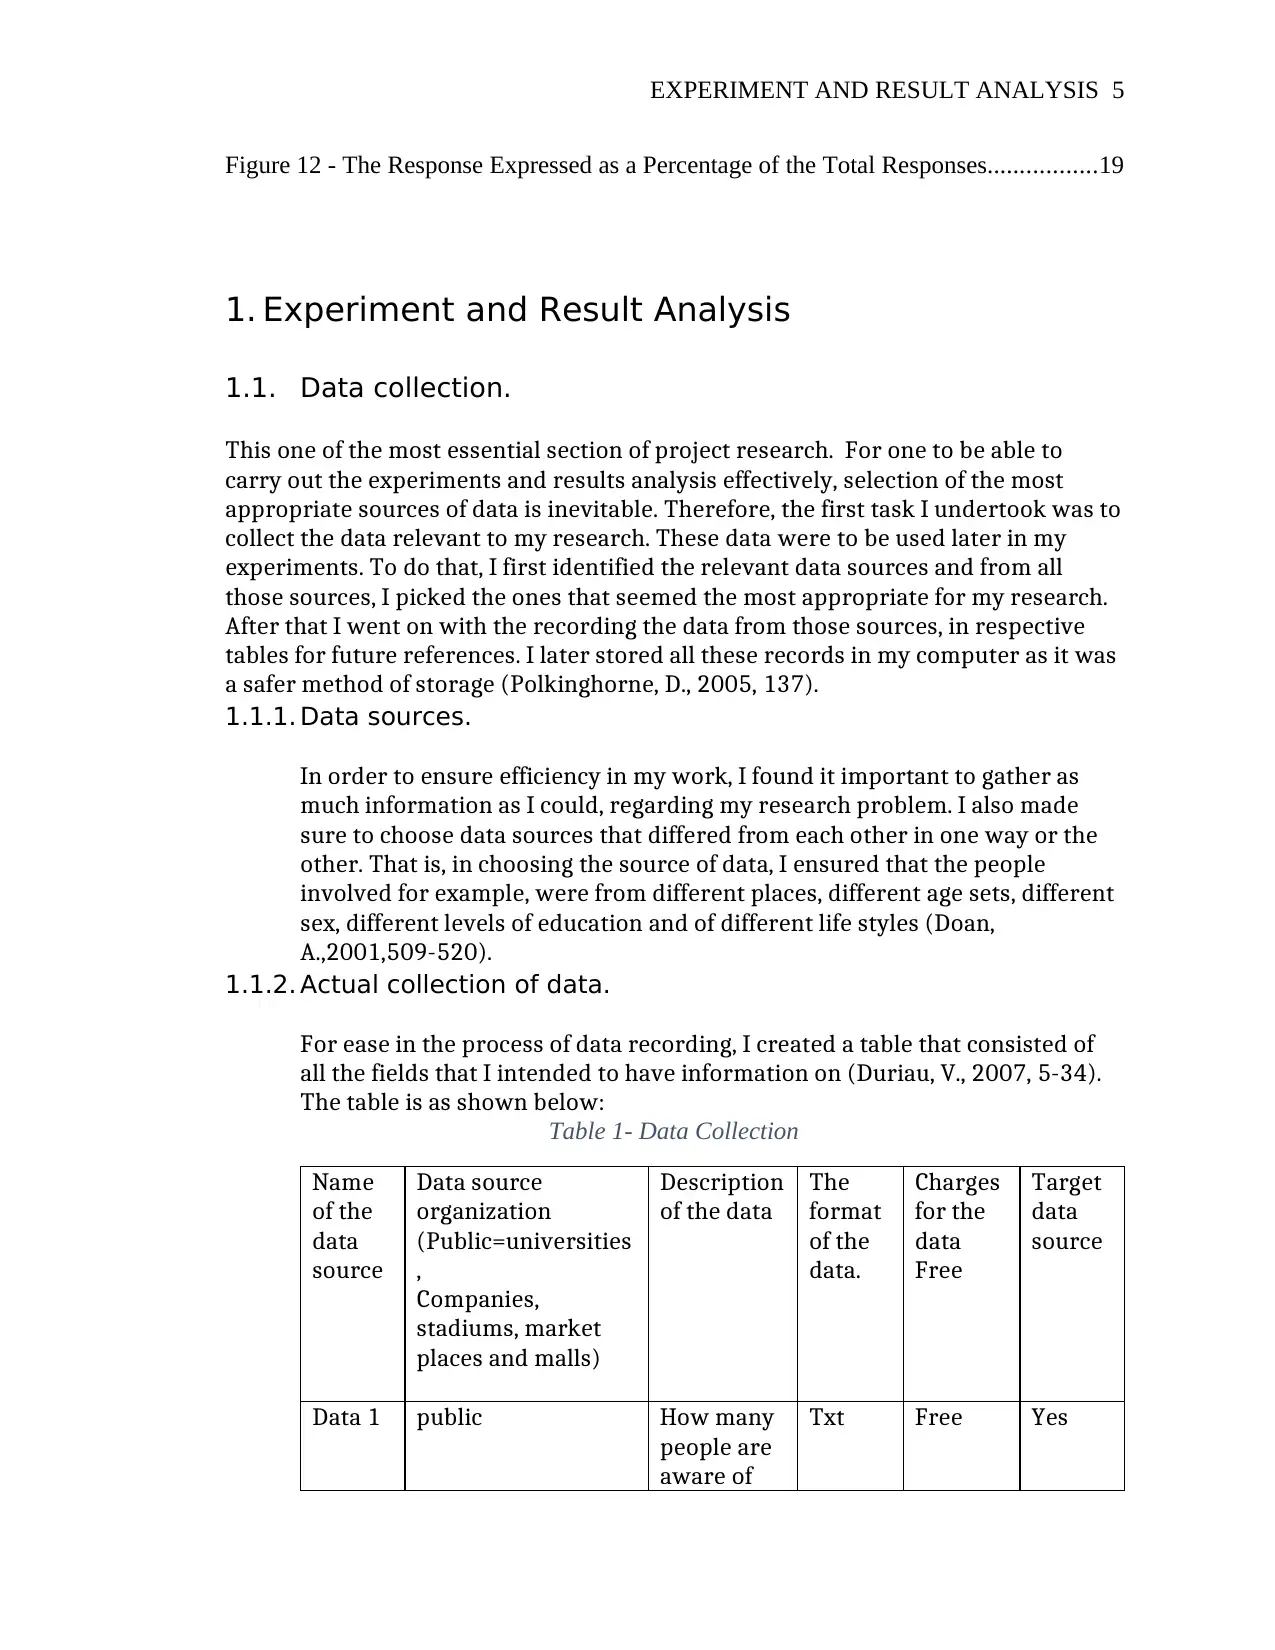
1. Experiment and Result Analysis
1.1. Data collection.
This one of the most essential section of project research. For one to be able to
carry out the experiments and results analysis effectively, selection of the most
appropriate sources of data is inevitable. Therefore, the first task I undertook was to
collect the data relevant to my research. These data were to be used later in my
experiments. To do that, I first identified the relevant data sources and from all
those sources, I picked the ones that seemed the most appropriate for my research.
After that I went on with the recording the data from those sources, in respective
tables for future references. I later stored all these records in my computer as it was
a safer method of storage (Polkinghorne, D., 2005, 137).
1.1.1. Data sources.
In order to ensure efficiency in my work, I found it important to gather as
much information as I could, regarding my research problem. I also made
sure to choose data sources that differed from each other in one way or the
other. That is, in choosing the source of data, I ensured that the people
involved for example, were from different places, different age sets, different
sex, different levels of education and of different life styles (Doan,
A.,2001,509-520).
1.1.2. Actual collection of data.
For ease in the process of data recording, I created a table that consisted of
all the fields that I intended to have information on (Duriau, V., 2007, 5-34).
The table is as shown below:
Table 1- Data Collection
Name
of the
data
source
Data source
organization
(Public=universities
,
Companies,
stadiums, market
places and malls)
Description
of the data
The
format
of the
data.
Charges
for the
data
Free
Target
data
source
Data 1 public How many
people are
aware of
Txt Free Yes
Figure 12 - The Response Expressed as a Percentage of the Total Responses.................19
1. Experiment and Result Analysis
1.1. Data collection.
This one of the most essential section of project research. For one to be able to
carry out the experiments and results analysis effectively, selection of the most
appropriate sources of data is inevitable. Therefore, the first task I undertook was to
collect the data relevant to my research. These data were to be used later in my
experiments. To do that, I first identified the relevant data sources and from all
those sources, I picked the ones that seemed the most appropriate for my research.
After that I went on with the recording the data from those sources, in respective
tables for future references. I later stored all these records in my computer as it was
a safer method of storage (Polkinghorne, D., 2005, 137).
1.1.1. Data sources.
In order to ensure efficiency in my work, I found it important to gather as
much information as I could, regarding my research problem. I also made
sure to choose data sources that differed from each other in one way or the
other. That is, in choosing the source of data, I ensured that the people
involved for example, were from different places, different age sets, different
sex, different levels of education and of different life styles (Doan,
A.,2001,509-520).
1.1.2. Actual collection of data.
For ease in the process of data recording, I created a table that consisted of
all the fields that I intended to have information on (Duriau, V., 2007, 5-34).
The table is as shown below:
Table 1- Data Collection
Name
of the
data
source
Data source
organization
(Public=universities
,
Companies,
stadiums, market
places and malls)
Description
of the data
The
format
of the
data.
Charges
for the
data
Free
Target
data
source
Data 1 public How many
people are
aware of
Txt Free Yes
EXPERIMENT AND RESULT ANALYSIS 6
the
wireless
home
security
systems?
Data 2 public How many
people
have
wireless
home
security
systems in
their
homes?
txt free yes
Data 3 public How many
people use
the
wireless
home
security
system
efficiently?
Txt Free Yes
Data 4 public How many
people like
this type of
home
security?
Txt Free Yes
Data 5 public How many
people
have a
feeling that
this type of
home
security is
sufficient
for them?
Txt Free Yes
Data 6 public How many
people can
afford this
type of
security?
Txt Free Yes
the
wireless
home
security
systems?
Data 2 public How many
people
have
wireless
home
security
systems in
their
homes?
txt free yes
Data 3 public How many
people use
the
wireless
home
security
system
efficiently?
Txt Free Yes
Data 4 public How many
people like
this type of
home
security?
Txt Free Yes
Data 5 public How many
people
have a
feeling that
this type of
home
security is
sufficient
for them?
Txt Free Yes
Data 6 public How many
people can
afford this
type of
security?
Txt Free Yes
⊘ This is a preview!⊘
Do you want full access?
Subscribe today to unlock all pages.
Trusted by 1+ million students worldwide
EXPERIMENT AND RESULT ANALYSIS 7
1.1.3. Storage of data.
In order to keep track of my research work, I recorded all relevant raw data
exactly as gotten from the sources, on a different table. I then saved these
raw data inform of text files in my computer on a specific location (//raw
data//), for later use I the experiments that I would later carry out (Bennett,
J.,2013, 8-19). The table below elaborate further.
Table 2 - Data Storage.
Data
Source
Name
Date
Collected
Location
of the
Saved
files
Name of
the Saved
File
Format of
the Saved
File
Number
of data
records
Data 1 10/06/2018 //raw
data//
Survey1.tx
t
.txt file 2000
Data 2 11/06/2018 //raw
data//
Survey2.tx
t
.txt file 1000
Data 3 12/06/2018 //raw
data//
Survey3.tx
t
.txt file 2000
Data 4 13/06/2018 //raw
data//
Survey4.tx
t
.txt file 500
Data 5 14/06/2018 //raw
data//
Survey5.tx
t
.txt file 600
Data 6 15/06/2018 //raw
data//
Survey6.tx
t
.txt file 3000
Data 7 16/06/2018 //raw
data//
Survey7.tx
t
.txt file 1000
1.2. Design and Implementation of Experiments.
In this phase, I divided the main activity smaller sub-tasks that were easy to handle
hence reducing the complexity of the task. These sub-tasks include data pre-
processing, dimension reduction, design and implementation processes (Paxton, P.,
2001,287-312).
1.2.1. Data pre-processing.
In most case, raw data is filled with noise factors, missing values and
inconsistency. Due to this fact, in most cases the pre-processing of the raw
data is found to be inevitable. This process is aimed at increasing the quality
and correctness of the data, which would therefore improve the quality and
the efficiency of the expected experimental results. This is one of the most
crucial steps in the preparation of data for the experimental activities in a
research. This process entails preparation and transformation of the initial
Paraphrase This Document
Need a fresh take? Get an instant paraphrase of this document with our AI Paraphraser
EXPERIMENT AND RESULT ANALYSIS 8
dataset. These data pre-processing methods are divided into various
categories. In my analysis, I used the various categories including, data
cleaning, integration of data, data transformation process and reduction of
the data (Kuhn, M.,2013,27-59).
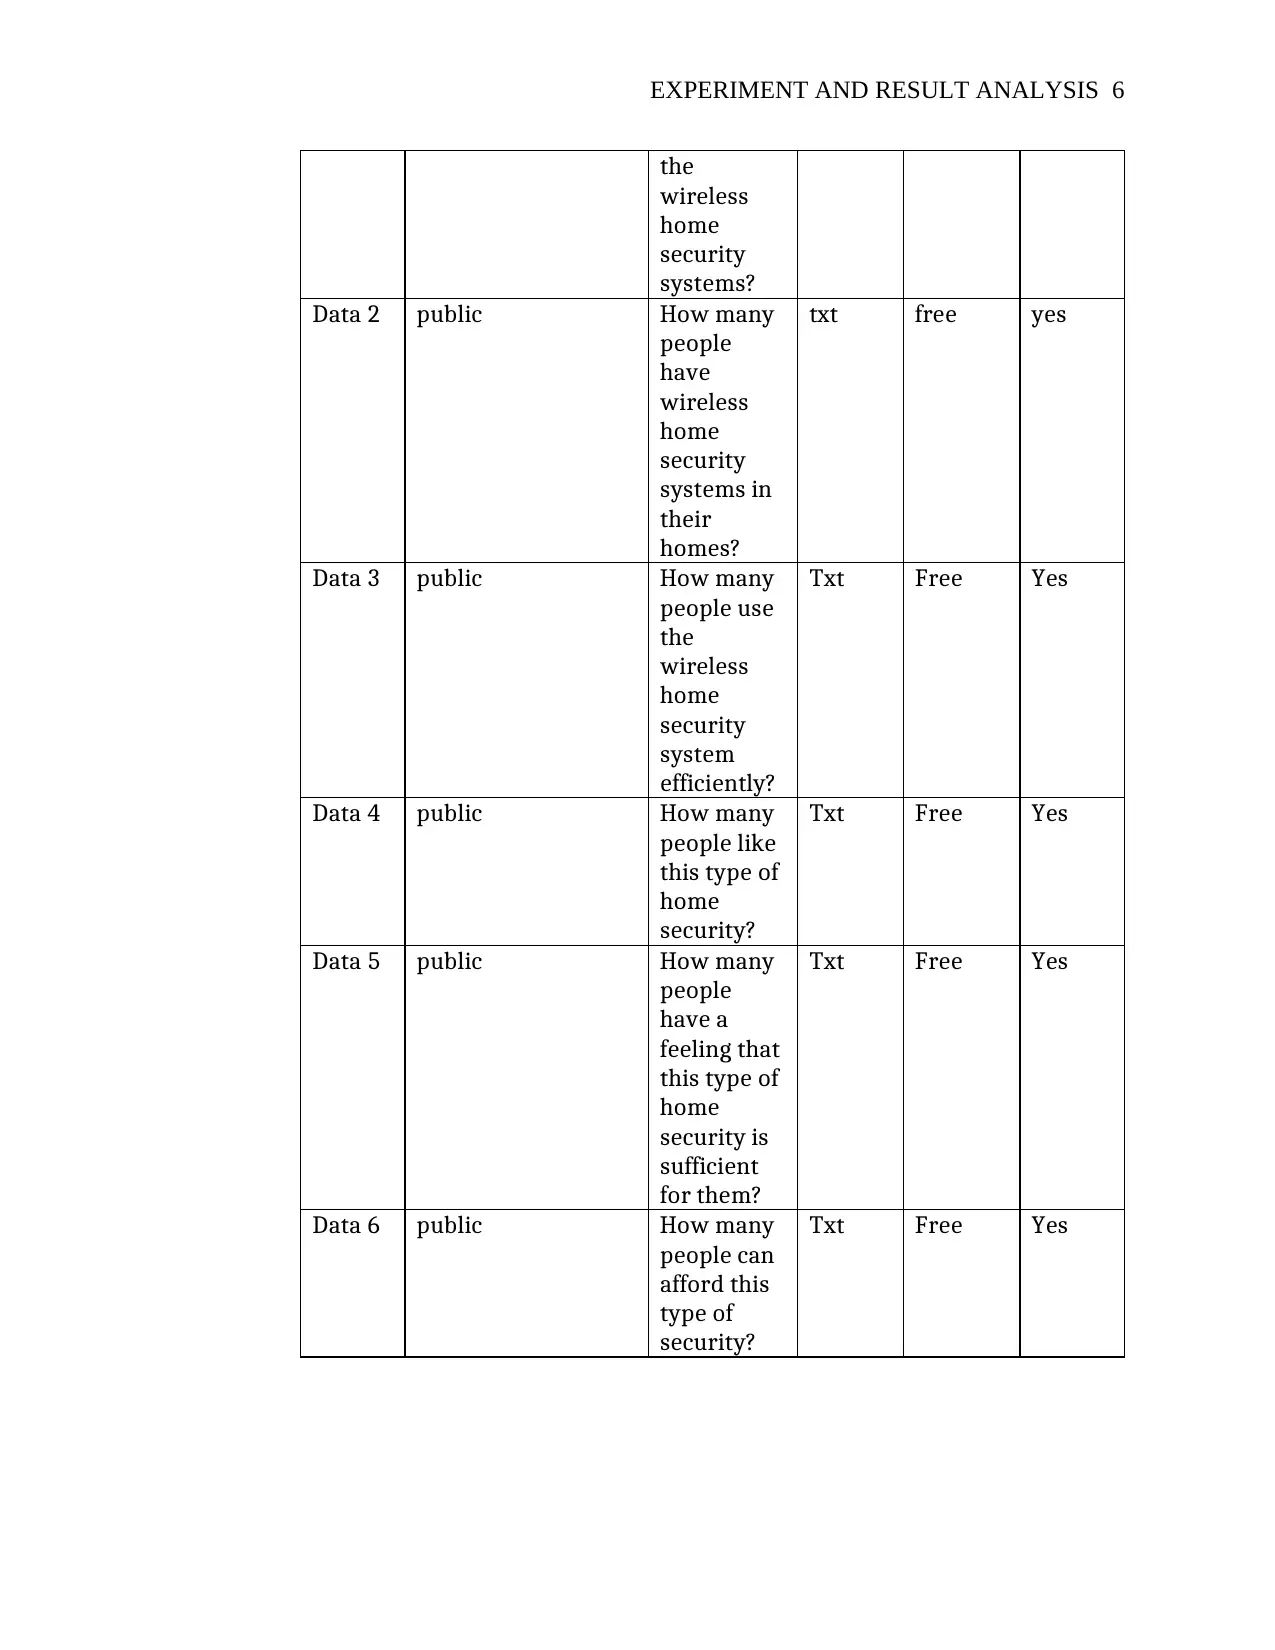
1.2.1.1. Data cleaning.
This process is essential in ensuring that the data awaiting to be analyzed
is complete –with no lacking values or certain attributes of interest,
error-free and consistent. I carried out this task to eradicate errors from
and ensuring that the data analyzed was complete and consistent hence
providing dependable results. It involved; ignoring the tuple in the raw
data, the process of filling in the missing values manually, filling the
missing values by use of global constant, use of the attributes’ mean in
filling the missing values, using attributes’ mean for all samples belonging
to the same categories and the use of the most probable value to fill in the
missing values in the data (Raman, V, 2001, 381-390). The figure below
elaborates further, the process of data cleaning:
Figure 1- Data Cleaning
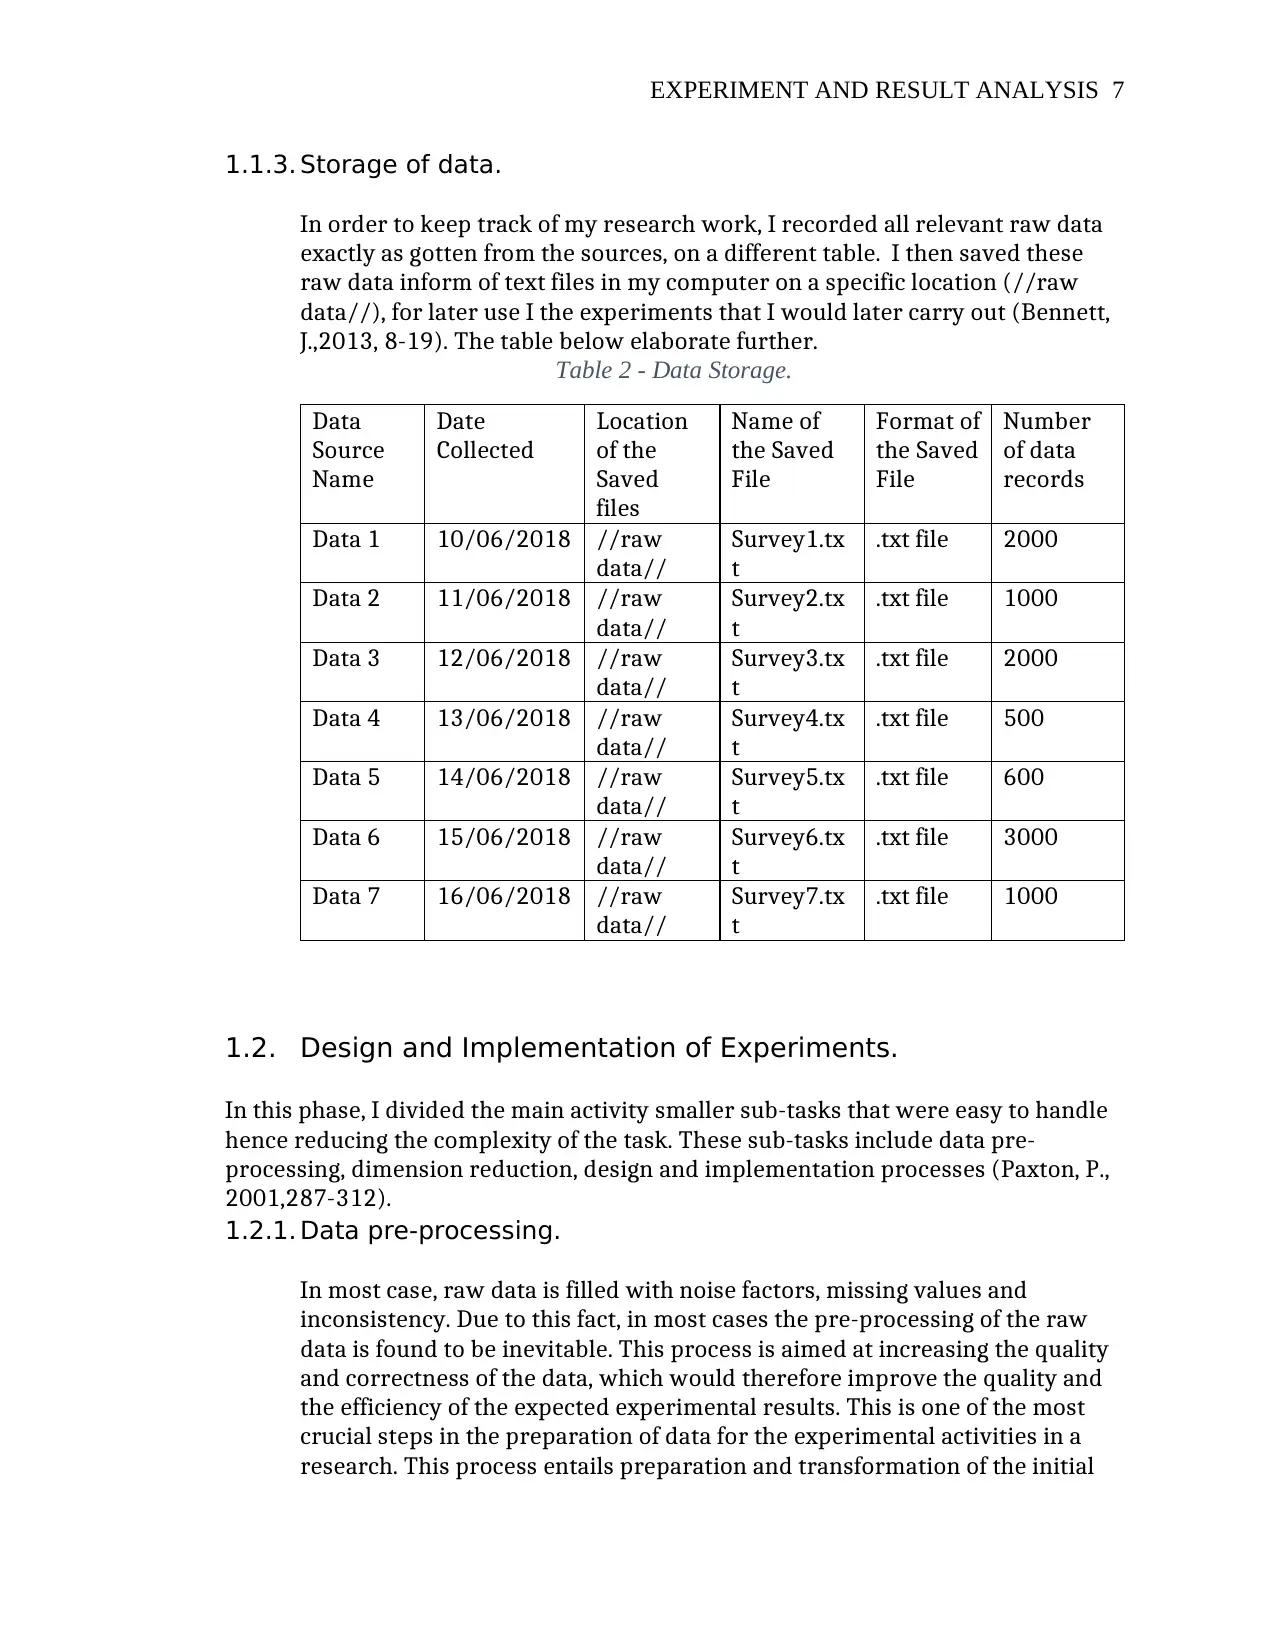
1.2.1.2. Data integration.
In this section, I combined all related data from different sources into a
one whole or rather into a coherent data and stored it in a specified file
location. Among other problems faced in conducting this task is the entity
identification problem. That is, it was a bit difficult to match-up the like
raw data entities from various data sources into one whole. However,
despite the problems, I managed to carry out the task efficiently
(Lenzerini, M, 2002, 233-246). The figure below elaborates further in a
lay mans’ language, the process of data integration:
dataset. These data pre-processing methods are divided into various
categories. In my analysis, I used the various categories including, data
cleaning, integration of data, data transformation process and reduction of
the data (Kuhn, M.,2013,27-59).
1.2.1.1. Data cleaning.
This process is essential in ensuring that the data awaiting to be analyzed
is complete –with no lacking values or certain attributes of interest,
error-free and consistent. I carried out this task to eradicate errors from
and ensuring that the data analyzed was complete and consistent hence
providing dependable results. It involved; ignoring the tuple in the raw
data, the process of filling in the missing values manually, filling the
missing values by use of global constant, use of the attributes’ mean in
filling the missing values, using attributes’ mean for all samples belonging
to the same categories and the use of the most probable value to fill in the
missing values in the data (Raman, V, 2001, 381-390). The figure below
elaborates further, the process of data cleaning:
Figure 1- Data Cleaning
1.2.1.2. Data integration.
In this section, I combined all related data from different sources into a
one whole or rather into a coherent data and stored it in a specified file
location. Among other problems faced in conducting this task is the entity
identification problem. That is, it was a bit difficult to match-up the like
raw data entities from various data sources into one whole. However,
despite the problems, I managed to carry out the task efficiently
(Lenzerini, M, 2002, 233-246). The figure below elaborates further in a
lay mans’ language, the process of data integration:
EXPERIMENT AND RESULT ANALYSIS 9
Figure 2 - Data Integration
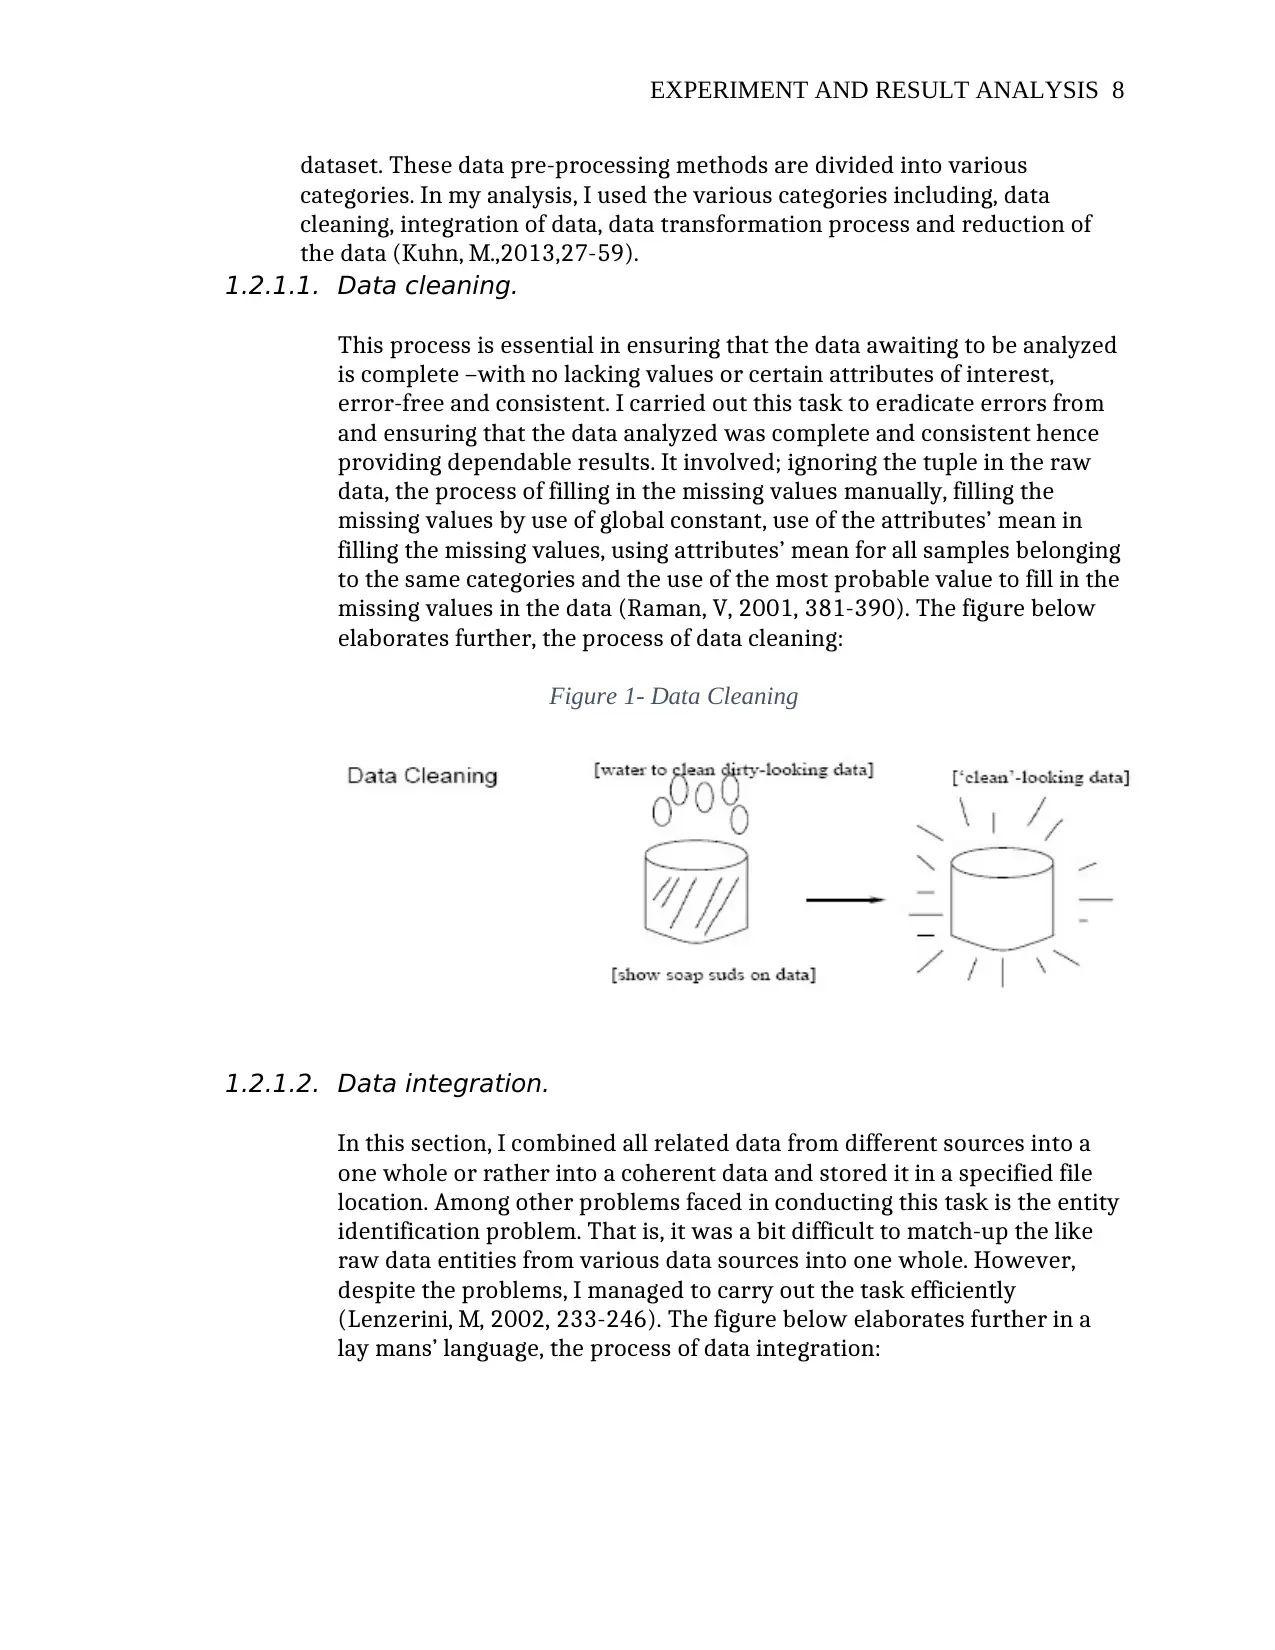
1.2.1.3. Data transformation.
This process involved the consolidation of data into more appropriate
forms which would make the “later” processes easy to undertake. The
various tasks that were associated with this process included; the
normalization of data – here the attribute data are topped in order for
them to fall under a small set range, say, -2.0 to 1.5, 0.0 to 2.0 or 2.0 to 3.0,
work smoothing to eradicate noise or error content and aggregation
process, generalization of the data – the primitive raw data are replaced
with the concepts that fall under some higher level categories (Osborne,
J,2002,10-15). This is further elaborated in the figure below:
Figure 3 - Data Transformation
1.2.1.4. Data reduction.
Analysis of very complex and huge amount of data may consume a very
long time. This is all because any one carrying out a data analysis process
would like the result they finally acquire to be dependable and efficient
and as expected. Therefore, I found it important to reduce the data by use
of the appropriate data reduction techniques so as to analyze the reduced
representation of dataset compromising the integrity of the original and
yet ensure the quality expected is met (Masse, L,2005, 44-55). In order to
ensure the above mentioned characteristics are met, I employed the
various data reduction strategies including;
Data cube aggregation – here the aggregation operations are used
in data cube construction.
Dimension reduction – this involved the removal of all the totally
irrelevant data, less relevant data and removal of unnecessarily
duplicated data.
Figure 2 - Data Integration
1.2.1.3. Data transformation.
This process involved the consolidation of data into more appropriate
forms which would make the “later” processes easy to undertake. The
various tasks that were associated with this process included; the
normalization of data – here the attribute data are topped in order for
them to fall under a small set range, say, -2.0 to 1.5, 0.0 to 2.0 or 2.0 to 3.0,
work smoothing to eradicate noise or error content and aggregation
process, generalization of the data – the primitive raw data are replaced
with the concepts that fall under some higher level categories (Osborne,
J,2002,10-15). This is further elaborated in the figure below:
Figure 3 - Data Transformation
1.2.1.4. Data reduction.
Analysis of very complex and huge amount of data may consume a very
long time. This is all because any one carrying out a data analysis process
would like the result they finally acquire to be dependable and efficient
and as expected. Therefore, I found it important to reduce the data by use
of the appropriate data reduction techniques so as to analyze the reduced
representation of dataset compromising the integrity of the original and
yet ensure the quality expected is met (Masse, L,2005, 44-55). In order to
ensure the above mentioned characteristics are met, I employed the
various data reduction strategies including;
Data cube aggregation – here the aggregation operations are used
in data cube construction.
Dimension reduction – this involved the removal of all the totally
irrelevant data, less relevant data and removal of unnecessarily
duplicated data.
⊘ This is a preview!⊘
Do you want full access?
Subscribe today to unlock all pages.
Trusted by 1+ million students worldwide
EXPERIMENT AND RESULT ANALYSIS
10
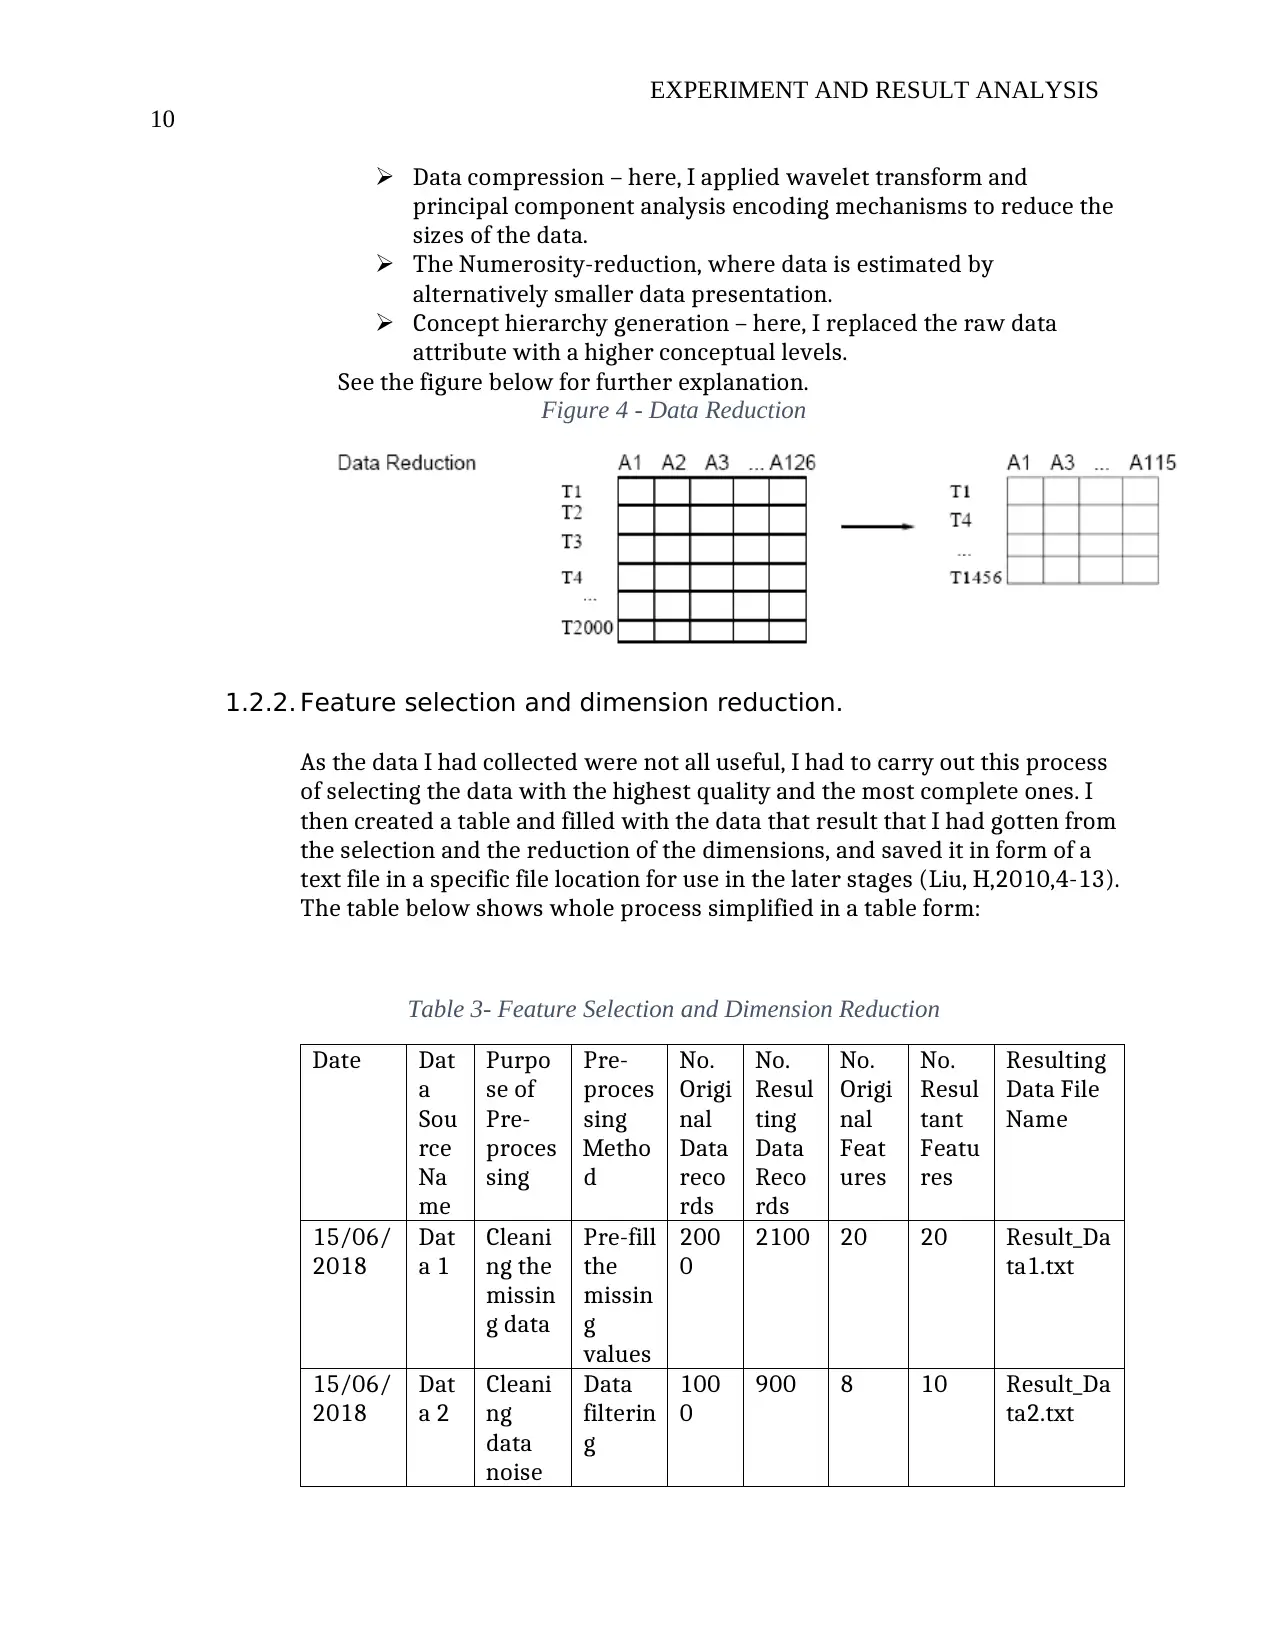
Data compression – here, I applied wavelet transform and
principal component analysis encoding mechanisms to reduce the
sizes of the data.
The Numerosity-reduction, where data is estimated by
alternatively smaller data presentation.
Concept hierarchy generation – here, I replaced the raw data
attribute with a higher conceptual levels.
See the figure below for further explanation.
Figure 4 - Data Reduction
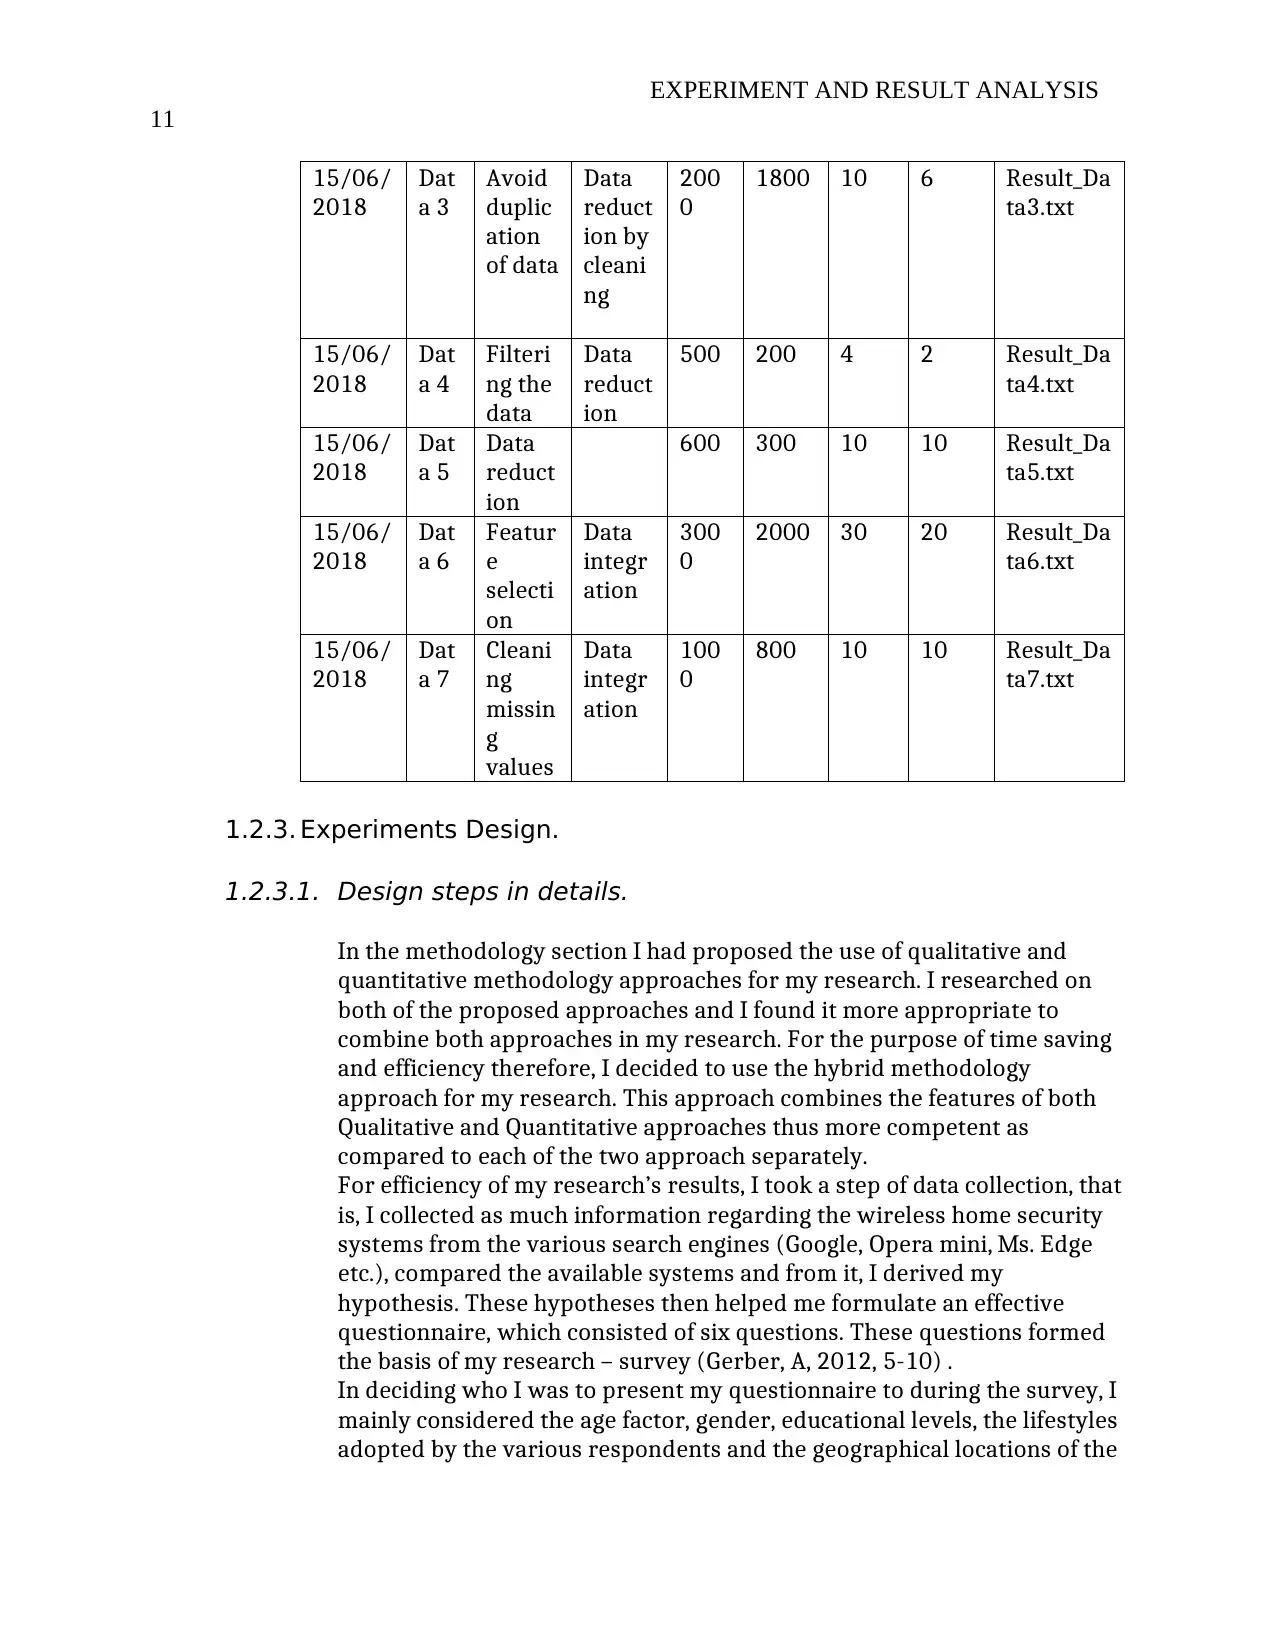
1.2.2. Feature selection and dimension reduction.
As the data I had collected were not all useful, I had to carry out this process
of selecting the data with the highest quality and the most complete ones. I
then created a table and filled with the data that result that I had gotten from
the selection and the reduction of the dimensions, and saved it in form of a
text file in a specific file location for use in the later stages (Liu, H,2010,4-13).
The table below shows whole process simplified in a table form:
Table 3- Feature Selection and Dimension Reduction
Date Dat
a
Sou
rce
Na
me
Purpo
se of
Pre-
proces
sing
Pre-
proces
sing
Metho
d
No.
Origi
nal
Data
reco
rds
No.
Resul
ting
Data
Reco
rds
No.
Origi
nal
Feat
ures
No.
Resul
tant
Featu
res
Resulting
Data File
Name
15/06/
2018
Dat
a 1
Cleani
ng the
missin
g data
Pre-fill
the
missin
g
values
200
0
2100 20 20 Result_Da
ta1.txt
15/06/
2018
Dat
a 2
Cleani
ng
data
noise
Data
filterin
g
100
0
900 8 10 Result_Da
ta2.txt
10
Data compression – here, I applied wavelet transform and
principal component analysis encoding mechanisms to reduce the
sizes of the data.
The Numerosity-reduction, where data is estimated by
alternatively smaller data presentation.
Concept hierarchy generation – here, I replaced the raw data
attribute with a higher conceptual levels.
See the figure below for further explanation.
Figure 4 - Data Reduction
1.2.2. Feature selection and dimension reduction.
As the data I had collected were not all useful, I had to carry out this process
of selecting the data with the highest quality and the most complete ones. I
then created a table and filled with the data that result that I had gotten from
the selection and the reduction of the dimensions, and saved it in form of a
text file in a specific file location for use in the later stages (Liu, H,2010,4-13).
The table below shows whole process simplified in a table form:
Table 3- Feature Selection and Dimension Reduction
Date Dat
a
Sou
rce
Na
me
Purpo
se of
Pre-
proces
sing
Pre-
proces
sing
Metho
d
No.
Origi
nal
Data
reco
rds
No.
Resul
ting
Data
Reco
rds
No.
Origi
nal
Feat
ures
No.
Resul
tant
Featu
res
Resulting
Data File
Name
15/06/
2018
Dat
a 1
Cleani
ng the
missin
g data
Pre-fill
the
missin
g
values
200
0
2100 20 20 Result_Da
ta1.txt
15/06/
2018
Dat
a 2
Cleani
ng
data
noise
Data
filterin
g
100
0
900 8 10 Result_Da
ta2.txt
Paraphrase This Document
Need a fresh take? Get an instant paraphrase of this document with our AI Paraphraser
EXPERIMENT AND RESULT ANALYSIS
11
15/06/
2018
Dat
a 3
Avoid
duplic
ation
of data
Data
reduct
ion by
cleani
ng
200
0
1800 10 6 Result_Da
ta3.txt
15/06/
2018
Dat
a 4
Filteri
ng the
data
Data
reduct
ion
500 200 4 2 Result_Da
ta4.txt
15/06/
2018
Dat
a 5
Data
reduct
ion
600 300 10 10 Result_Da
ta5.txt
15/06/
2018
Dat
a 6
Featur
e
selecti
on
Data
integr
ation
300
0
2000 30 20 Result_Da
ta6.txt
15/06/
2018
Dat
a 7
Cleani
ng
missin
g
values
Data
integr
ation
100
0
800 10 10 Result_Da
ta7.txt
1.2.3. Experiments Design.
1.2.3.1. Design steps in details.
In the methodology section I had proposed the use of qualitative and
quantitative methodology approaches for my research. I researched on
both of the proposed approaches and I found it more appropriate to
combine both approaches in my research. For the purpose of time saving
and efficiency therefore, I decided to use the hybrid methodology
approach for my research. This approach combines the features of both
Qualitative and Quantitative approaches thus more competent as
compared to each of the two approach separately.
For efficiency of my research’s results, I took a step of data collection, that
is, I collected as much information regarding the wireless home security
systems from the various search engines (Google, Opera mini, Ms. Edge
etc.), compared the available systems and from it, I derived my
hypothesis. These hypotheses then helped me formulate an effective
questionnaire, which consisted of six questions. These questions formed
the basis of my research – survey (Gerber, A, 2012, 5-10) .
In deciding who I was to present my questionnaire to during the survey, I
mainly considered the age factor, gender, educational levels, the lifestyles
adopted by the various respondents and the geographical locations of the
11
15/06/
2018
Dat
a 3
Avoid
duplic
ation
of data
Data
reduct
ion by
cleani
ng
200
0
1800 10 6 Result_Da
ta3.txt
15/06/
2018
Dat
a 4
Filteri
ng the
data
Data
reduct
ion
500 200 4 2 Result_Da
ta4.txt
15/06/
2018
Dat
a 5
Data
reduct
ion
600 300 10 10 Result_Da
ta5.txt
15/06/
2018
Dat
a 6
Featur
e
selecti
on
Data
integr
ation
300
0
2000 30 20 Result_Da
ta6.txt
15/06/
2018
Dat
a 7
Cleani
ng
missin
g
values
Data
integr
ation
100
0
800 10 10 Result_Da
ta7.txt
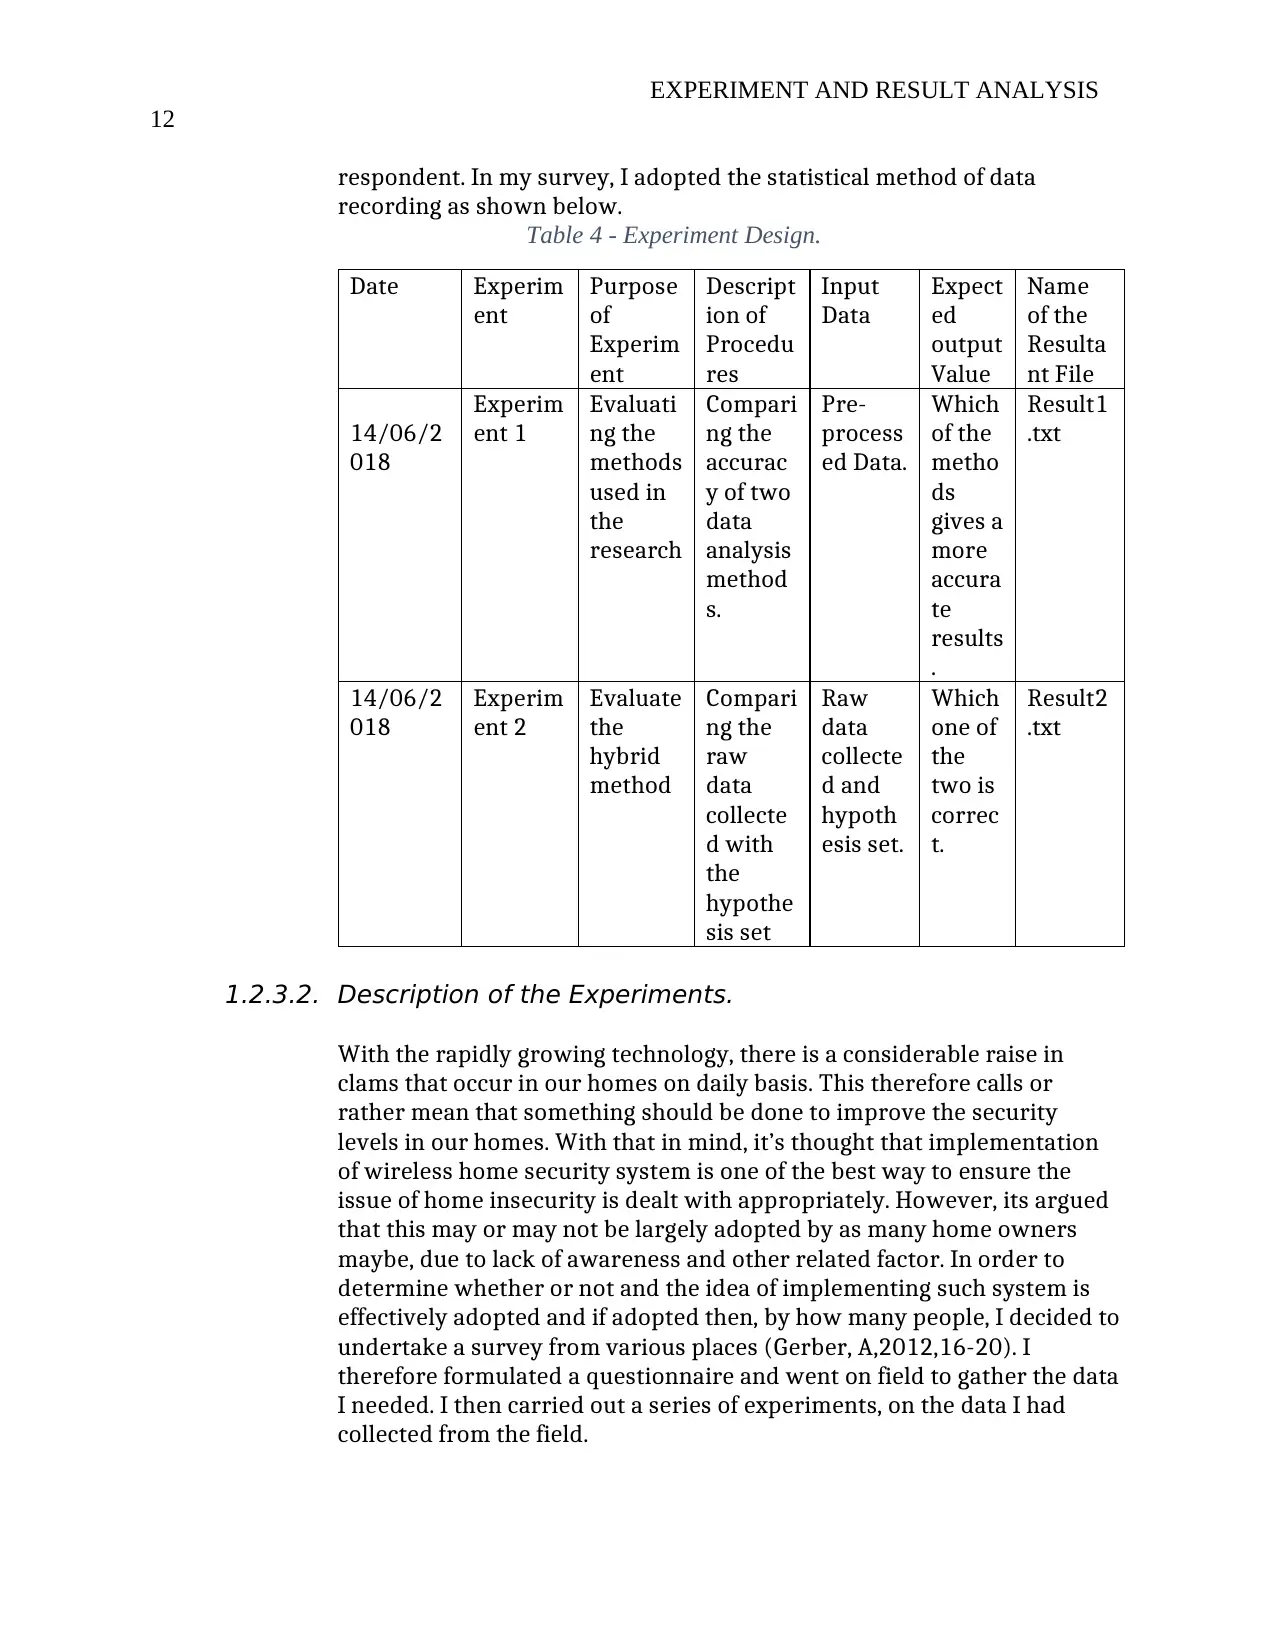
1.2.3. Experiments Design.
1.2.3.1. Design steps in details.
In the methodology section I had proposed the use of qualitative and
quantitative methodology approaches for my research. I researched on
both of the proposed approaches and I found it more appropriate to
combine both approaches in my research. For the purpose of time saving
and efficiency therefore, I decided to use the hybrid methodology
approach for my research. This approach combines the features of both
Qualitative and Quantitative approaches thus more competent as
compared to each of the two approach separately.
For efficiency of my research’s results, I took a step of data collection, that
is, I collected as much information regarding the wireless home security
systems from the various search engines (Google, Opera mini, Ms. Edge
etc.), compared the available systems and from it, I derived my
hypothesis. These hypotheses then helped me formulate an effective
questionnaire, which consisted of six questions. These questions formed
the basis of my research – survey (Gerber, A, 2012, 5-10) .
In deciding who I was to present my questionnaire to during the survey, I
mainly considered the age factor, gender, educational levels, the lifestyles
adopted by the various respondents and the geographical locations of the
EXPERIMENT AND RESULT ANALYSIS
12
respondent. In my survey, I adopted the statistical method of data
recording as shown below.
Table 4 - Experiment Design.
Date Experim
ent
Purpose
of
Experim
ent
Descript
ion of
Procedu
res
Input
Data
Expect
ed
output
Value
Name
of the
Resulta
nt File
14/06/2
018
Experim
ent 1
Evaluati
ng the
methods
used in
the
research
Compari
ng the
accurac
y of two
data
analysis
method
s.
Pre-
process
ed Data.
Which
of the
metho
ds
gives a
more
accura
te
results
.
Result1
.txt
14/06/2
018
Experim
ent 2
Evaluate
the
hybrid
method
Compari
ng the
raw
data
collecte
d with
the
hypothe
sis set
Raw
data
collecte
d and
hypoth
esis set.
Which
one of
the
two is
correc
t.
Result2
.txt
1.2.3.2. Description of the Experiments.
With the rapidly growing technology, there is a considerable raise in
clams that occur in our homes on daily basis. This therefore calls or
rather mean that something should be done to improve the security
levels in our homes. With that in mind, it’s thought that implementation
of wireless home security system is one of the best way to ensure the
issue of home insecurity is dealt with appropriately. However, its argued
that this may or may not be largely adopted by as many home owners
maybe, due to lack of awareness and other related factor. In order to
determine whether or not and the idea of implementing such system is
effectively adopted and if adopted then, by how many people, I decided to
undertake a survey from various places (Gerber, A,2012,16-20). I
therefore formulated a questionnaire and went on field to gather the data
I needed. I then carried out a series of experiments, on the data I had
collected from the field.
⊘ This is a preview!⊘
Do you want full access?
Subscribe today to unlock all pages.
Trusted by 1+ million students worldwide
1 out of 24
Related Documents


Your All-in-One AI-Powered Toolkit for Academic Success.
+13062052269
info@desklib.com
Available 24*7 on WhatsApp / Email
![[object Object]](/_next/static/media/star-bottom.7253800d.svg)
Unlock your academic potential
Copyright © 2020–2026 A2Z Services. All Rights Reserved. Developed and managed by ZUCOL.