Factors Affecting Students’ Final Grade
VerifiedAdded on 2023/04/08
|9
|1348
|154
AI Summary
This document investigates the factors that affect students' final grade in university. The study collected data on class attendance, age of the student, years spent in a mathematics class, and high school performance. The analysis reveals a significant relationship between class attendance, high school performance, and the final grade. The findings suggest that attending classes and having a good high school performance can positively impact the final grade.
Contribute Materials
Your contribution can guide someone’s learning journey. Share your
documents today.

Factors Affecting Students’ Final Grade
Title:
Assignment Name:
Student Name:
Course Name and Number:
Student ID:
Date:
Title:
Assignment Name:
Student Name:
Course Name and Number:
Student ID:
Date:
Secure Best Marks with AI Grader
Need help grading? Try our AI Grader for instant feedback on your assignments.
Factors Affecting Students’ Final Grade
Factors Affecting Students’ Final Grade in University
When students are admitted to the university they are brilliant about their future and most of
them if not all desire to excel in the field of academia by getting excellent grades before their
final year graduation. Usually, in university, the grade one is awarded is based on the aggregate
performance from the first year of study all through to their last year of study depending on the
programme one is taking in the university. It is surprising that despite the zeal on had before
being admitted to the university students perform differently in their final grade.
We formulated a problem in which we wanted to determine factors affecting students’ final
grade. We collected a population of 1002 individuals recorded their final grade along with other
factors which were; class attendance, the age of the student, years spent in a mathematics class
and the student's high school performance. We wanted to investigate whether the student final
grade was related to class attendance, the age of the student, years spent in a mathematics class
and the student's high school performance. From the population, we generated a random sample
of size 30 using simple random sampling. The sample was obtained with the use of random
numbers. The analysis of the sample population was done using the R package. (Solis et al,
2014).
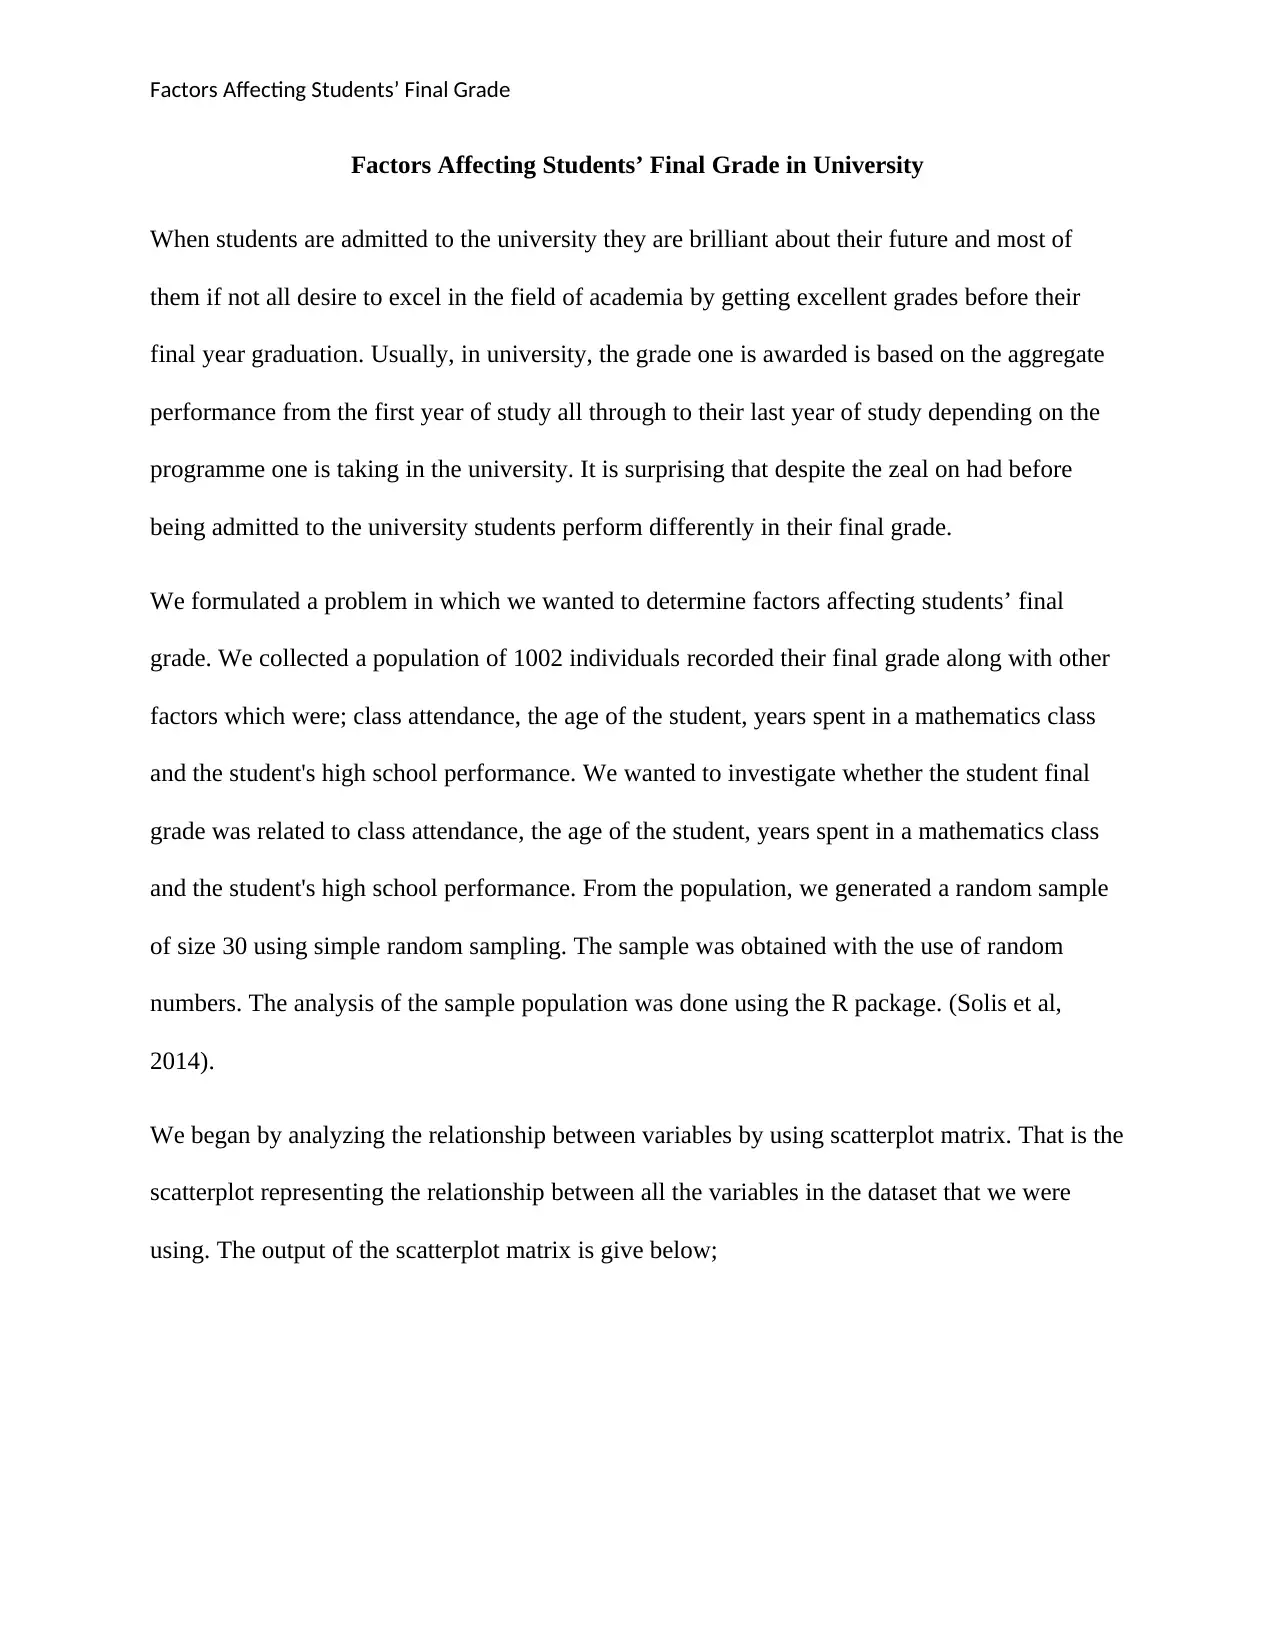
We began by analyzing the relationship between variables by using scatterplot matrix. That is the
scatterplot representing the relationship between all the variables in the dataset that we were
using. The output of the scatterplot matrix is give below;
Factors Affecting Students’ Final Grade in University
When students are admitted to the university they are brilliant about their future and most of
them if not all desire to excel in the field of academia by getting excellent grades before their
final year graduation. Usually, in university, the grade one is awarded is based on the aggregate
performance from the first year of study all through to their last year of study depending on the
programme one is taking in the university. It is surprising that despite the zeal on had before
being admitted to the university students perform differently in their final grade.
We formulated a problem in which we wanted to determine factors affecting students’ final
grade. We collected a population of 1002 individuals recorded their final grade along with other
factors which were; class attendance, the age of the student, years spent in a mathematics class
and the student's high school performance. We wanted to investigate whether the student final
grade was related to class attendance, the age of the student, years spent in a mathematics class
and the student's high school performance. From the population, we generated a random sample
of size 30 using simple random sampling. The sample was obtained with the use of random
numbers. The analysis of the sample population was done using the R package. (Solis et al,
2014).
We began by analyzing the relationship between variables by using scatterplot matrix. That is the
scatterplot representing the relationship between all the variables in the dataset that we were
using. The output of the scatterplot matrix is give below;
Factors Affecting Students’ Final Grade
From the scatterplot above its clear that all the variables are linearly independent. This was a
good indication that when using the linear regression model to fit the data most of the linear
regression assumptions will hold. We also revealed that the relationship between class
attendance was a negative linear relationship.
We then used a linear regression equation to examine the relationship between the dependent
variables and the explanatory variables which were of the form; Y=B0+ B1W+B2X+B3Y+B4Z.
Where Y represents the final grade, W attendance, X is the students OP, Y is the number of years
spent in math classes, and Z is the age of the students. The B0, B1, B2, B3, and B4 represents the
regression coefficients (Phillips and Moon, 2009). We used ordinary least squares method to
Factors Affecting Students’ Final Grade
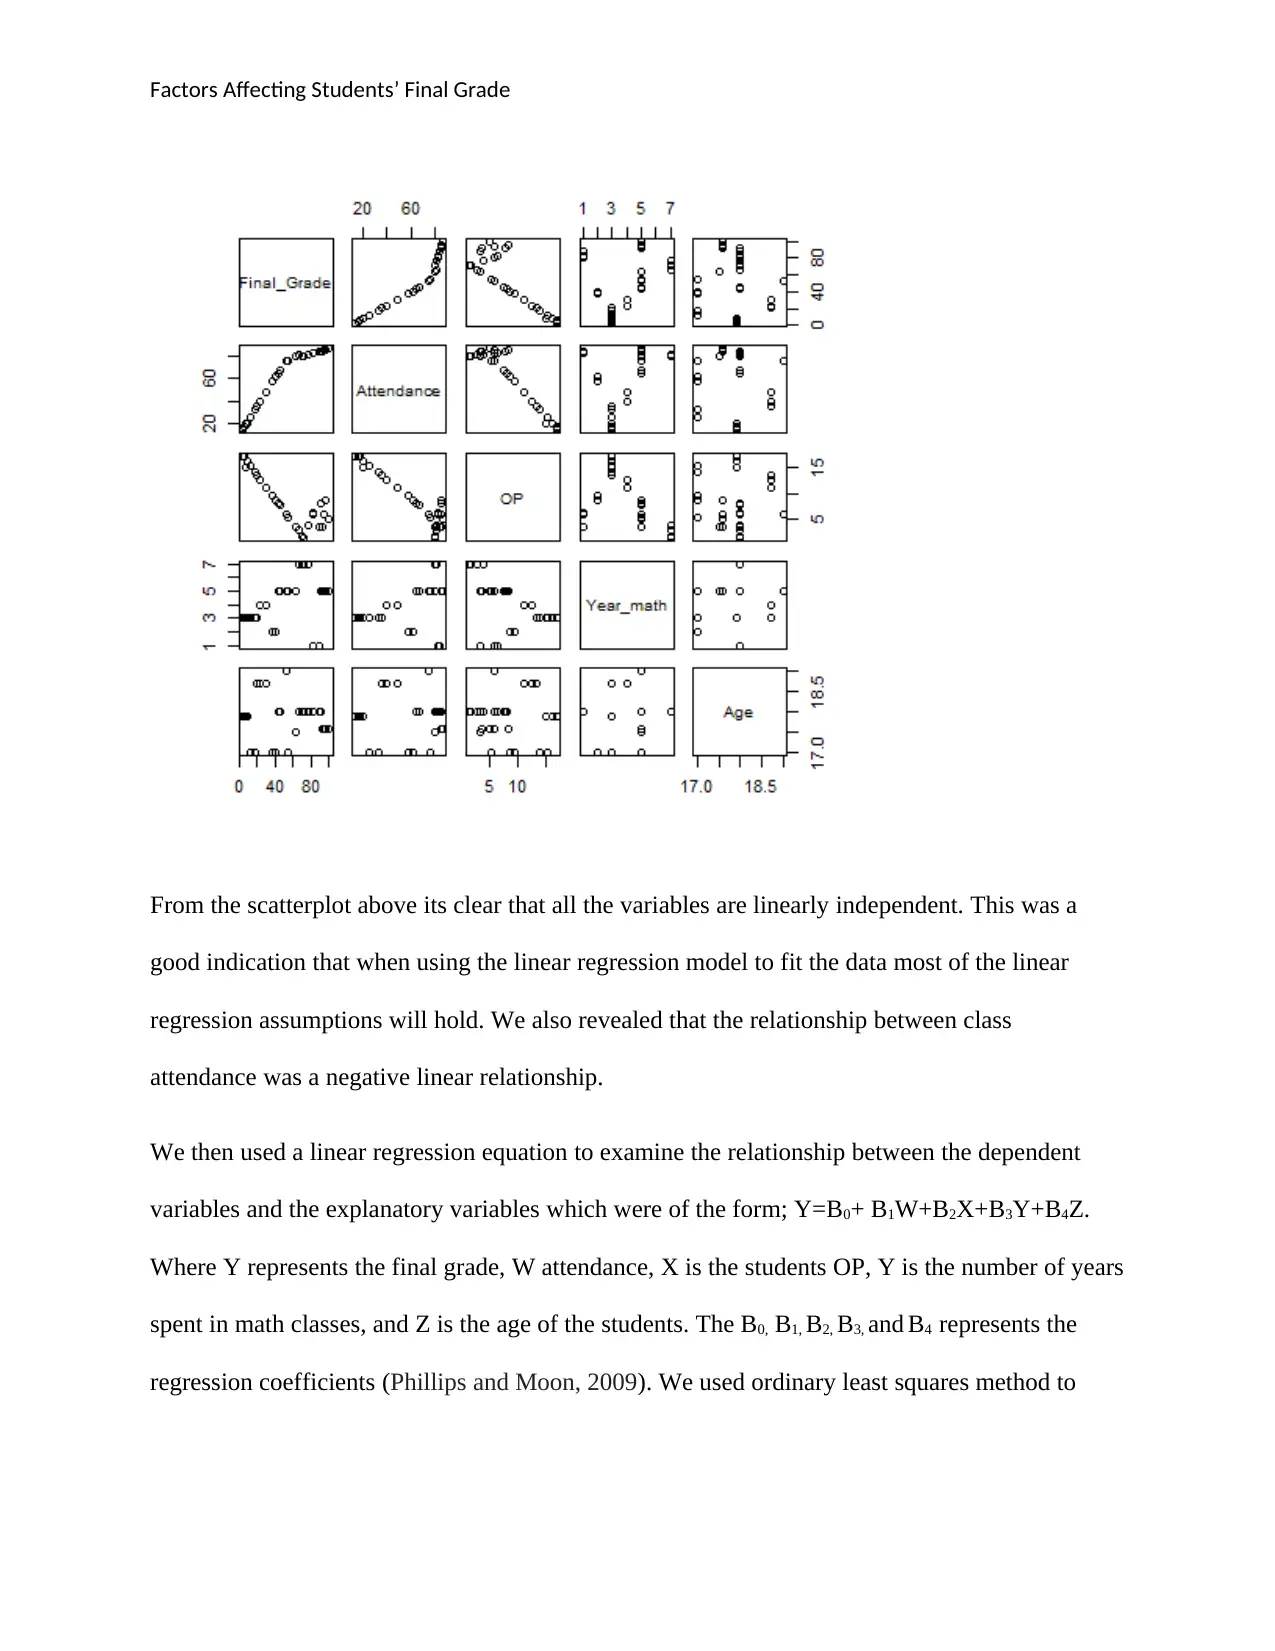
estimate the regression coefficients which were generated automatically in R. The output for the
model generated from the data was;
Where the intercept in the output represents the value of B0. We interpreted the model above as
the final grade increases by 1.66 units per unit increase in the students class attendance holding
all the other predictors fixed, The final grade increases by 2.69 units per unit increase in the
students high school OP holding the others predictors fixed, the final grade increased by 0.0827
units per unit change in the number of years spent studying the mathematics, and the final grade
increases decreases by 0.633 units per unit increase in the age of a student (Schielzeth, 2010).
We formulated the hypothesis below to investigate which of the four predictors were significant
in explaining the model;
H0: All explanatory variables are insignificant
against
H1: At least one of the explanatory variable is significant.
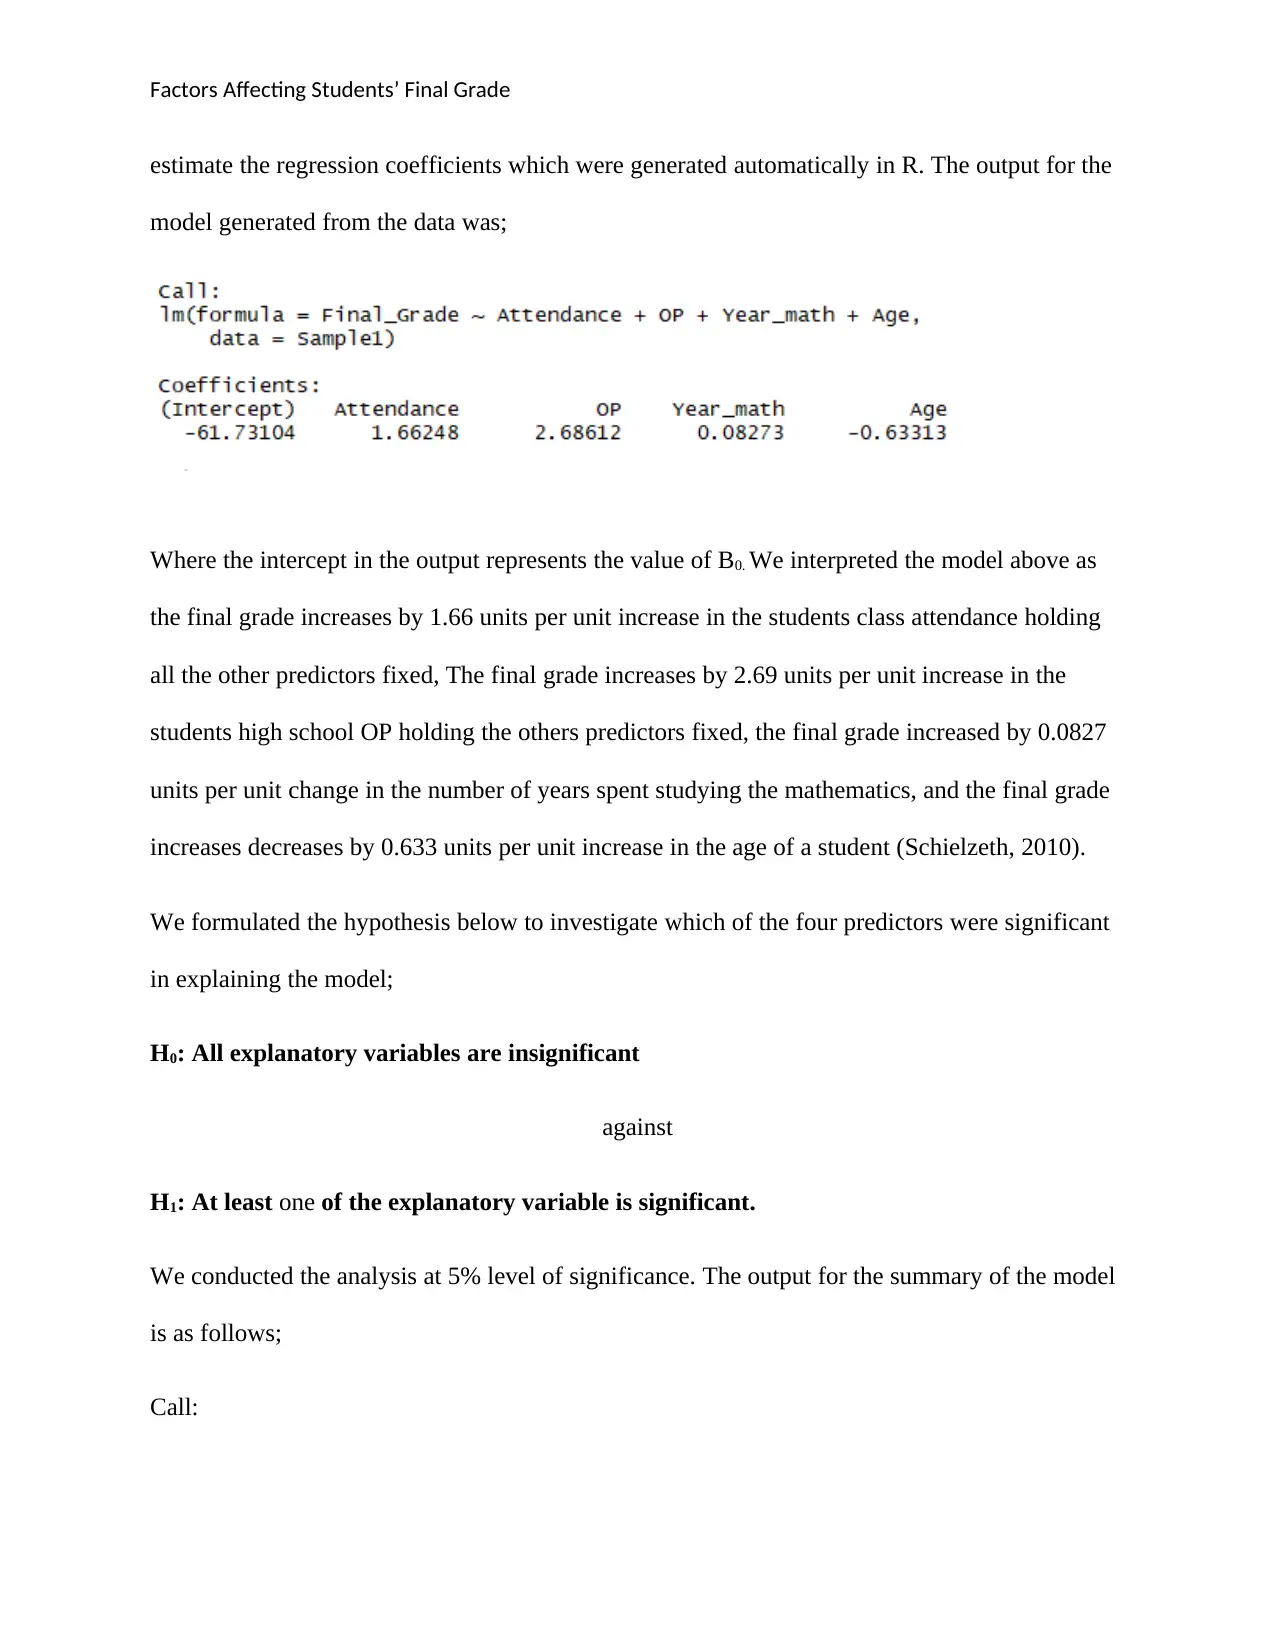
We conducted the analysis at 5% level of significance. The output for the summary of the model
is as follows;
Call:
estimate the regression coefficients which were generated automatically in R. The output for the
model generated from the data was;
Where the intercept in the output represents the value of B0. We interpreted the model above as
the final grade increases by 1.66 units per unit increase in the students class attendance holding
all the other predictors fixed, The final grade increases by 2.69 units per unit increase in the
students high school OP holding the others predictors fixed, the final grade increased by 0.0827
units per unit change in the number of years spent studying the mathematics, and the final grade
increases decreases by 0.633 units per unit increase in the age of a student (Schielzeth, 2010).
We formulated the hypothesis below to investigate which of the four predictors were significant
in explaining the model;
H0: All explanatory variables are insignificant
against
H1: At least one of the explanatory variable is significant.
We conducted the analysis at 5% level of significance. The output for the summary of the model
is as follows;
Call:
Secure Best Marks with AI Grader
Need help grading? Try our AI Grader for instant feedback on your assignments.
Factors Affecting Students’ Final Grade
Using the p-value of the model to make the conclusion we found out that the p-value for the
model was 5.469e-14 which was less than the 5% level of significance. Based on that we reject
the null hypothesis that was formulated, and we concluded that the explanatory variables were
significant in explaining the final grade of the student (Parchami, Taheri & Mashinchi, 2010).
The model had an adjusted R-squared of 90.03%. This value indicates that the model fitted the
data perfectly, implying that 90.03% variability of the model was explained by the explanatory
variables in the model (Nagelkerke, 2011).
Since we found out that at least one explanatory variable was significant in explaining the final
grade we conducted a post hoc analysis to determine which of the explanatory variables were
significant by carrying out an analysis of variance (ANOVA) based on the following hypothesis
at 5% level of significance;
H0: Bj is equal to zero, for all j=1,2,3,4
against
Factors Affecting Students’ Final Grade
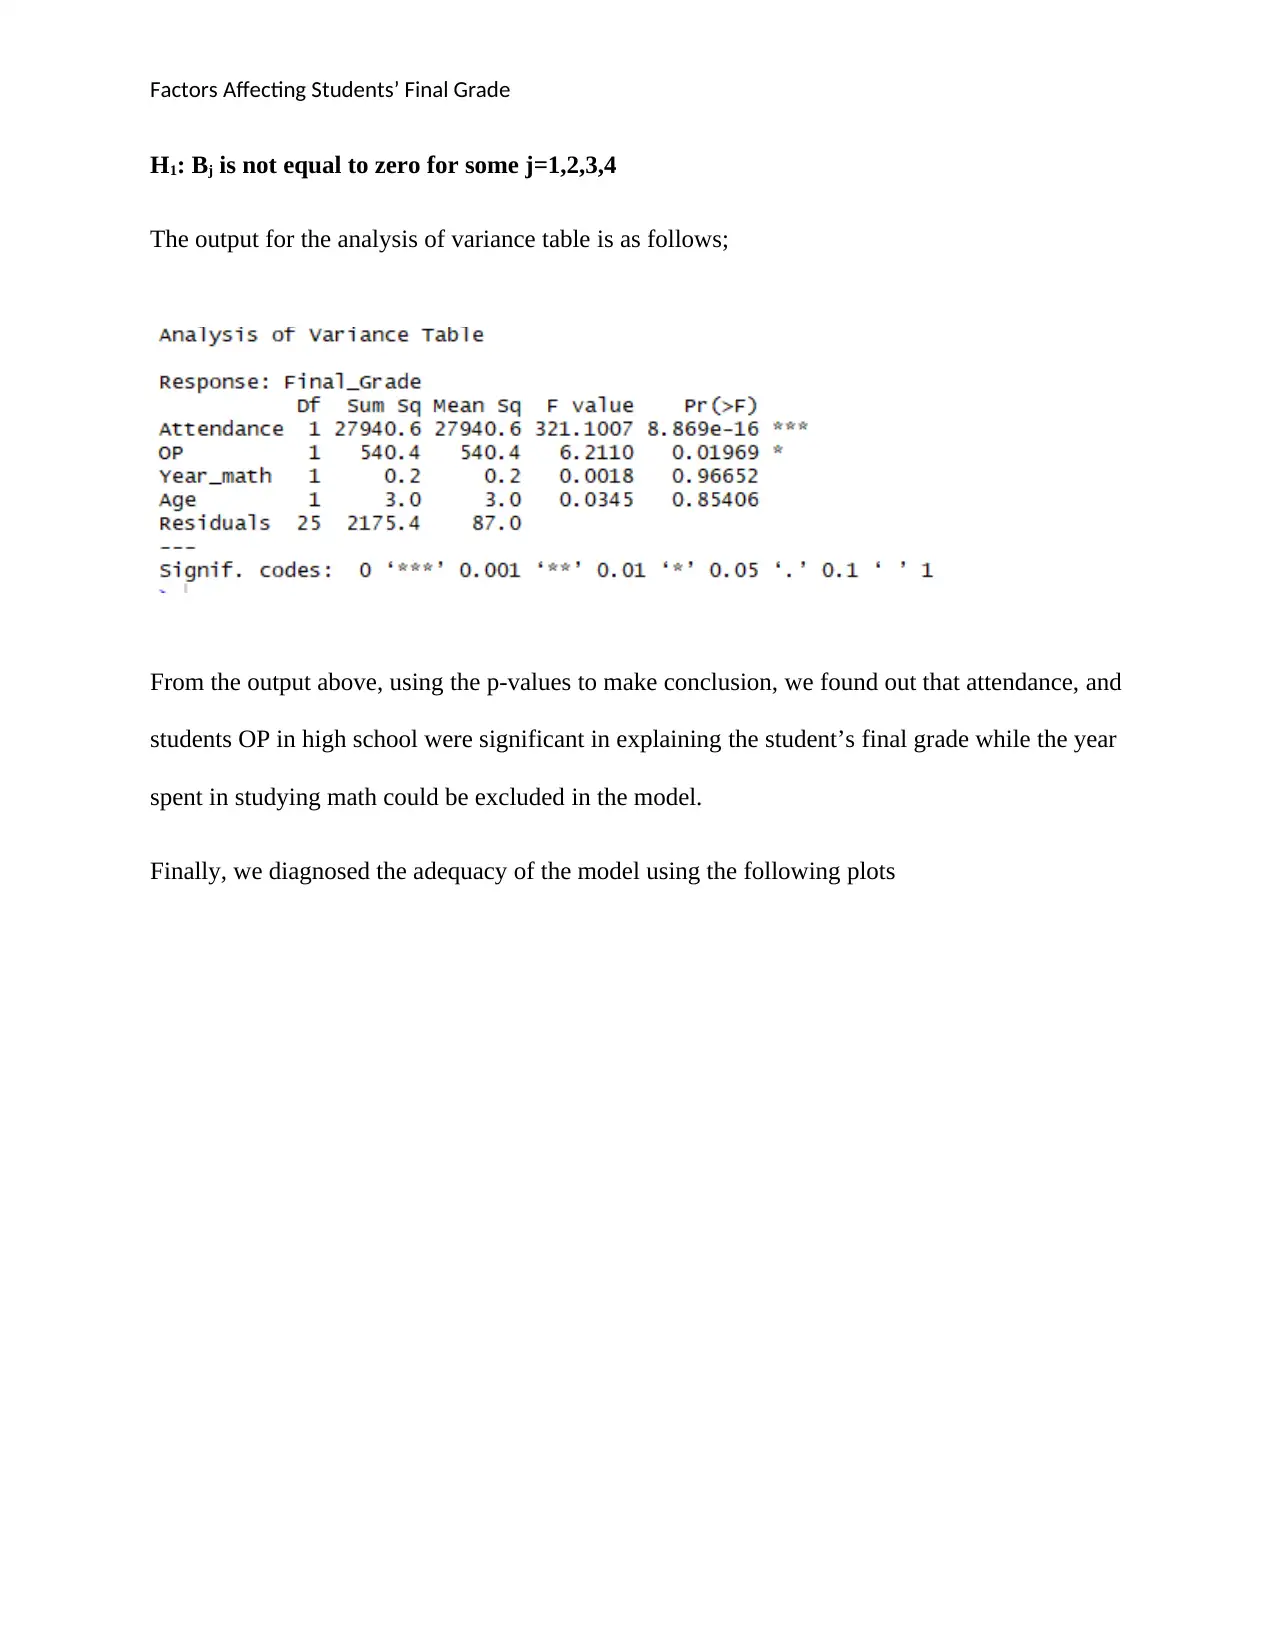
H1: Bj is not equal to zero for some j=1,2,3,4
The output for the analysis of variance table is as follows;
From the output above, using the p-values to make conclusion, we found out that attendance, and
students OP in high school were significant in explaining the student’s final grade while the year
spent in studying math could be excluded in the model.
Finally, we diagnosed the adequacy of the model using the following plots
Factors Affecting Students’ Final Grade
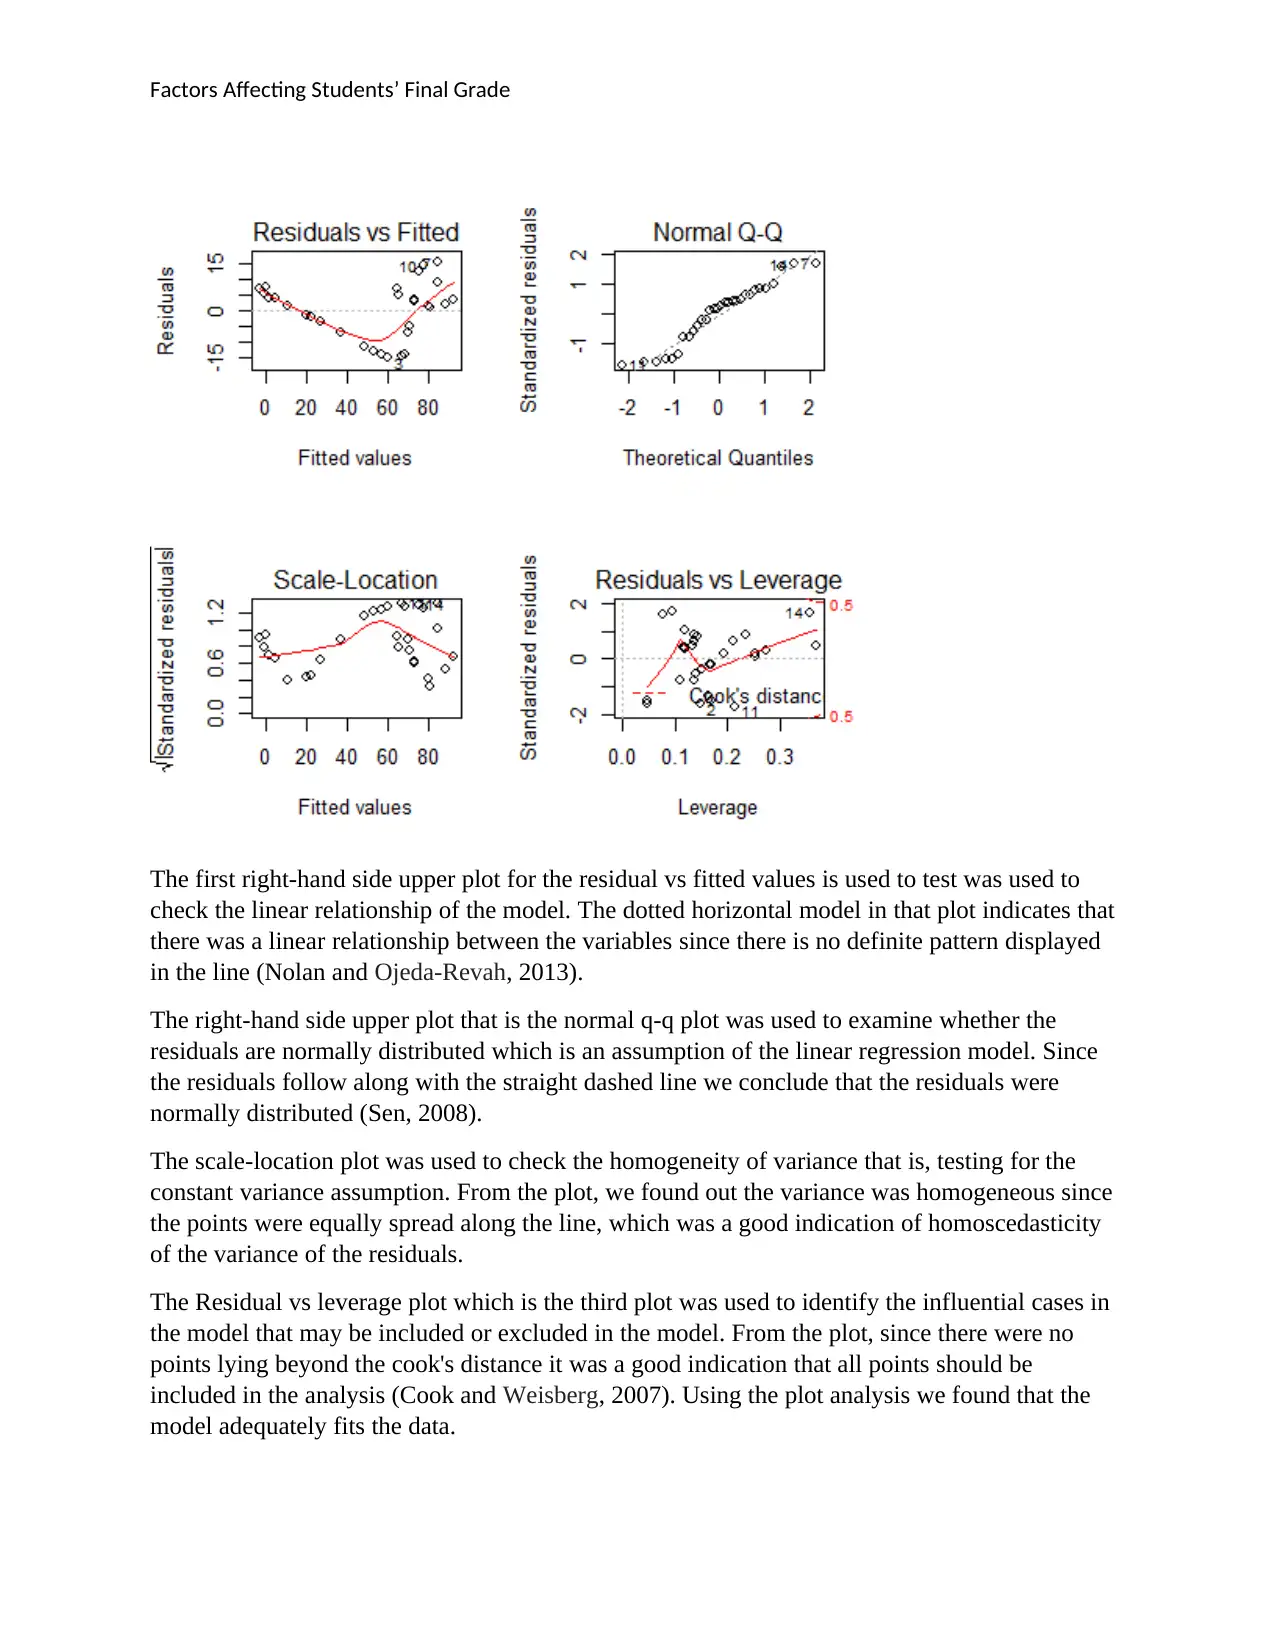
The first right-hand side upper plot for the residual vs fitted values is used to test was used to
check the linear relationship of the model. The dotted horizontal model in that plot indicates that
there was a linear relationship between the variables since there is no definite pattern displayed
in the line (Nolan and Ojeda-Revah, 2013).
The right-hand side upper plot that is the normal q-q plot was used to examine whether the
residuals are normally distributed which is an assumption of the linear regression model. Since
the residuals follow along with the straight dashed line we conclude that the residuals were
normally distributed (Sen, 2008).
The scale-location plot was used to check the homogeneity of variance that is, testing for the
constant variance assumption. From the plot, we found out the variance was homogeneous since
the points were equally spread along the line, which was a good indication of homoscedasticity
of the variance of the residuals.
The Residual vs leverage plot which is the third plot was used to identify the influential cases in
the model that may be included or excluded in the model. From the plot, since there were no
points lying beyond the cook's distance it was a good indication that all points should be
included in the analysis (Cook and Weisberg, 2007). Using the plot analysis we found that the
model adequately fits the data.
Paraphrase This Document
Need a fresh take? Get an instant paraphrase of this document with our AI Paraphraser

Factors Affecting Students’ Final Grade
In conclusion, we found out that the age of the student, class attendance, and the students OP in
high school affects the student's final grade. It is advisable for the students to school to attend
when young since we found out that the final grade reduces as the age increases. Students should
also ensure they have maximum class attendance to ensure that they increase their final grade.
Factors Affecting Students’ Final Grade
References
Cook, R. D., & Weisberg, S. (2007). Graphics for assessing the adequacy of regression models. Journal
of the American Statistical Association, 92(438), 490-499. Available from:
https://www.researchgate.net/publication/266196758_Graphics_for_Assessing_the_Adequacy_o
f_Regression_Models
Nagelkerke, N. J. (2011). A note on a general definition of the coefficient of
determination. Biometrika, 78(3), 691-692. Available from:
https://www.cesarzamudio.com/uploads/1/7/9/1/17916581/nagelkerke_n.j.d._1991_-
_a_note_on_a_general_definition_of_the_coefficient_of_determination.pdf
Nolan, J. P., & Ojeda-Revah, D. (2013). Linear and nonlinear regression with stable errors. Journal of
Econometrics, 172(2), 186-194. Available from:
https://www.researchgate.net/publication/257147114_Linear_and_nonlinear_regression_with_st
able_errors
Parchami, A., Taheri, S. M., & Mashinchi, M. (2010). Fuzzy p-value in testing fuzzy hypotheses with
crisp data. Statistical Papers, 51(1), 209. Available from:
https://www.researchgate.net/publication/227318308_Fuzzy_p-
value_in_testing_fuzzy_hypotheses_with_crisp_data
Phillips, P. C., & Moon, H. R. (2009). Linear regression limit theory for nonstationary panel
data. Econometrica, 67(5), 1057-1111. Available from:
https://www.ssc.wisc.edu/~bhansen/718/PhillipsMoon1999.pdf
Schielzeth, H. (2010). Simple means to improve the interpretability of regression coefficients. Methods
in Ecology and Evolution, 1(2), 103-113. Available from:
https://www.researchgate.net/publication/227792905_Simple_means_to_improve_the_interpreta
bility_of_regression_coefficients_Interpretation_of_regression_coefficients
Sen, P. K. (2008). Estimates of the regression coefficient based on Kendall's tau. Journal of the
American statistical association, 63(324), 1379-1389. Available from:
https://www.tandfonline.com/doi/abs/10.1080/01621459.1968.10480934
Solis, F. J., & Wets, R. J. B. (2014). Minimization by random search techniques. Mathematics of
operations research, 6(1), 19-30. Available from:
https://www.math.ucdavis.edu/~rjbw/mypage/Miscellaneous_files/randSearch.pdf
1 out of 9
Related Documents


Your All-in-One AI-Powered Toolkit for Academic Success.
+13062052269
info@desklib.com
Available 24*7 on WhatsApp / Email
![[object Object]](/_next/static/media/star-bottom.7253800d.svg)
Unlock your academic potential
© 2024 | Zucol Services PVT LTD | All rights reserved.